14 - Data Query and Filters
1.0 Introduction
This tutorial demonstrates the use of the Data Queries and Filter options when working with subsets of Dips Grid Data. While working in a Dips file, Grid Data can be either queried to generate a new Dips file of the subset of data, or dynamically filtered by view in the current Dips file.
Topics Covered in this Tutorial:
- Creating Data Filters
- Applying and Toggling Filters
- Creating a New Dips File with Data Query
Finished Product:
The finished product of this tutorial can be found in the Tutorial 14 Data Query and Filters.dips8 file, located in the Examples > Tutorials folder in your Dips installation folder.
2.0 Model
If you have not already done so, run the Dips program by double-clicking the Dips icon in your installation folder or by selecting Programs > Rocscience > Dips > Dips in the Windows Start menu.
If the Dips application window is not already maximized, maximize it now, so that the full screen is available for viewing the model.
Dips comes with several example files installed with the program. These example files can be accessed by selecting File > Recent Folders > Examples Folder from the Dips main menu. This tutorial will use the Exampleset.dips8 file to demonstrate the basic Data Query and Filter features of Dips.
- Select File > Recent Folders > Example Folder
 from the menu.
 - Open the Exampleset.dips8 file. Since we will be using the Exampleset.dips8 file in other tutorials, save this example file with a new file name without overwriting the original file.
- Select File > Save As
 from the menu.
 - Enter the file name Tutorial 14 Data Query and Filters and Save the file.
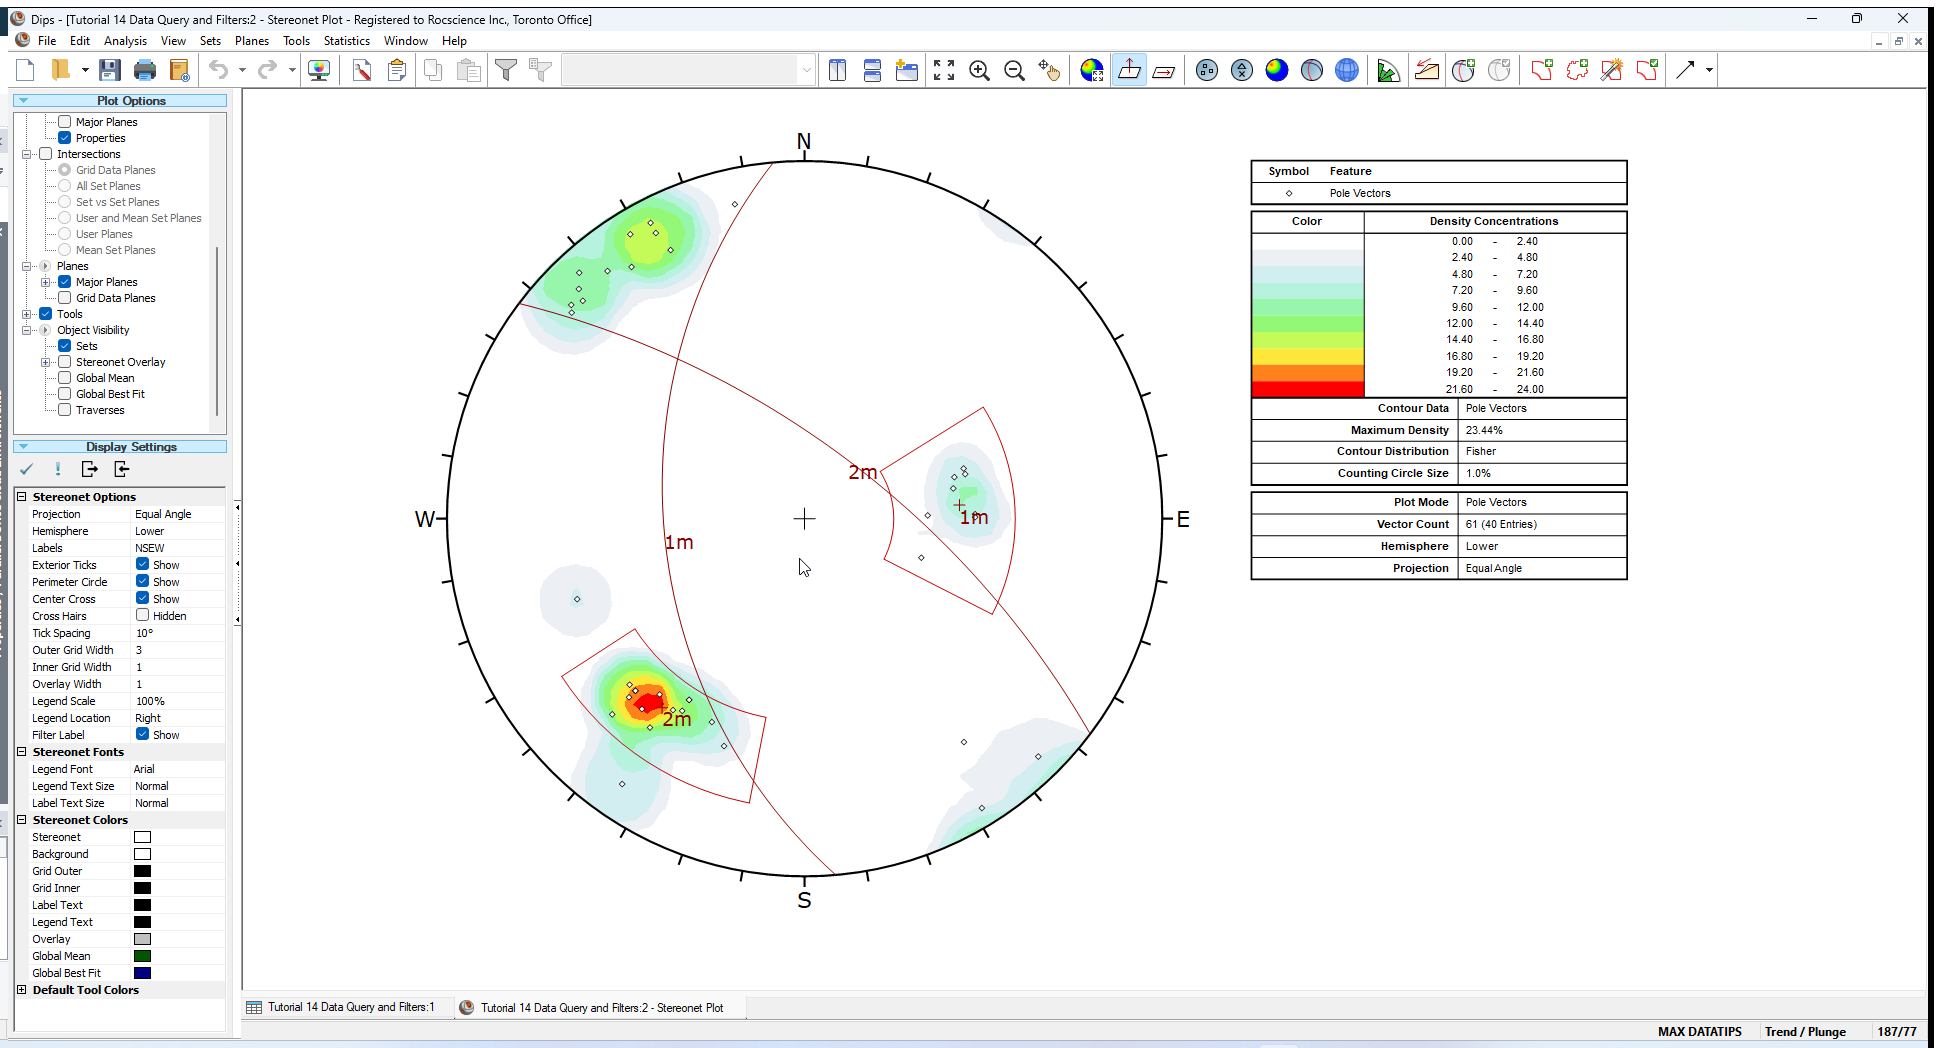
You should see the Stereonet Plot View as shown in the following figure.
If you do not see the plot below, then use the Sidebar Plot Options to view pole vectors and contours on the Stereonet.
3.0 Filter Data
We will now demonstrate how to quickly and easily create or deleted subset files from a Dips file using the Filter Options.
- Select Filter Options
 from the toolbar or the Analysis menu.
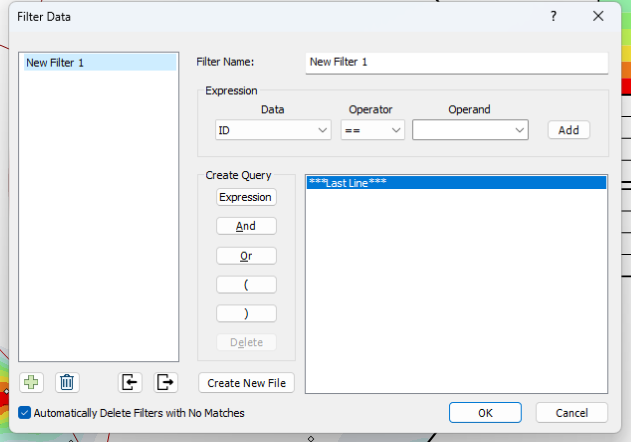
 - The Filter Data dialog will appear:
3.1 DEFINING FILTERS
The Filter Data dialog allows you to create any sort of logical expression to filter the information in any column, or any combination of columns, of your Dips file.
3.1.1 Filter Example 1
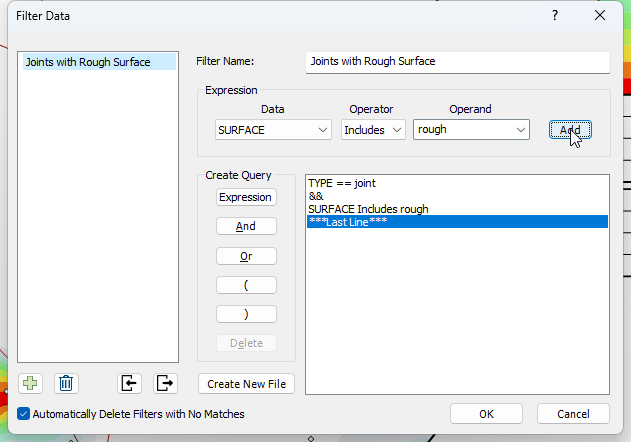
Let's start with a simple filter which searches for all JOINTS with a ROUGH surface, i.e.:
TYPE == joint && SURFACE Includes rough
In the Filter Data dialog:
- Enter Filter Name = Joints with Rough Surface.
- Create the Expression TYPE == joint. As you can see in the expression group area of the Filter Data dialog, an Expression consists of Data, Operator and Operand.
- Set Data = "TYPE" from the dropdown in the Expression groupbox.
- Set Operator = "==" from the dropdown in the Expression groupbox.
- Set Operand = "joint" from the dropdown in the Expression groupbox.
- Select the Add
 button inside the Expression groupbox. This will enter the expression TYPE == joint in the query list box.
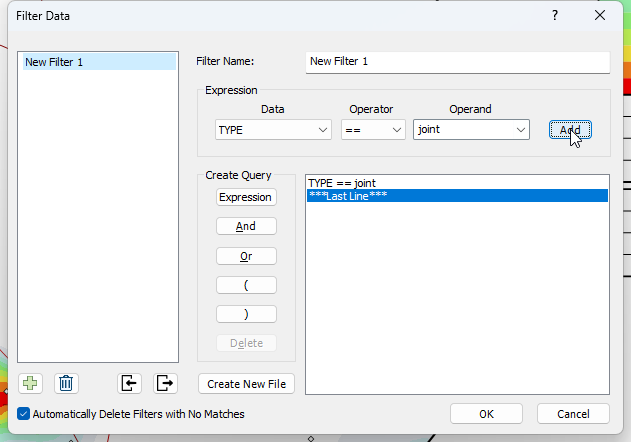
- Select the And button to enter the logical "&&" operator.
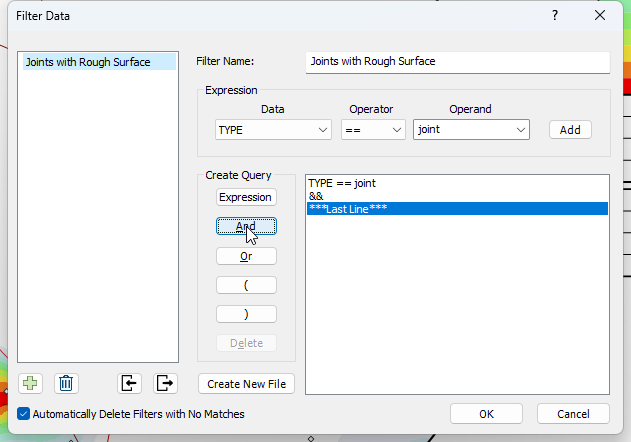
- Now create the Expression SURFACE Includes rough, in the same way as above.
- Set Data = "SURFACE" from the dropdown in the Expression groupbox.
- Set Operator = "Includes" from the dropdown in the Expression groupbox.
- Set Operand = "rough" from the dropdown in the Expression groupbox.
- Click the Add button inside the Expression groupbox.
3.1.2 Filter Example 2
Now, we will demonstrate how to create a filter from a Set, using Filter Data.
Since the Set Column records the Set ID of data belonging to Sets, this is simply a matter of filtering the Set column for the desired ID(s).
In the Filter Data dialog:
- Add a new filter by clicking the Add Filter
 button at the bottom of the Filter list.
 - Enter Filter Name = Set 1.
- Create an Expression Set == 1.
- Click the Add button inside the Expression groupbox or select the Expression button inside the Create Query groupbox.
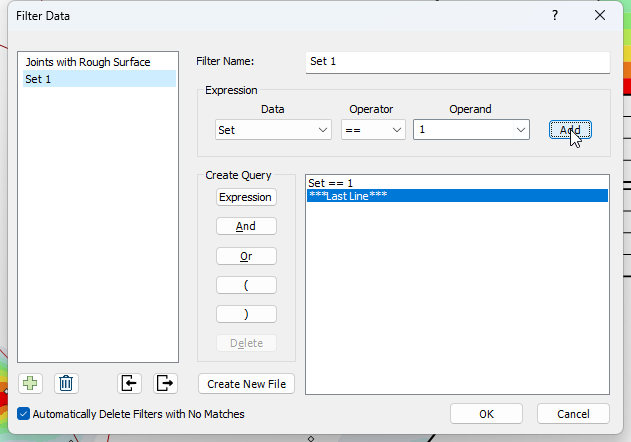
- Select OK to save the current filter(s) and exit the dialog.
See more Filter Examples.
4.0 Stereonet Plot View
Let's view the results for unfiltered Grid Data.
- Set the Stereonet Plot View to the active view. No Data Filters are currently applied to this view.
- Make sure any Planes or Sets visibilities are checked on in Sidebar Plot Options.
- Select New Pole Vector Plot
 option from the toolbar or Window menu. A new Stereonet Plot View will be generated. Any newly generated view will show Unfiltered Data by default.
 - Select Contours from the Sidebar Plot Options.
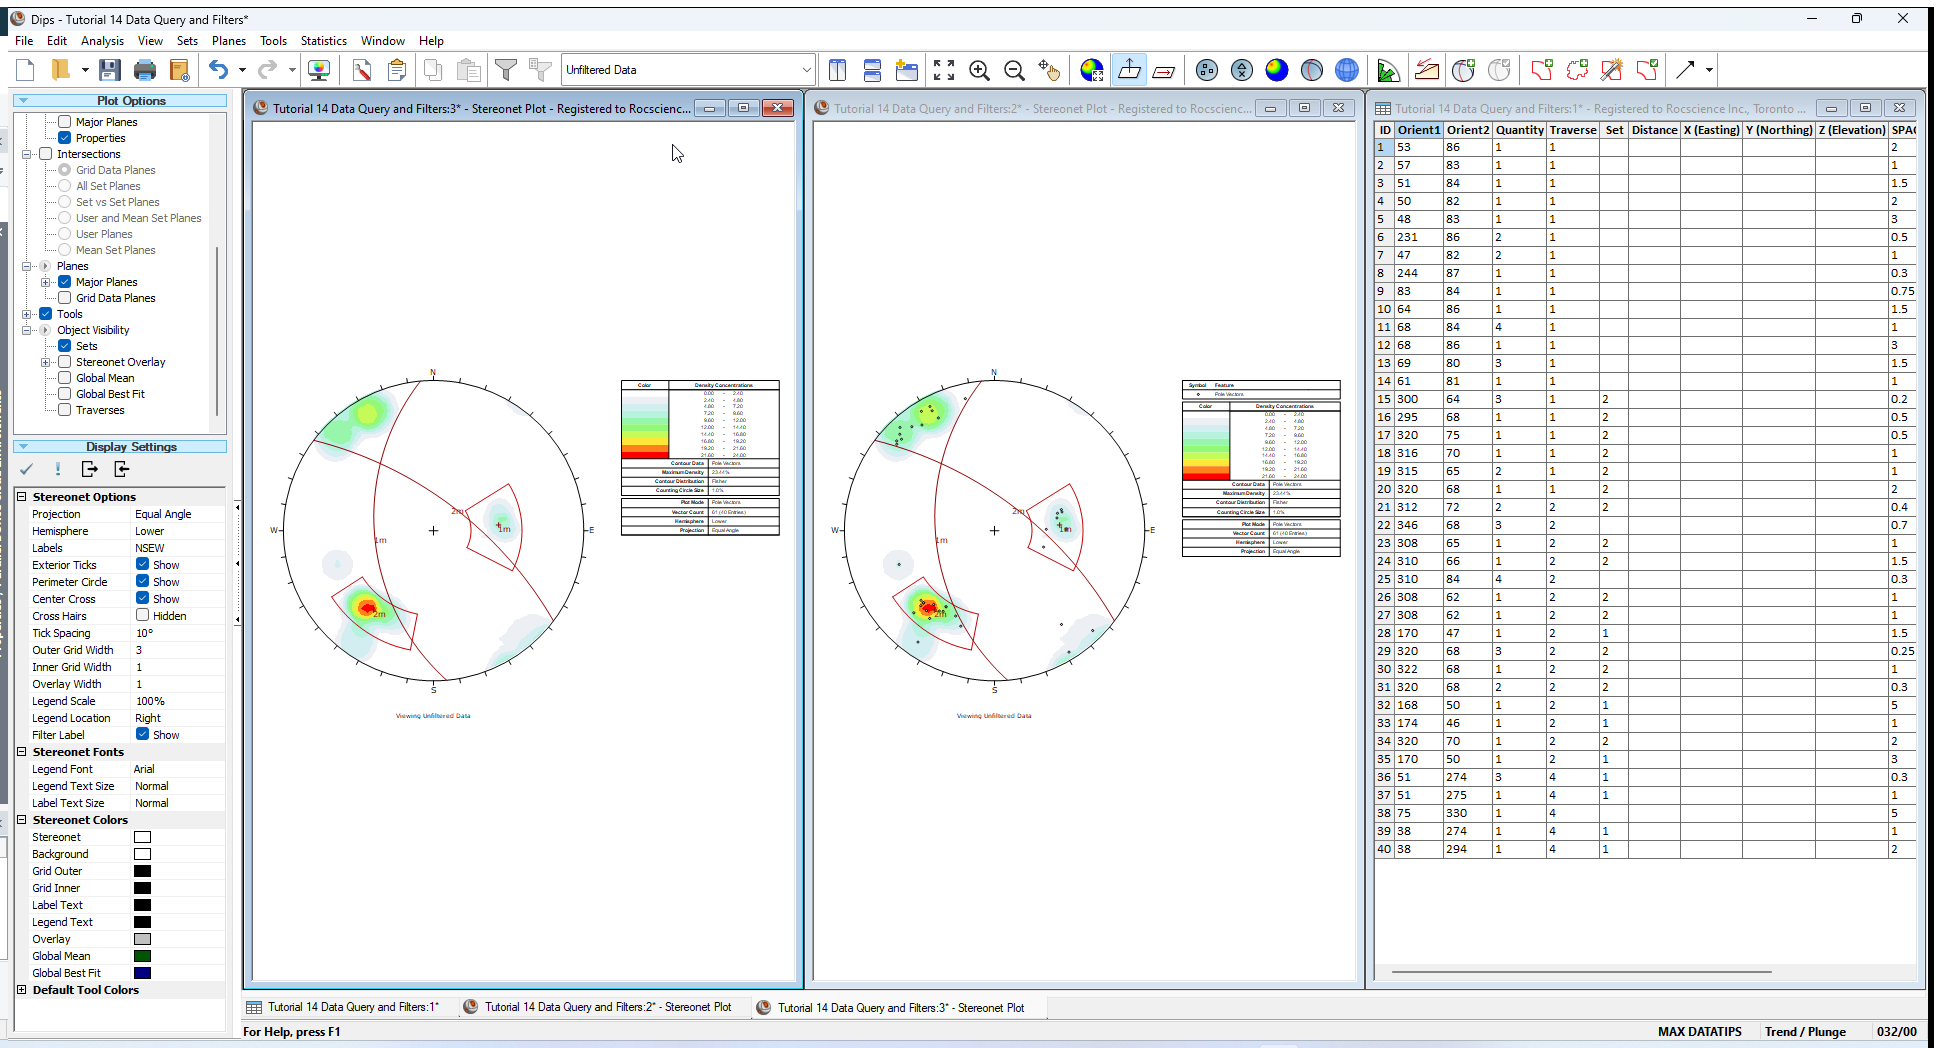
- Select Tile Vertically
 option from the toolbar or Window menu to tile the open views for easy side-by-side comparison.
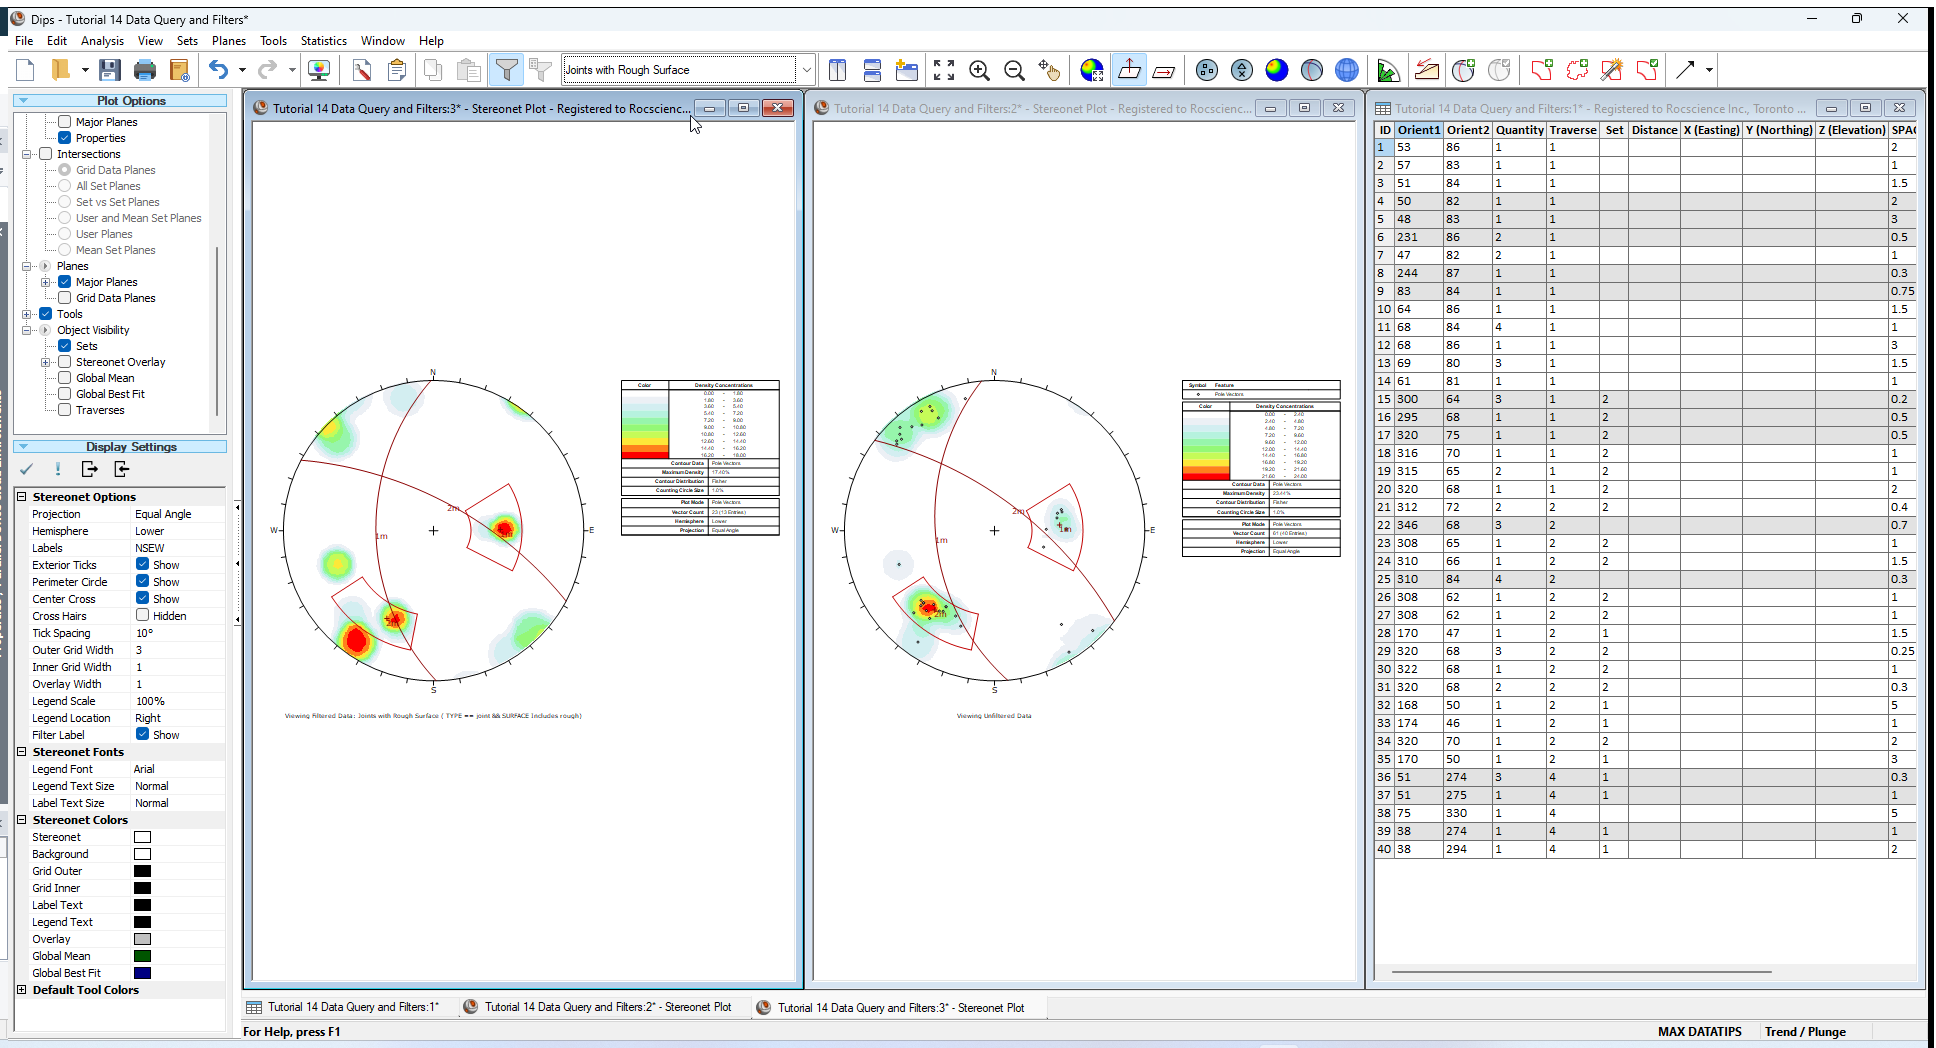
The Stereonet Plot View displays the results for Unfiltered Data.
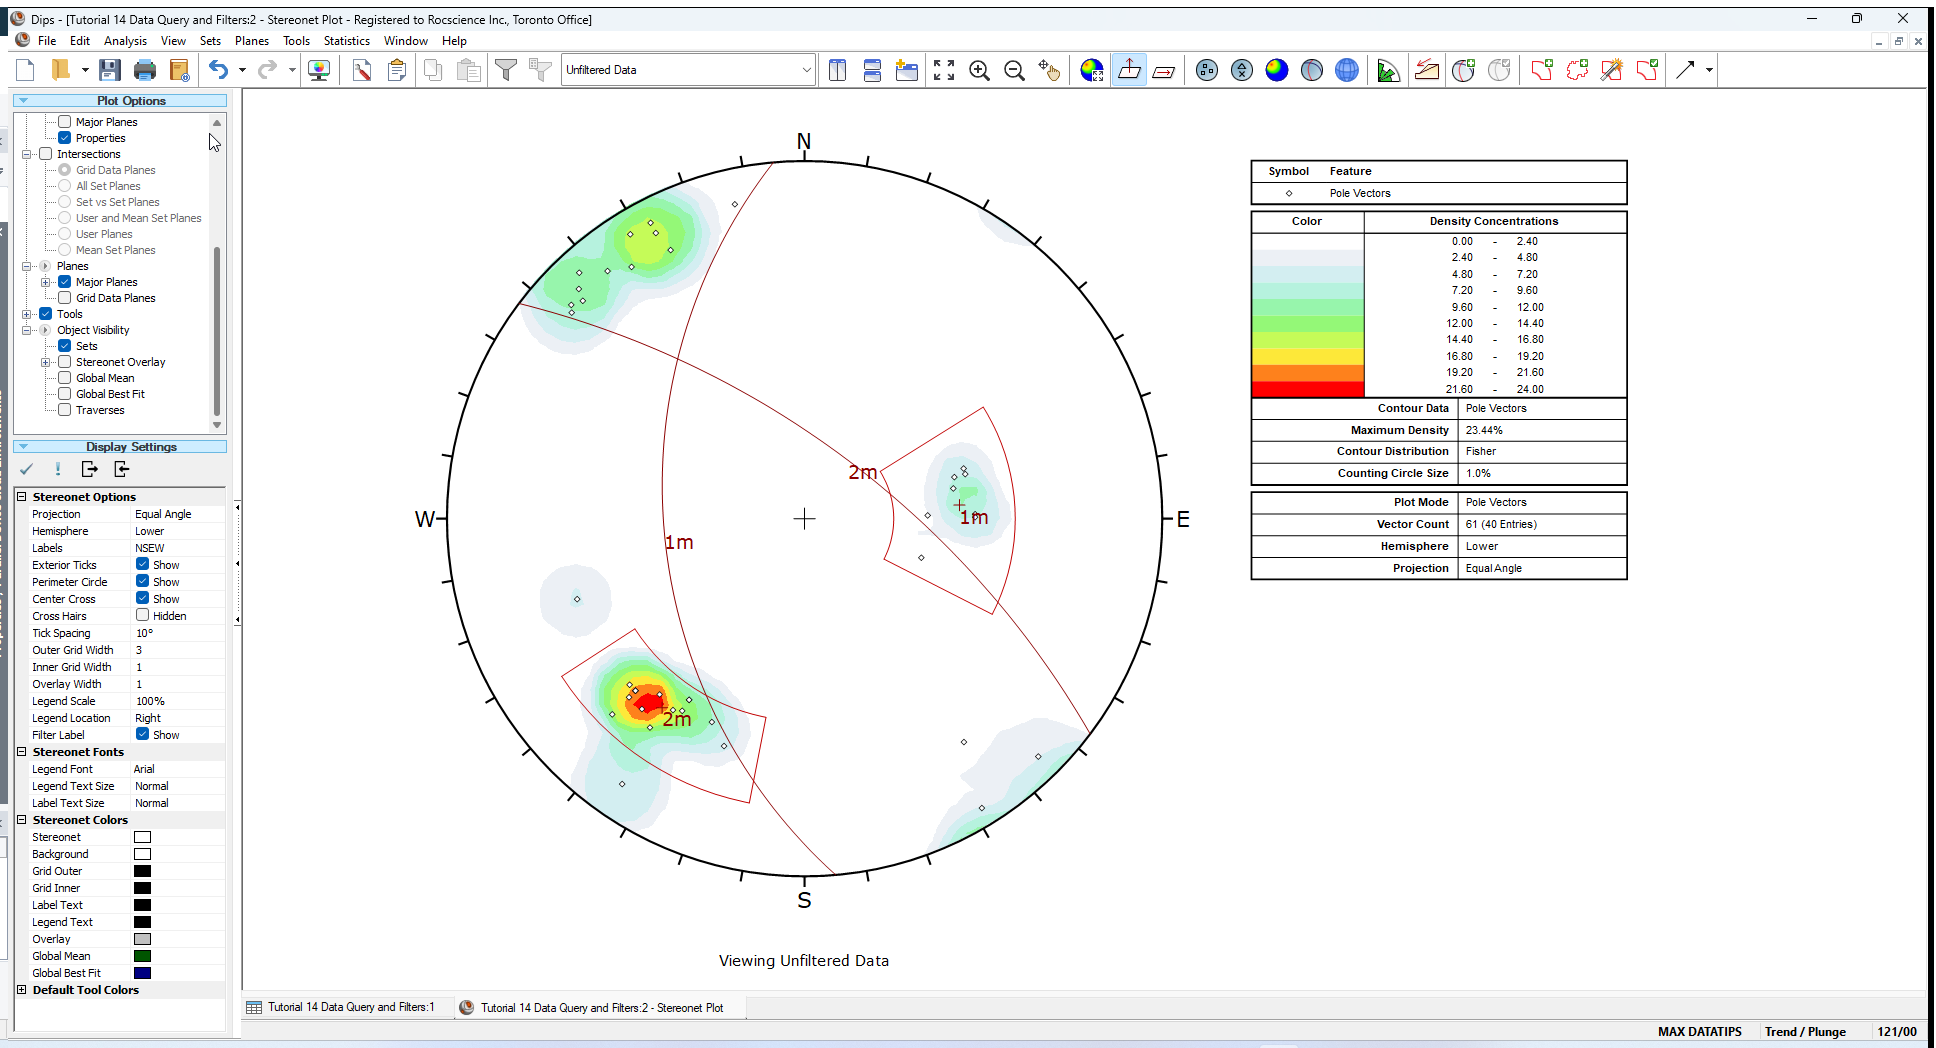
In the Legend, you can see that the Vector Count is 61 from the 40 unfiltered poles. If you sum up the numbers in the Quantity columns of all 40 rows in the Grid Data view, you will get 61.
Let's create another Stereonet Plot View to demonstrate that different Data Filters can be applied to each view.
Thus far, all views have no filters applied.
4.1 TOGGLING FILTERS IN THE STEREONET PLOT VIEW
- Set the Stereonet Plot View to the left as the active view.
- Select Data Filter = Joints with Rough Surface from the dropdown in the toolbar.
The Stereonet Plot View to the left displays the results for Joints with Rough Surface filtered data.
Notice that in the Grid Data view, the poles that meet the current filter criteria of Joints with Rough Surface are highlighted. If you carried out the above steps correctly, you should be viewing a Grid Data view with 13 highlighted rows. In the Legend, you can see that the Vector Count is 23 from the 13 filtered poles. If you sum up the numbers in the Quantity column of the 13 highlighted rows in the Grid Data view, you will get 23.
Observe that all highlighted entries in the TYPE column display " joint", which is what we expected, since this is what we were searching for. This example also demonstrates the use of the “Includes” operator, which finds all entries “including” the substring entered as Operand in the Expression.
NOTE:
- All entries in the TYPE column are exactly equal to “joint”.
- All entries in the SURFACE column “include” the string “rough” – i.e., “sl.rough”, “rough” and “v.rough”.
Now, let's change the filter in the Stereonet Plot View in the center.
- Set the Stereonet Plot View to the right as the active view.
- Select Data Filter = Set 1 from the dropdown in the toolbar.
The Stereonet Plot View to the right displays the results for Set 1 filtered data.
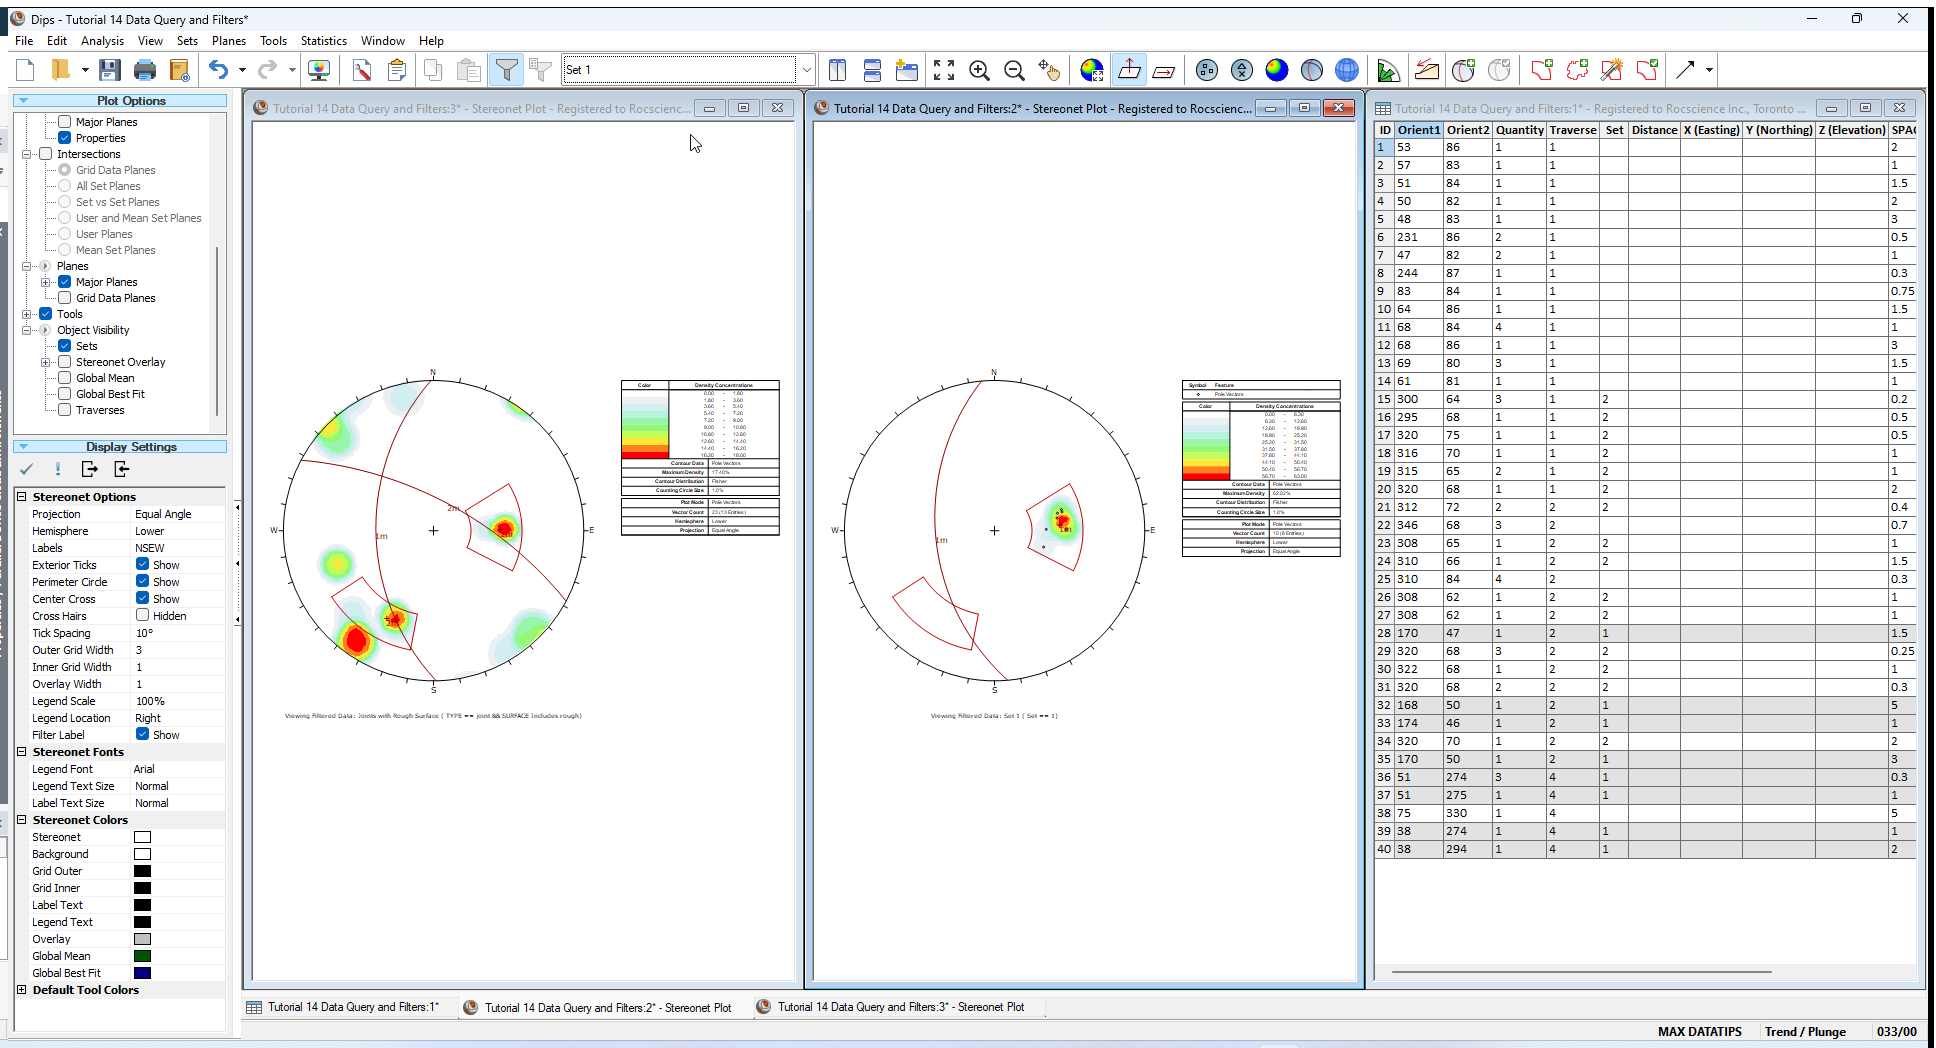
The poles in the plot are all contained within the Set Window for Set 1.
Notice that in the Grid Data view, the poles that meet the current filter criteria of Set 1 are highlighted. If you carried out the above steps correctly, you should be viewing a Grid Data view with 8 highlighted rows. In the Legend, you can see that the Vector Count is 10 from the 8 filtered poles. If you sum up the numbers in the Quantity column of the 8 highlighted rows in the Grid Data view, you will get 10. You should now be looking at the Grid Data view, with only the data in Set 1 highlighted.
WARNING: Be careful when adding Sets in a filtered view. In previous versions of Dips, Sets had to contain at least 1 pole. However, since Sets are not view-specific, Sets may contain poles in one filtered or unfiltered stereonet and not contain any poles in another filtered stereonet. In Dips version 8, Sets can be drawn in any filtered or unfiltered Stereonet Plot View and contain no poles. Also be aware that when adding overlapping Set Windows, that the overlapping poles from the earlier Set are placed in the new Set. Avoid the use of overlapping Sets when working with filtered data. Instead, replace the overlapping Sets with a single enveloping Set, and use the Filter option to obtain specific subsets of poles inside the Set.
5.0 Grid Data view
Like the Stereonet Plot view, the Grid Data view filter can also be toggled independent of other open views.
5.1 TOGGLING FILTERS IN THE GRID DATA VIEW
- Set the Grid Data view as the active view.
- Maximize the view.
- Select Joints with Rough Surface from the Data Filter dropdown in the toolbar.
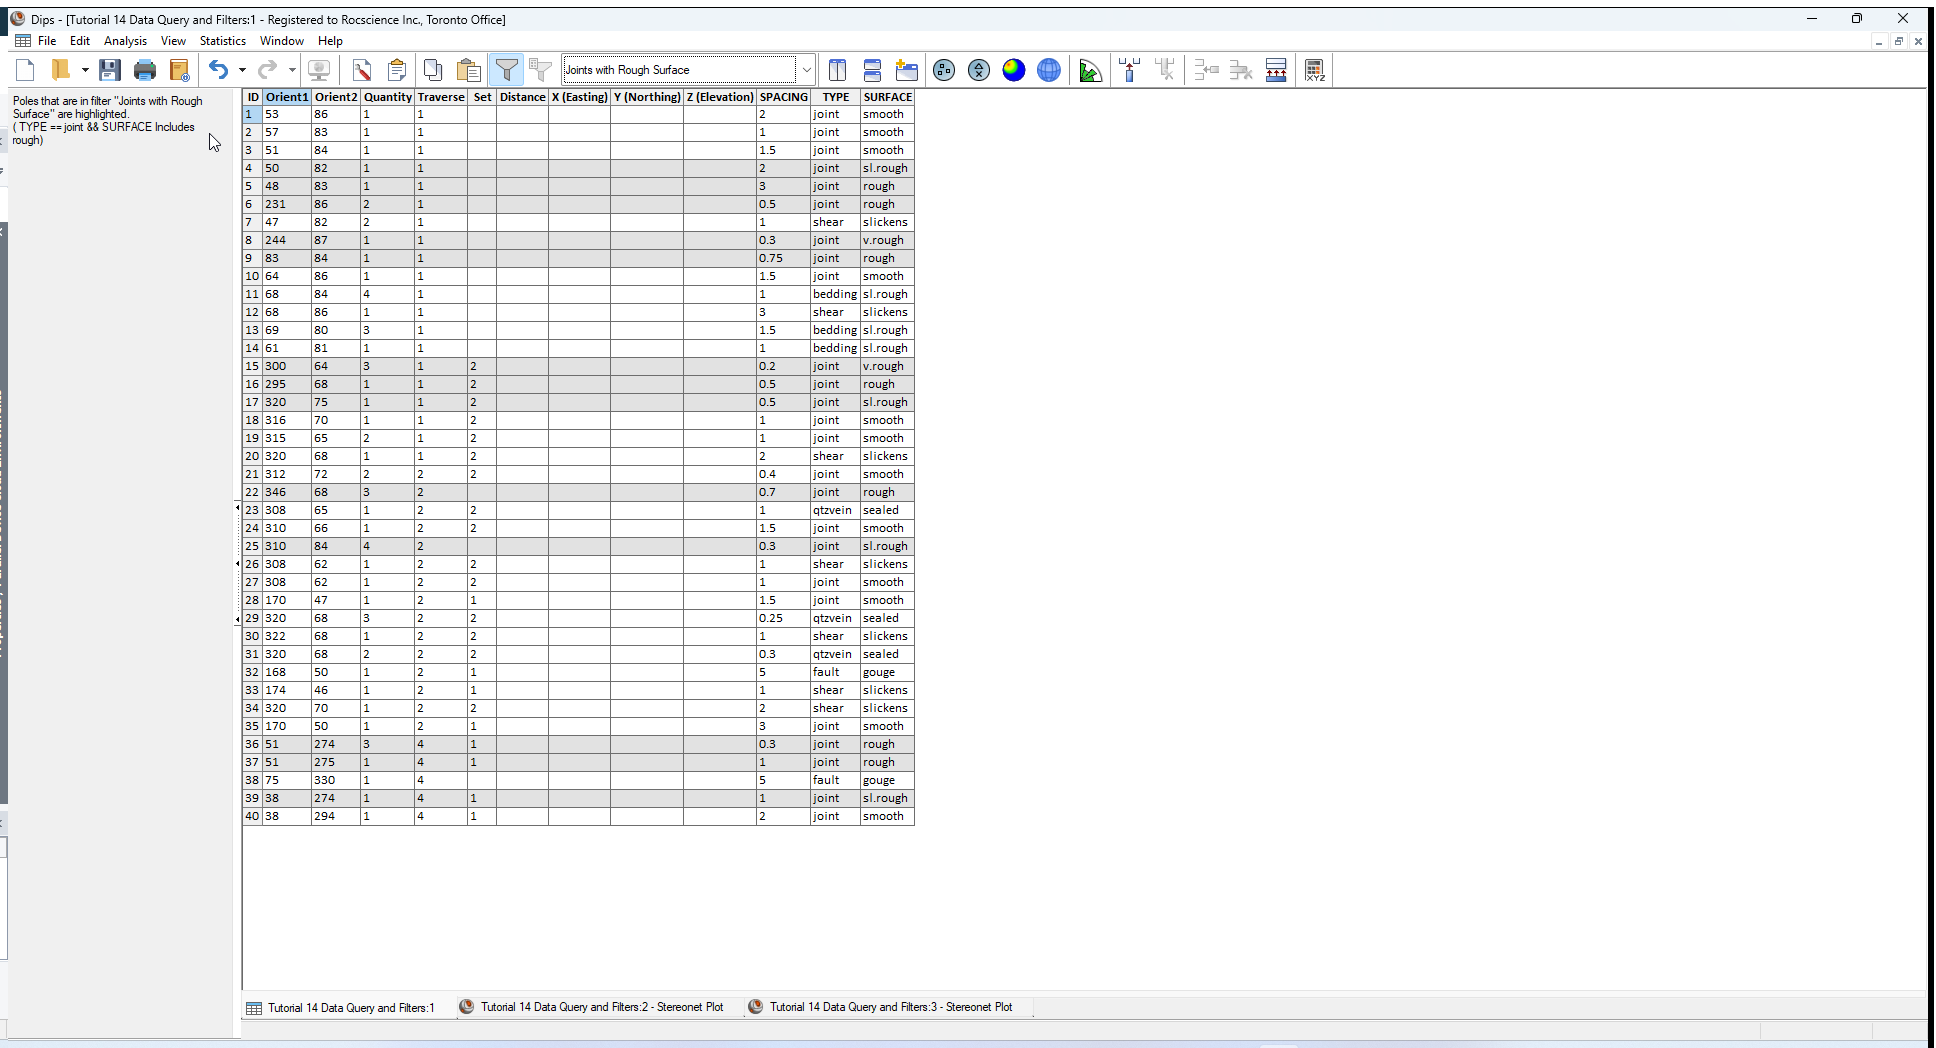
In the Grid Data view, the poles that meet the current filter criteria of Joints with Rough Surface are highlighted. If you carried out the above steps correctly, you should be viewing a Grid Data view with 13 highlighted rows. A note in the Sidebar will indicate:
Poles that are in filter "Joints with Rough Surface" are highlighted.
(TYPE == joint && SURFACE Includes rough)
As you can see, toggling between Data Filters in Dips is easy and efficient.
6.0 Chart View
Like the Stereonet Plot view, and the Grid Data view, any active Chart view filter can also be toggled independent of other open views. This will be left as an additional exercise.
Keep in mind that viewing filtered results for various analysis types can be done with by toggling the Data Filter dropdown in the toolbar.
- Kinematic Analysis
- Kinematic Sensitivity
- Quantitative or Qualitative Charts
- Joint Spacing
- RQD Analysis
- Frequency Analysis
7.0 Info Viewer
When Data Filters are defined in the Dips file, the Info Viewer will display:
- Data Filters definitions for each filter defined
- Global Mean, Global Best Fit, Mean Set Planes, Set Statistics, and Intersections for Unfiltered Data and all Filtered Data defined.
- Kinematic Analysis results for all Failure Modes for Unfiltered Data and any Filtered Data applied to an open Stereonet Plot View.
- Spacing, RQD, and Frequency analyses for Unfiltered Data and all Filtered Data defined (if applicable).
7.1 DATA FILTERS
- Select Info Viewer
 from the toolbar or Analysis menu.
 - Scroll down to the Data Filters section.
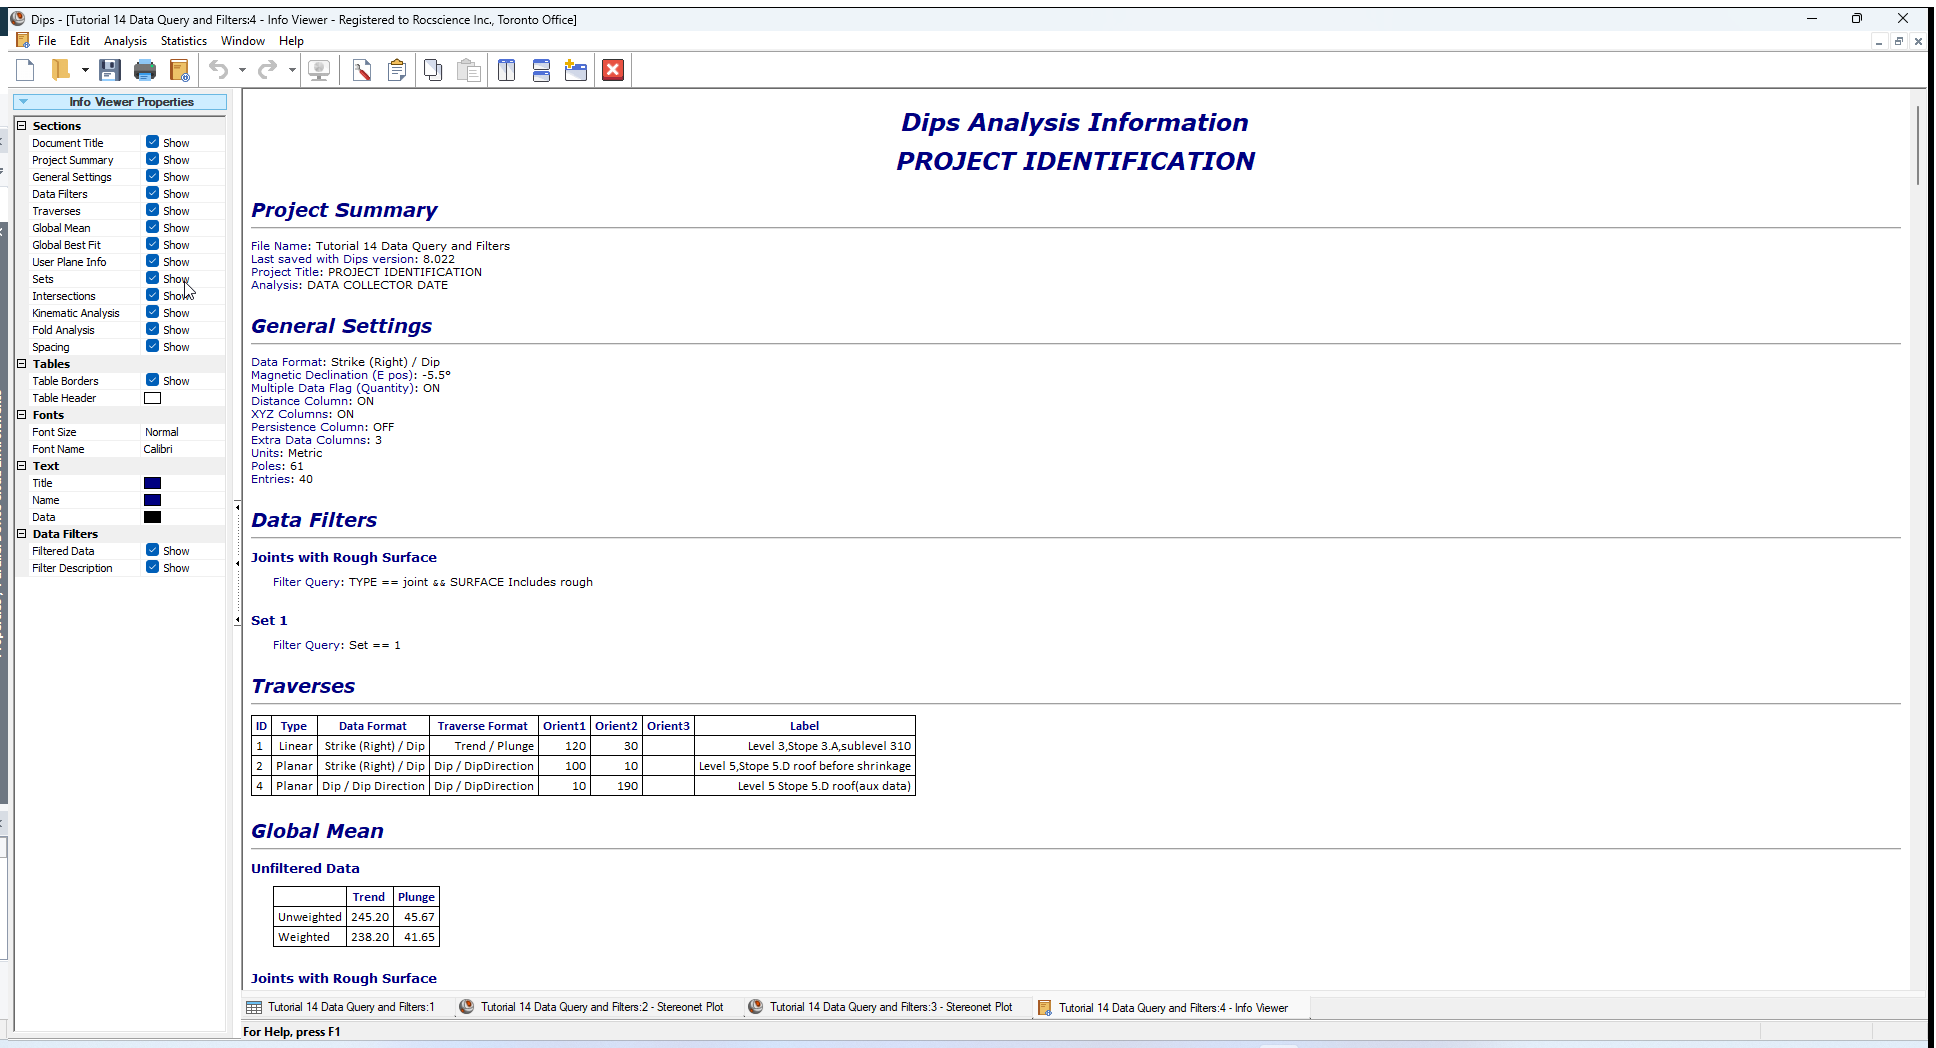
A list of filter names and definitions are displayed under the Data Filters section in the Info Viewer.
7.2 INFO VIEWER PROPERTIES
- The Data Filters section can be shown or hidden by toggling the Show checkbox in Info Viewer Properties > Sections > Data Filters.
- Results from filtered data can be shown or hidden by toggling the Show checkbox in Info Viewer Properties > Data Filters > Filtered Data.
- Filter definitions under each filter name subheading can be shown or hidden by toggling the Show checkbox in Info Viewer Properties > Data Filters > Filter Description.
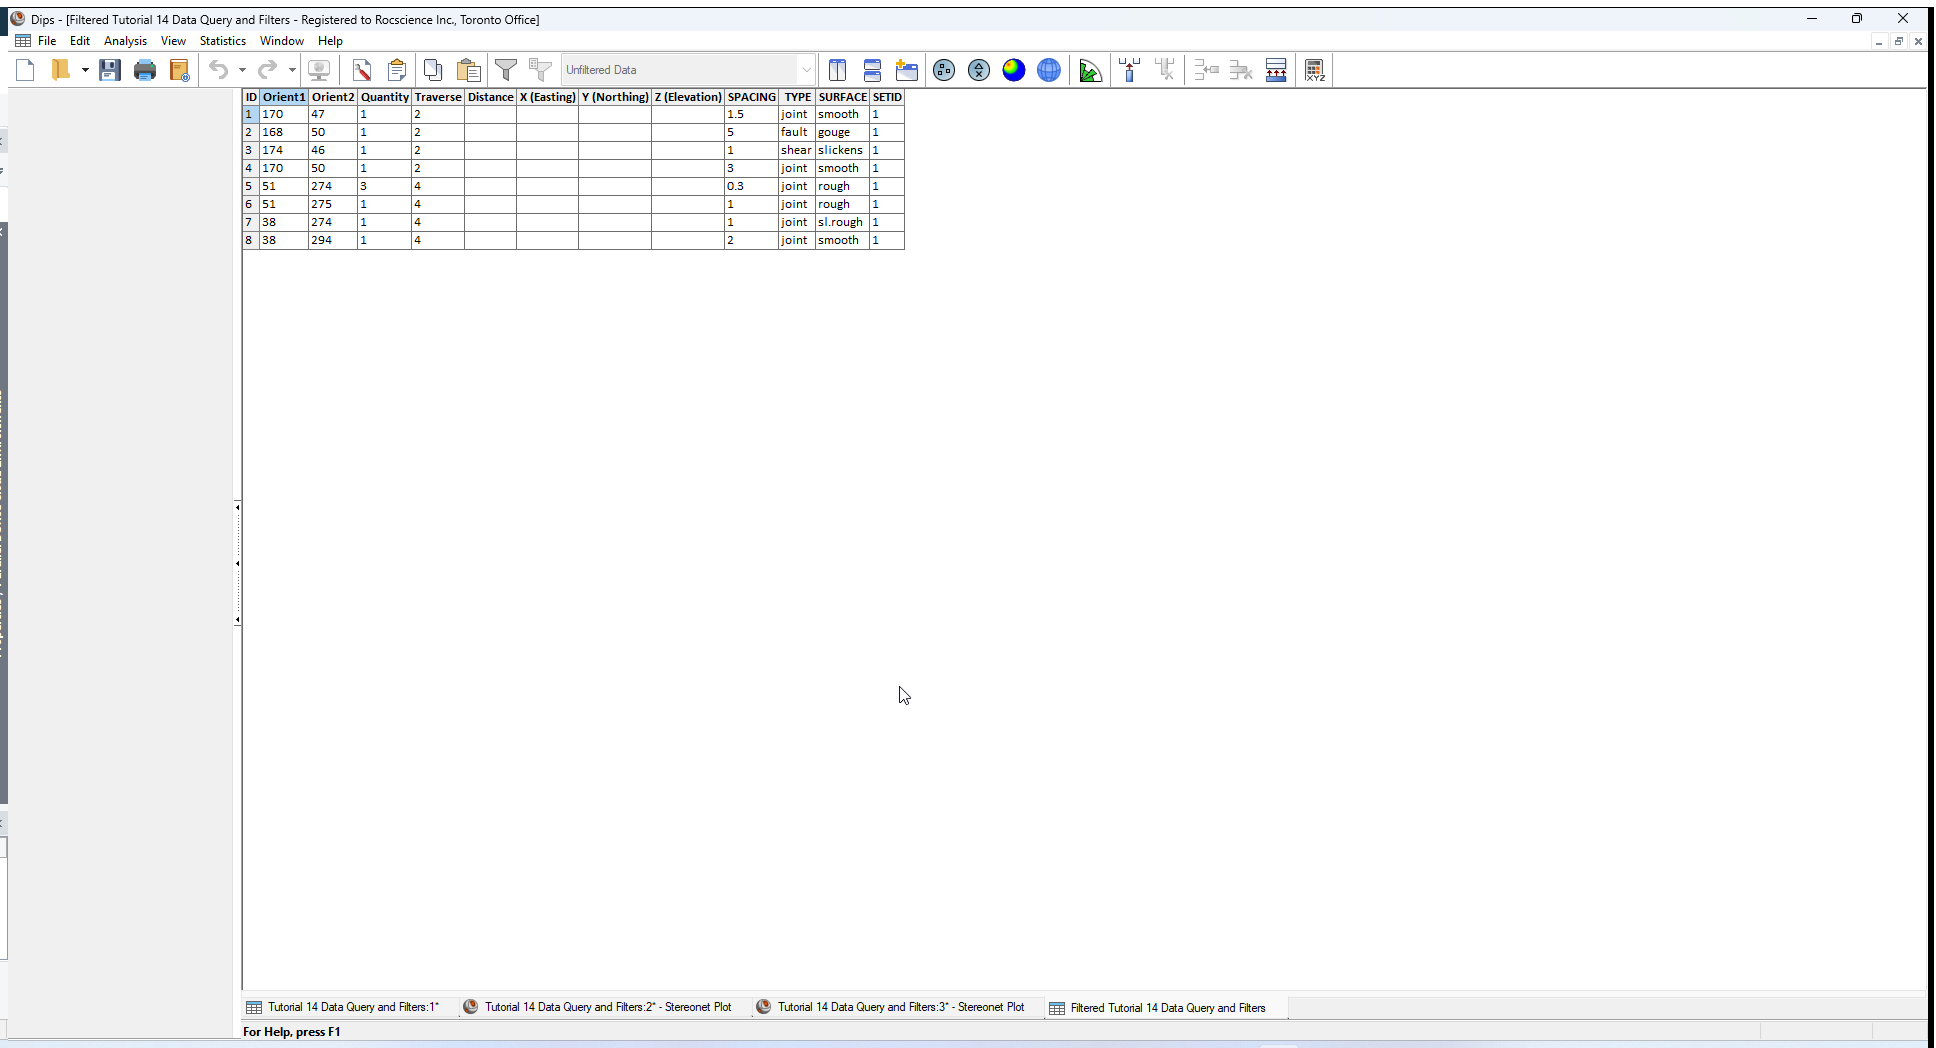
8.0 Creating a New Dips File from Query
We will now demonstrate how to quickly and easily create a new Dips file using the Filter Options.
- Select Filter Options from the toolbar or the Analysis menu.
- In the Filter Options dialog:
- Select Set 1 from the list of filters.
- Select Create New File option.
A new and untitled Dips file is created with only the subset of data defined in Set 1 filter (i.e., only poles in Set 1).
This concludes the tutorial. You are now ready for the next tutorial, Tutorial 15 - Stereonet Plot View Templates in Dips.