5 - Sets from Cluster Analysis
1.0 Introduction
This tutorial covers the addition of Sets from Cluster Analysis in DIPS.
Topics Covered in this Tutorial:
- Sets from Cluster Analysis
Finished Product:
The finished product of this tutorial can be found in the Tutorial 05 Sets (Sets from Cluster Analysis).dips8 file, located in the Examples > Tutorials folder in your DIPS installation folder.
2.0 Model
If you have not already done so, run DIPS by double-clicking on the DIPS icon in your installation folder. Or from the Start menu, select Programs > Rocscience > DIPS > DIPS.
If the DIPS application window is not already maximized, maximize it now, so that the full screen is available for viewing the model.
DIPS comes with several example files installed with the program. These example files can be accessed by selecting File > Recent Folders > Examples Folder from the DIPS main menu. This tutorial will use the Example.dips8 file to demonstrate the basic plotting features of DIPS.
- Select Files > Recent Folders > Example Folder
 from the menu .
 - Open the Example.dips8 file. Since we will be using the Example.dips8 file in other tutorials, save this example file with a new file name without overwriting the original file.
- Select File > Save As
 from the menu.
 - Enter the file name Tutorial 05 Sets Tutorial (Sets from Cluster Analysis) and Save the file.
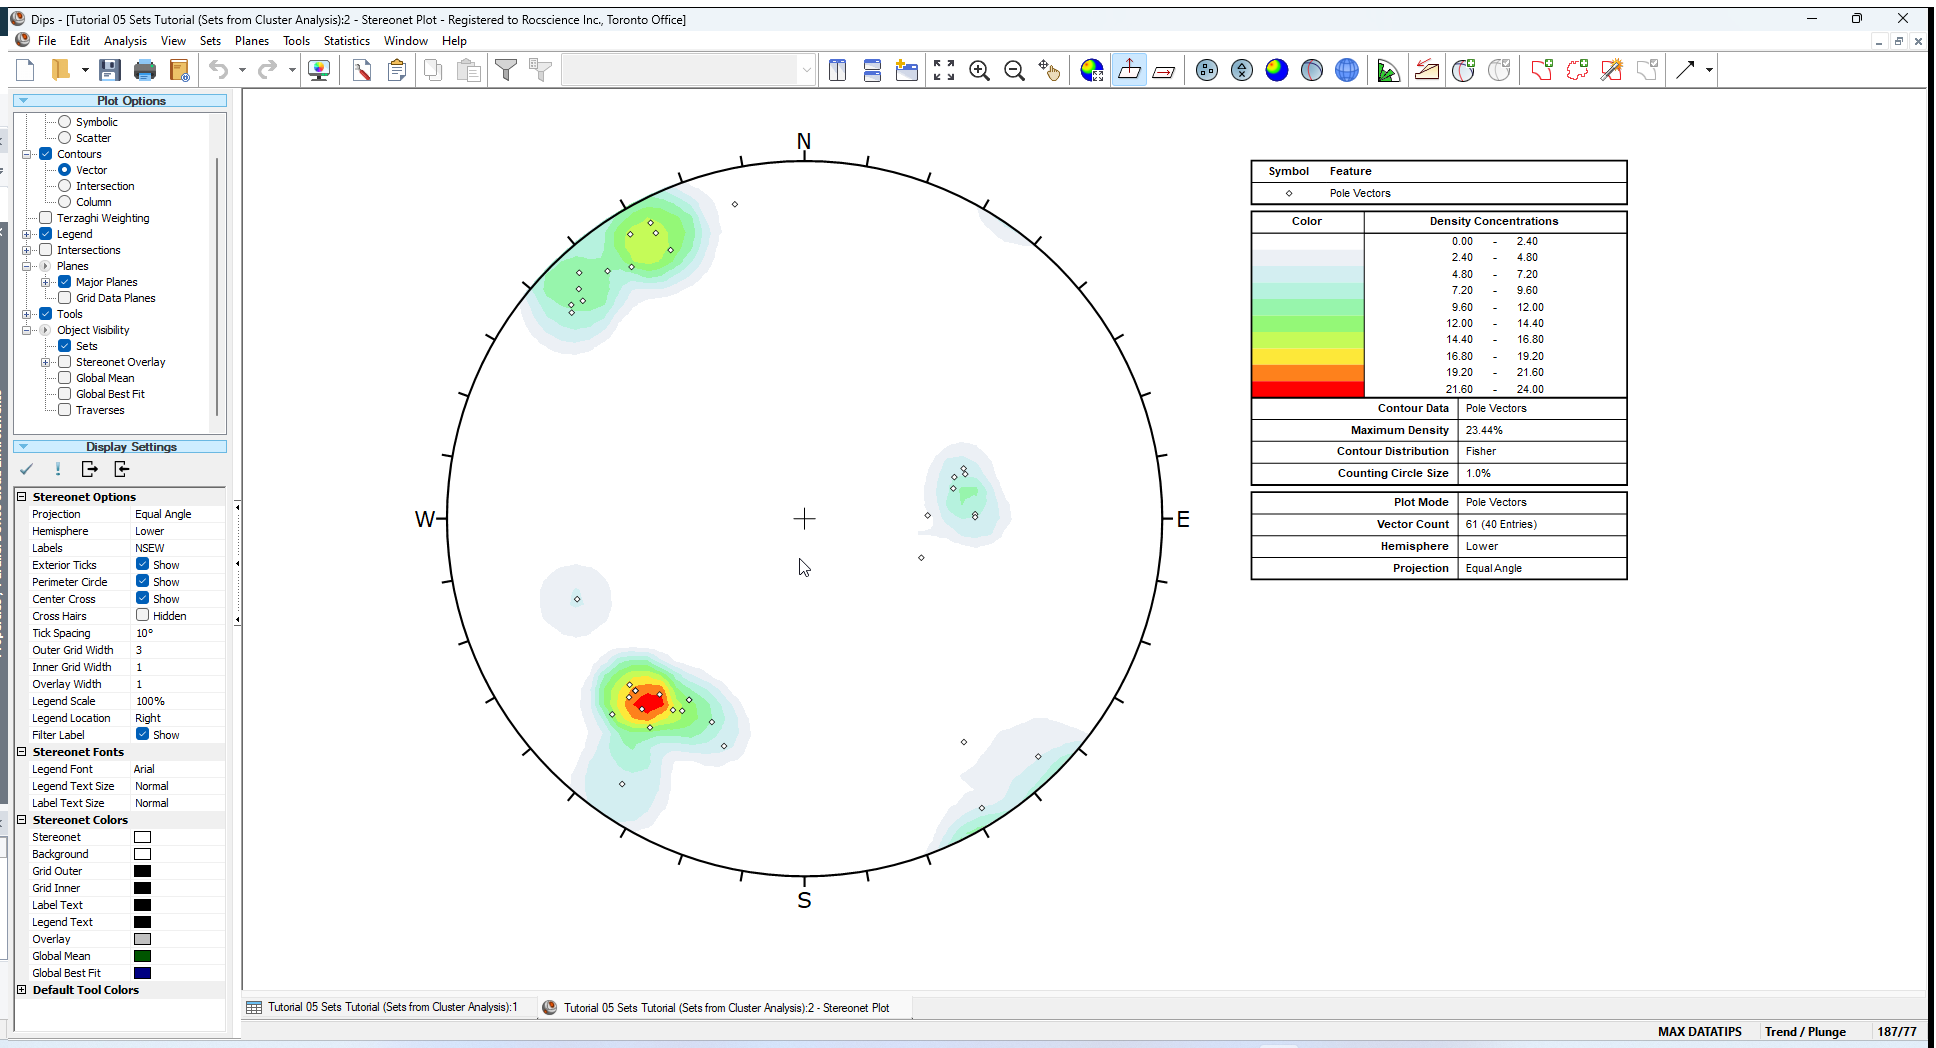
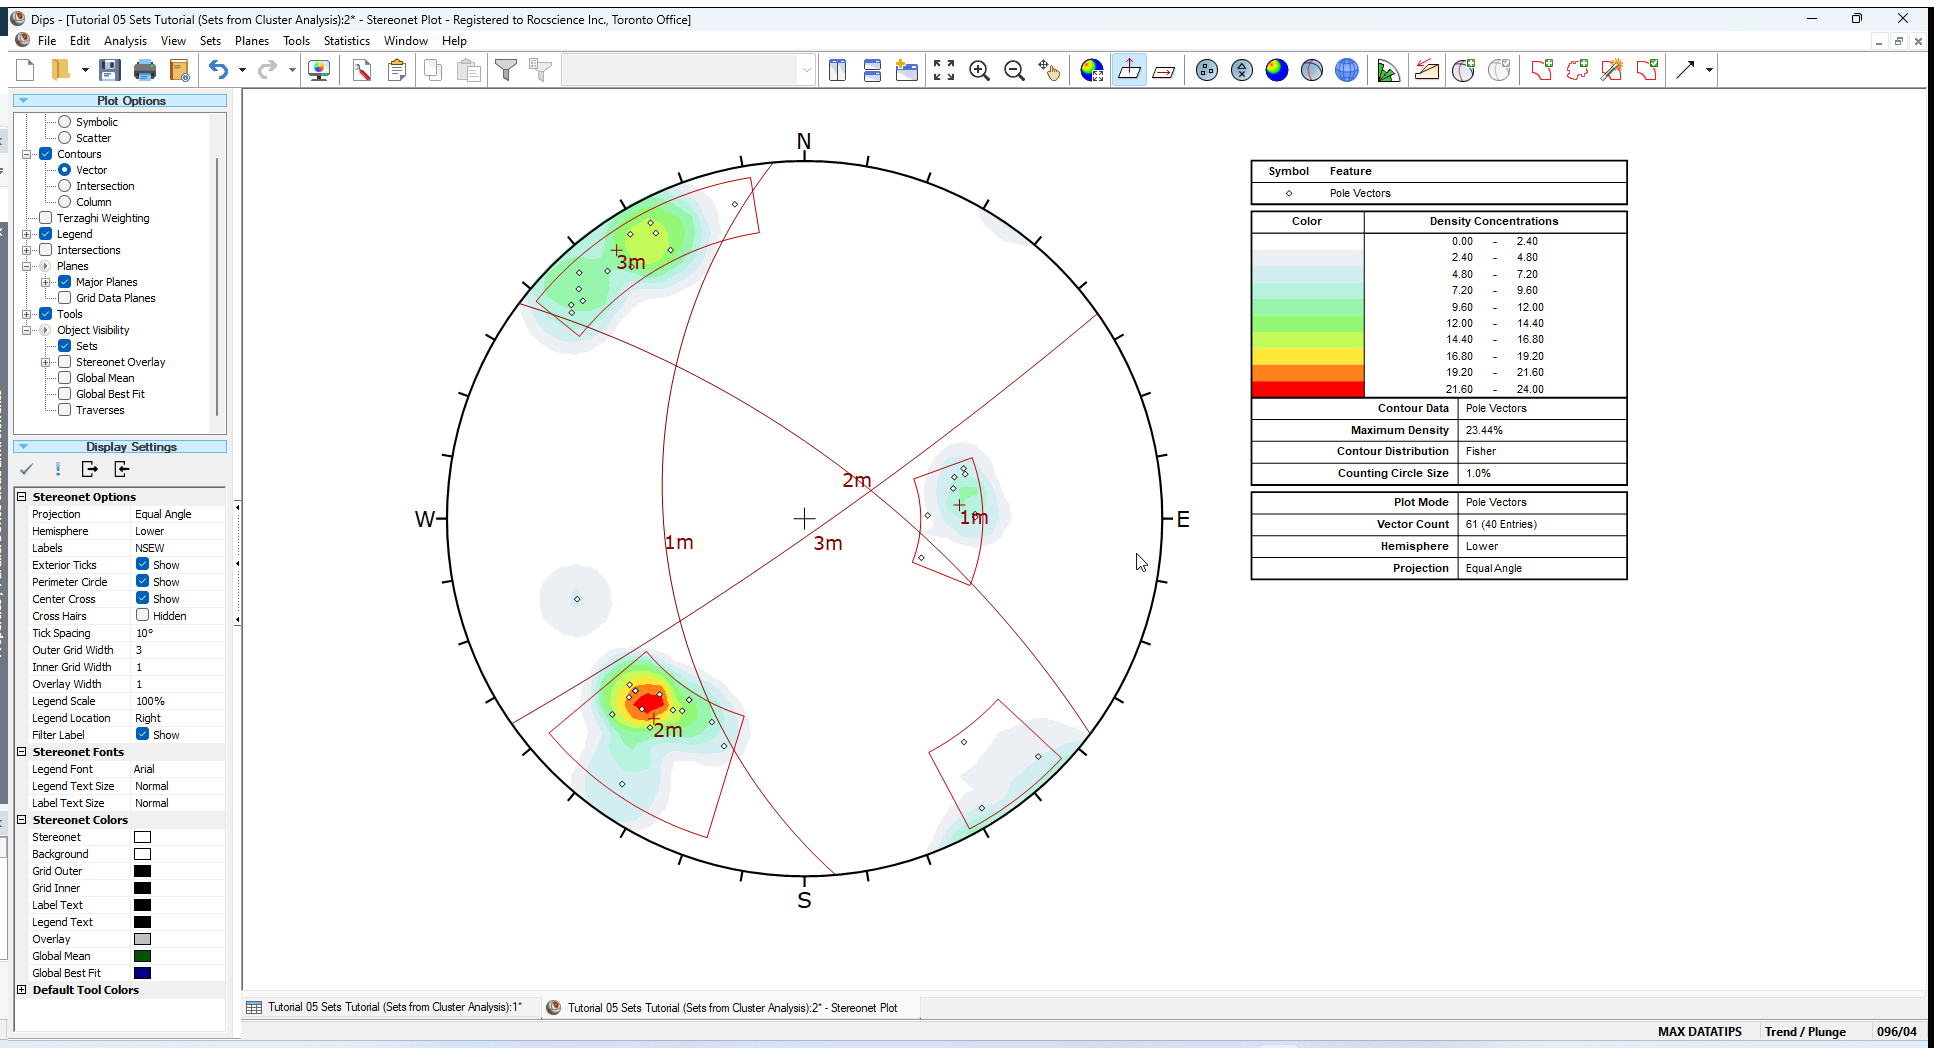
You should see the stereonet plot view shown in the following figure.
If you do not see the plot below, then use the Sidebar Plot Options to view pole vectors and contours on the Stereonet Plot View.
3.0 Adding Sets
A Set as defined in DIPS is a grouping of poles created with one of the following options in the Set menu:
- Add Set Window

- Add Set Freehand

- Add Set Circular
- Sets from Cluster Analysis

Sets are created for the purpose of obtaining Mean Set Plane orientations and Set Statistics of data clusters.
Another option which can be used to create Sets is the Sets from Cluster Analysis option. This option uses Fuzzy Cluster Analysis to automatically determine Sets which have been pre-selected by the user. The following is just a quick demonstration, for further information see the Sets from Cluster Analysis topic.
- Select Sets from Cluster Analysis option from the toolbar or the Sets menu.
- In the Sets From Cluster Analysis dialog:
- Enter Limit Cluster Size to Cone with Maximum Angle = 25 degrees.
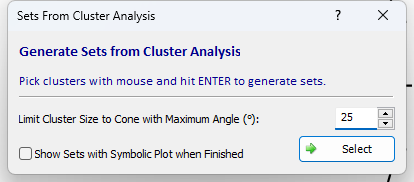
- Click on the Select
 button in the dialog.
 - Use the mouse to click on the approximate centers of the 3 main data clusters on the stereonet, using the contours as a guide. You will notice a 25 degree cone is displayed as you make your selection.
- When you are finished selecting the 3 sets, right-click and select Done
 or press Enter.
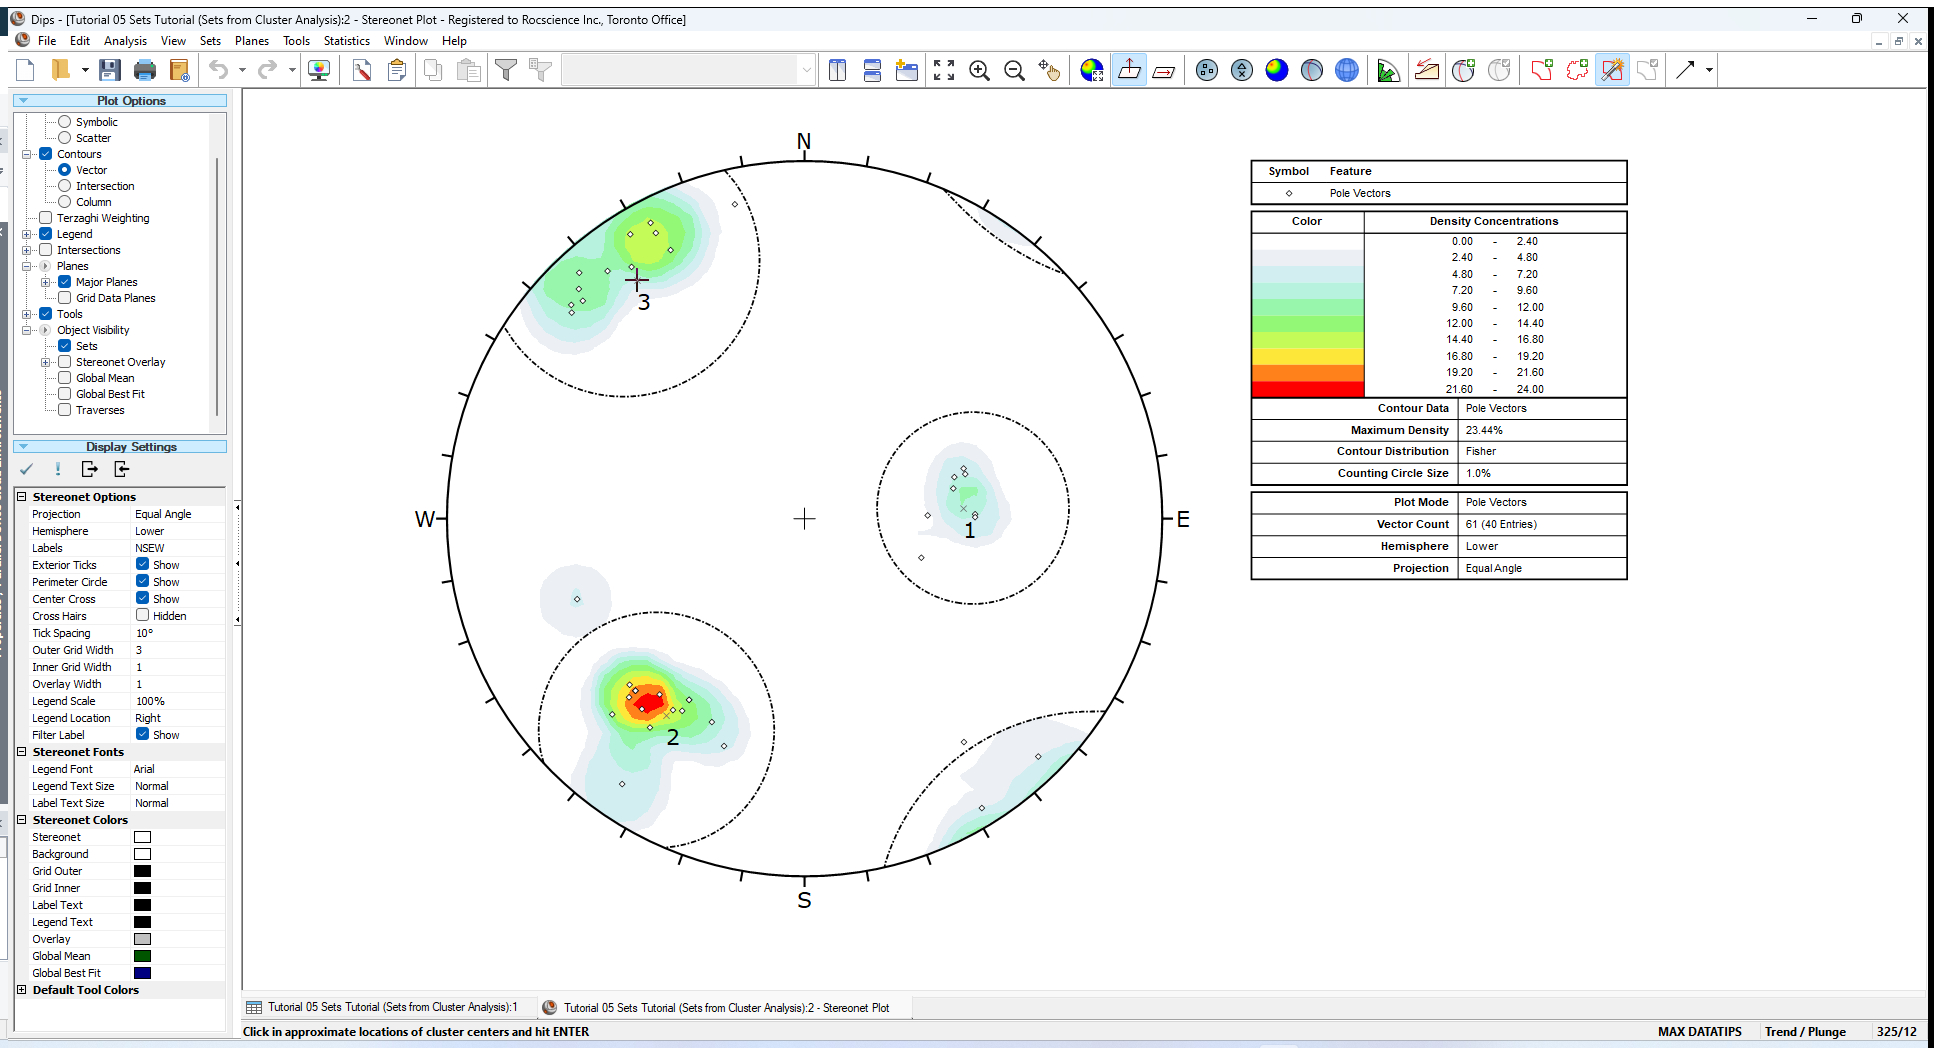
Your screen should look as follows:
- Check the Info Viewer
 . The mean plane orientations should be identical to the freehand and 4-sided set window results.
Notice that Set 2 (the wrapped data set) is automatically determined by the Cluster Analysis algorithm. The Set is defined by 2 Windows on opposite sides of the stereonet and the mean plane is calculated assuming that the data is wrapped. This is one convenient feature of using Sets from Cluster Analysis – Wrapped Sets are automatically accounted for and can be determined with a single mouse click.
In this case the Set Windows determined by the Cluster Analysis are all simple 4-sided curvilinear windows. In general, the Set Windows from a Cluster Analysis may be “stepped” in order to conform to the poles in the data set. You will notice this for larger more complicated data clusters.
Finally we should note that the Set Windows created from the Add Set Freehand option or the Sets from Cluster Analysis option CANNOT be graphically edited after they have been created. Only windows created with the Add Set Window option can be graphically edited after they are created. If you need to edit Set Windows from freehand or Cluster Analysis, you will have to delete the Set Window and repeat the selection process until the results are satisfactory.
This concludes the tutorial. You are now ready for the next tutorial, Tutorial 06 - Planes in DIPS.