4 - Geometry, Occurrences and Area Partitioning
1.0 Introduction
Analyst is a convenient tool designed for visualizing and assessing 3D models. It allows users to perform geometric measurements like dip direction and dip angle, areas, distances, point locations etc. directly on a 3D model by marking the appropriate location on the model with the computer mouse. Analyst is specifically designed for analyzing 3D models of rock faces or terrains across various scales, such as tunnel faces, drift faces, caverns, rock slopes, quarries, open-cut mines, laboratory samples, and constructions like dams.
In this tutorial you will become familiar with using the Geometry, Occurrences and Area Partitioning auxiliary tools in ShapeMetriX’s Analyst.
Topics Covered in this Tutorial
- 3D Model Input
- Basic Settings & Tools
- Geometry Measurements and Tools
- Occurrences
- Area Partitioning
Project Files and Finished Product
The finished product of this tutorial as well as all project materials are located in Tutorial 4 - Geometry, Occurrences and Area Partitioning.zip.
1.1 Analyst Functions
Analyst features a fast and detailed visualization of single, multiple and merged 3D models by the measurements of orientations, distances, lineaments, rock bridges (non-persistent elements), coordinates, occurrences (water, single events), partitioning of areas (lithology and homogeneous areas), and many more, which are called Annotation Elements.
In addition, Analyst also includes attributes like grouping measurements into Structure Sets, semi-automatic trace detection, automatic joint set clustering, orientation of areas and traces including stereographic projection and statistics, defining scanlines and mapping regions, lithologic region and homogenous area mapping, etc. to streamline the geological and geotechnical assessment of rock and terrain surfaces.
Once a 3D model is ready, Annotation Elements can be placed directly on the model. These elements are organized into individual groups:
- Structures
 – includes orientation, trace, area measurements, analysis zones and scanlines, discontinuity model, trace map and stereonet analysis, clustering, etc.
 - Geometry
 - includes volume, area, linearity measurements, contour line, cutoff plane, depth colouring, etc. tools.
 - Occurrences
 – includes water, punctual and non-punctual occurrences.
 - Area Partitioning
 – includes lithological region and homogeneous area mapping.
2.0 3D Model Input
If you have not already done so, run the ShapeMetriX (SMX) program by:
- Double-clicking the SMX
 icon on the desktop, in your installation folder or by selecting Programs > ShapeMetriX > ShapeMetriX in the Windows Start menu.
 - When the program starts, select Analyst
 to run the Analyst tool. When the Analyst tool runs, a blank project page opens as shown in the image below.
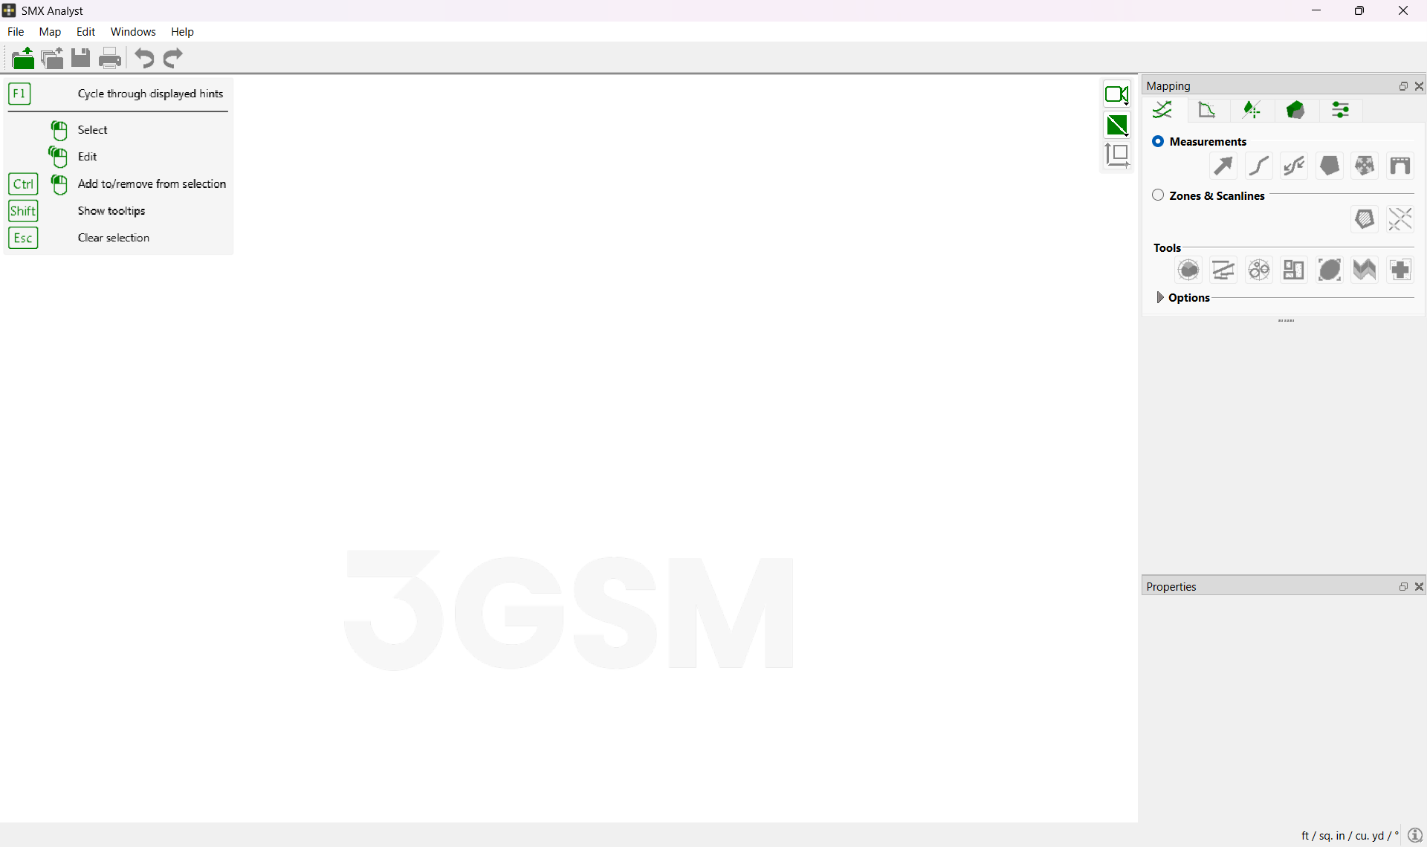
ShapeMetriX comes with several example images and files installed with the program. For this tutorial though, we will use the Bench in the Blocky Rock Mass.jm3x file found in your downloaded Tutorial 4 - Geometry, Occurrences and Area Partitioning.zip folder to demonstrate the geometry measurements, occurrences and area partitioning features of ShapeMetriX.
- Select Open 3D Model

- Open the Bench in Blocky Rock Mass.jm3x file.
3.0 Basic Settings & Tools
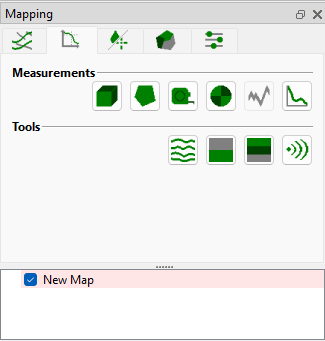
The 3D model is now imported into Analyst. Notice that mapping tools now became visible in the sidebar, and a New Map has been created under Geometry, Occurrences and Area Partitioning tabs by default. The Properties Pane is also enabled which displays the information of selected Annotation Elements.
The 3D model can be edited, panned, zoomed in and out, oriented, rotated, toggled between projections, etc. using the navigation bar (located in the top right of the 3D model view) or the mouse wheel.
- Scroll the mouse wheel to zoom in and out.
- Click and hold the mouse wheel to pan the model.
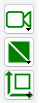
Hint: Analyst toggles between the Edit and Navigate mode by pressing the ESC key. The tool is active when it is blue.
4.0 Geometry Measurements
The Geometry tab includes volume, area, line, point measurements, section cuts as well as contour lines, cutoff plane, depth colouring tools.
4.1 Point Measurement
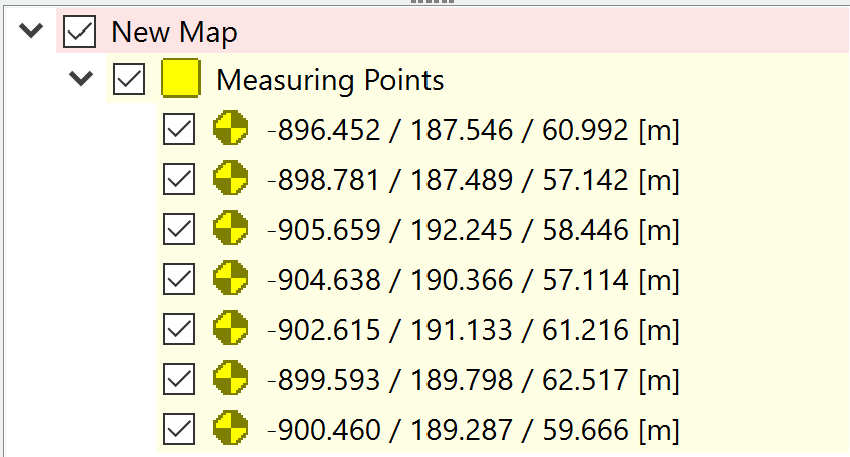
The Measuring Point tool provides the 3D coordinates of a specific point on the 3D model. These coordinates can be displayed in either local or global reference frames, depending on the model's reference system.
- Zoom into an arbitrary region in the 3D model that you would like to perform a point measurement.
- Select the Geometry tab.
- Under Measurements, select the Measuring Point
 tool.
tool. - Mark the point for the measurement with a left button mouse click (clicking on a different location resets the measurement).
- Complete the Point Measurement by pressing the ENTER key. Coordinates of the Measured Point will be provided instantly under the Measured Points list under the Geometry tab.
- Repeat steps 2 – 4 to add additional point measurements.
4.2 Tape Measurement
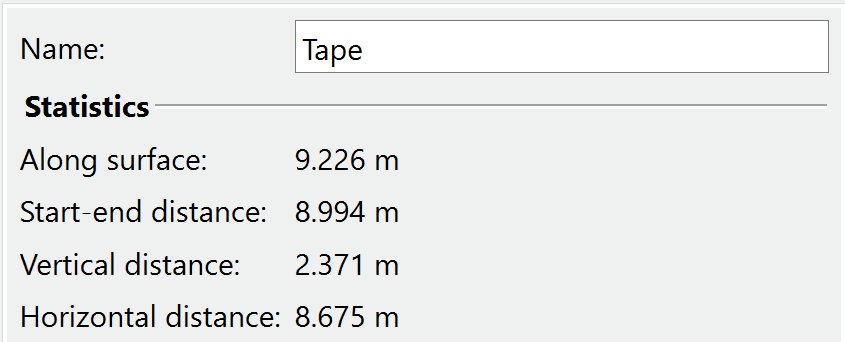
The Tape tool enables the measurement of any arbitrary stretch on a 3D model. It provides values for various lengths and distances, including the length along the surface, the distance between the start and end points, the vertical distance, and the horizontal distance.
- Zoom into an arbitrary region in the 3D model that you would like to perform a tape measurement.
- Under Geometry > Measurements, select the Tape
 tool.
tool. - Mark the starting point for the measurement with a left button mouse click.
- Mark the end point for the measurement with a left button mouse click. (The position of the point closest to the mouse cursor can be changed by clicking with the left mouse button, if required.)
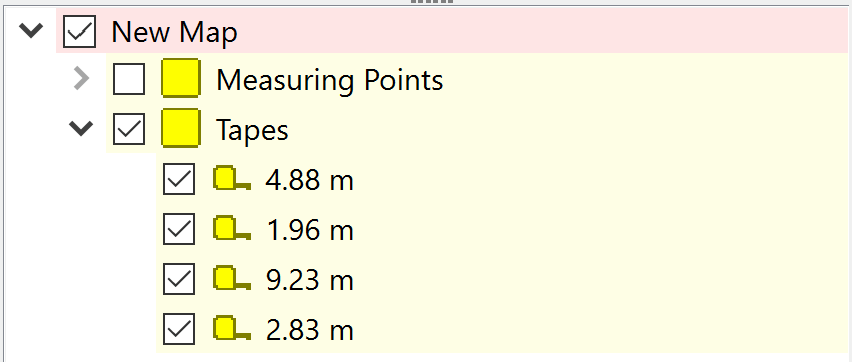
Complete the Tape measurement by pressing the ENTER key. Length along the surface will be provided instantly under the Tapes list in the Geometry tab.
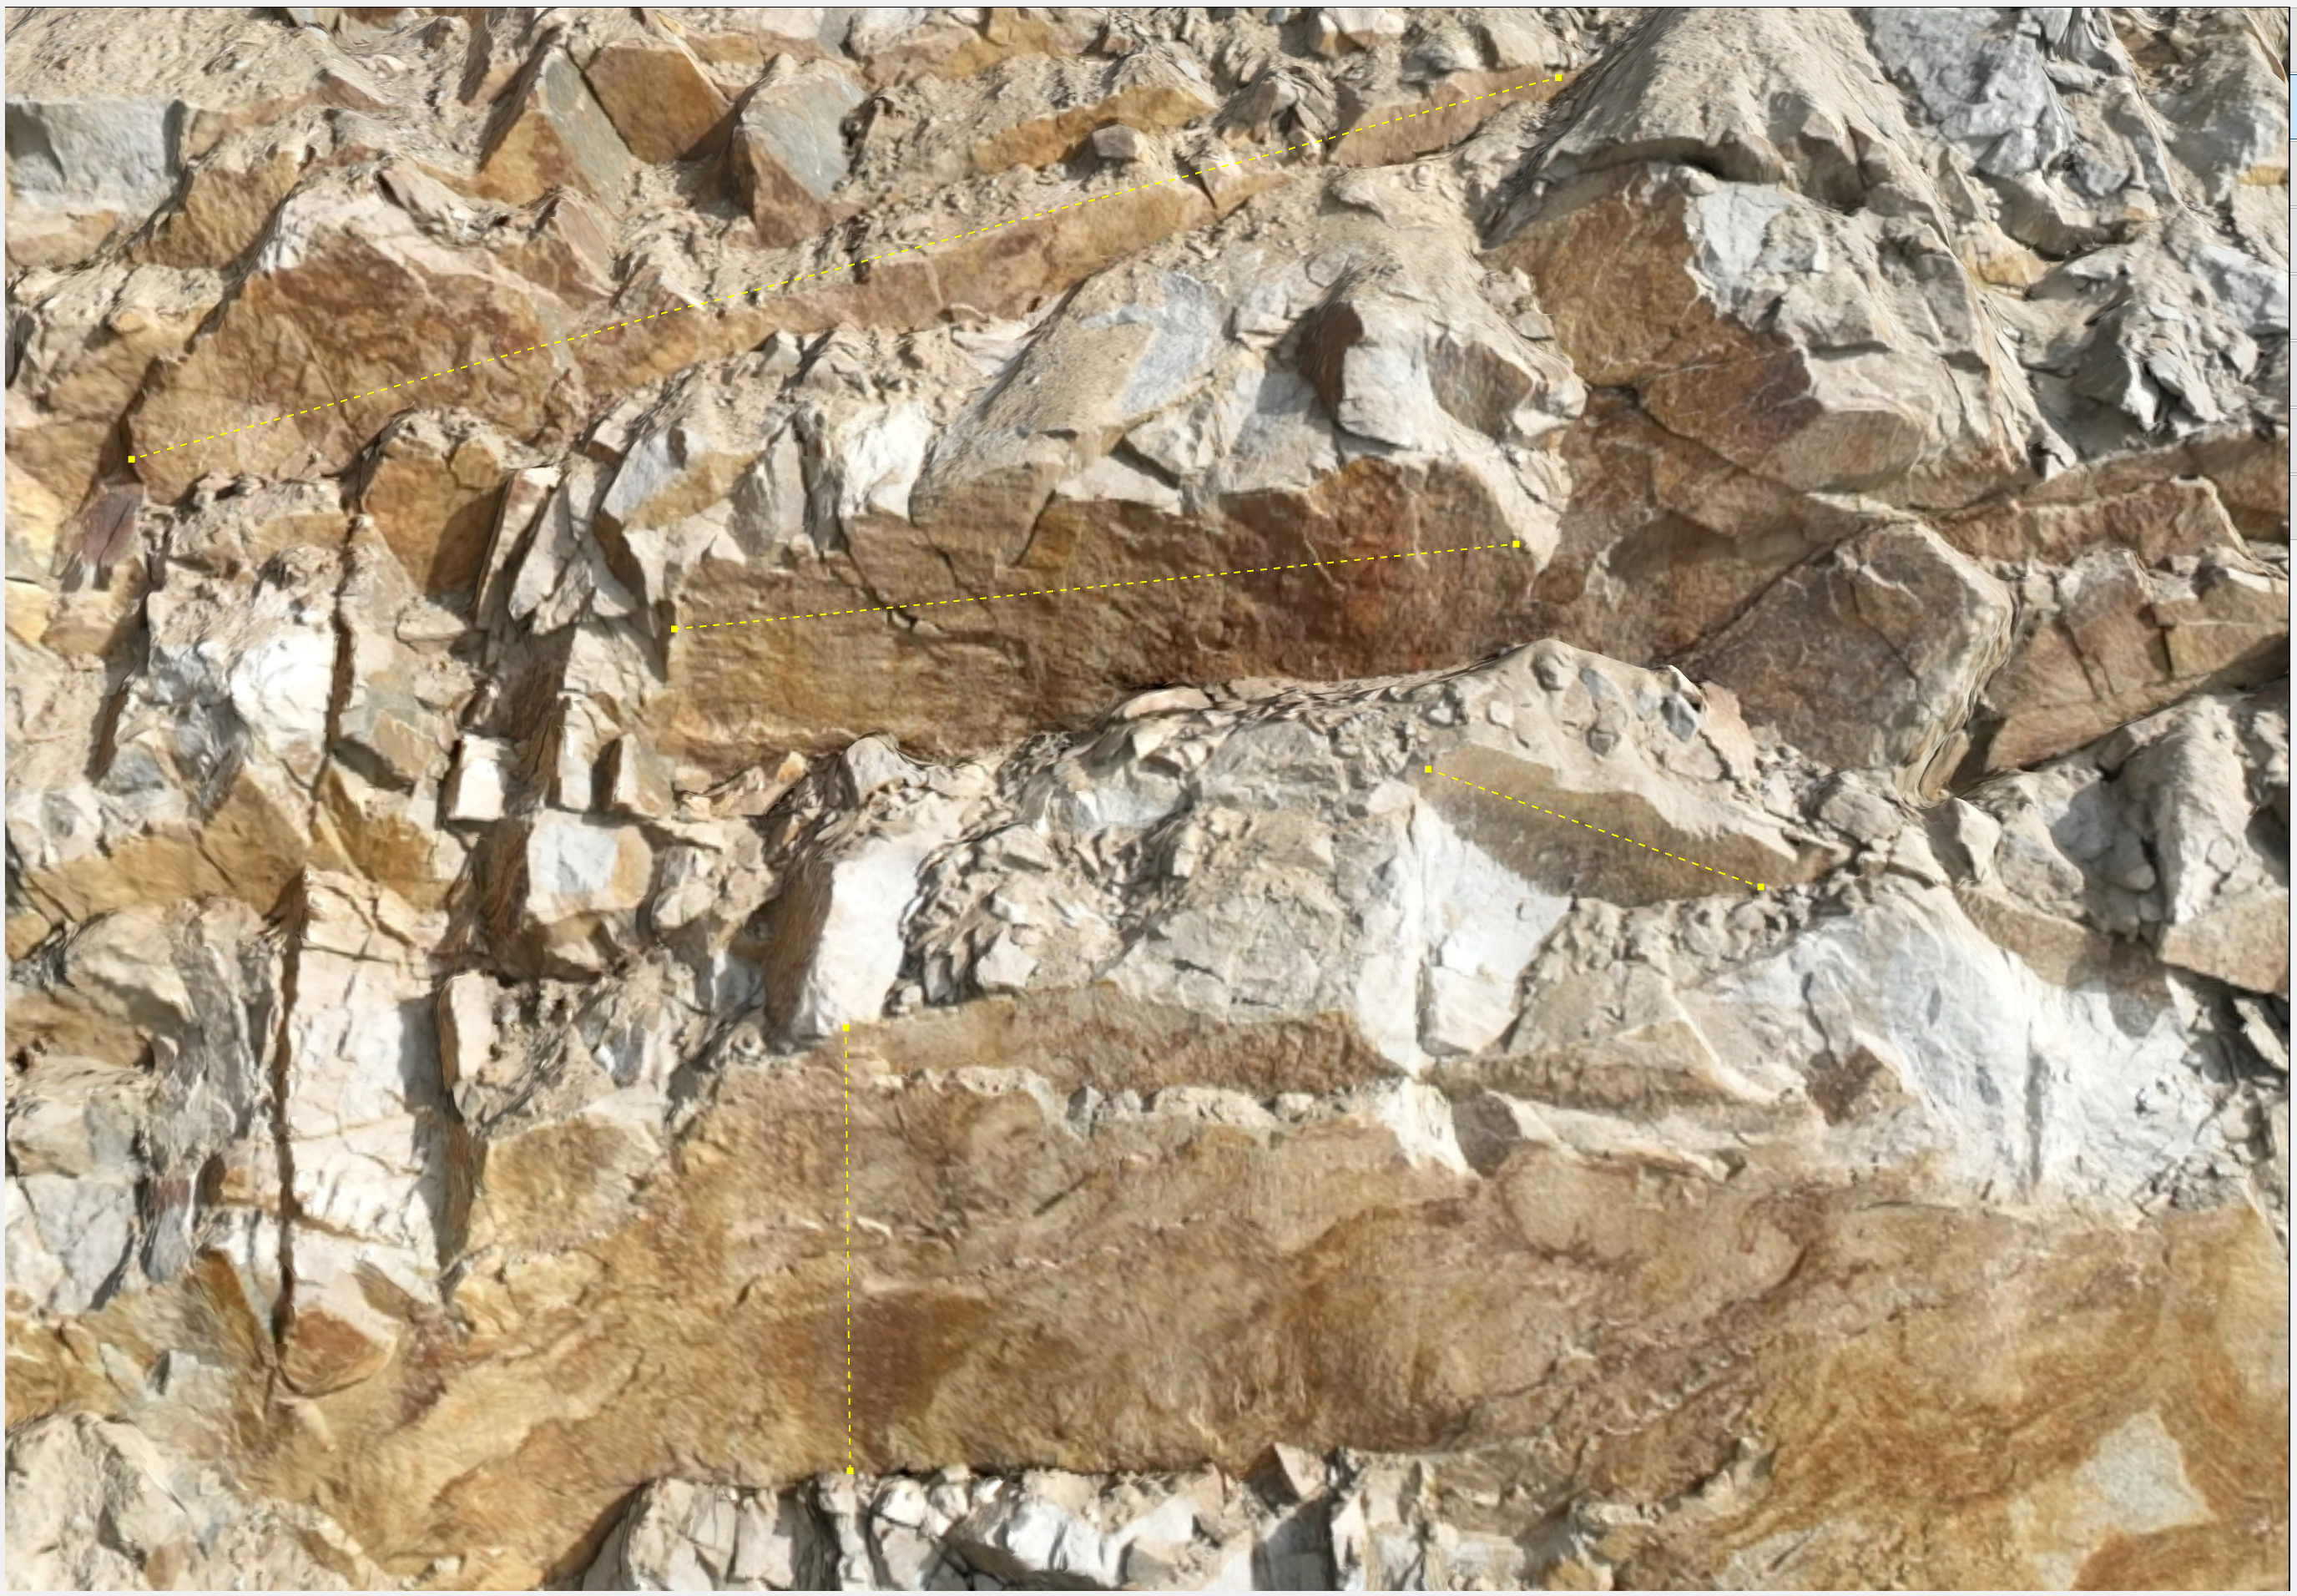
Repeat steps 2 – 5 to add additional tape measurements.
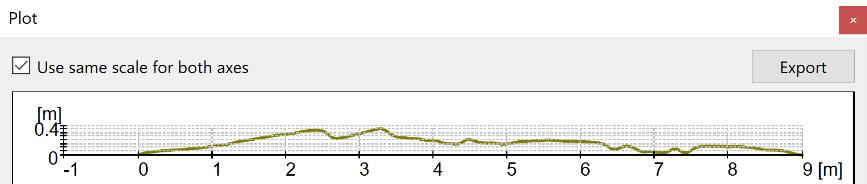
Click on Tape measurements to see the length along the surface, the distance between starting and end point, the vertical distance and the horizontal distance statistics for each measurement.
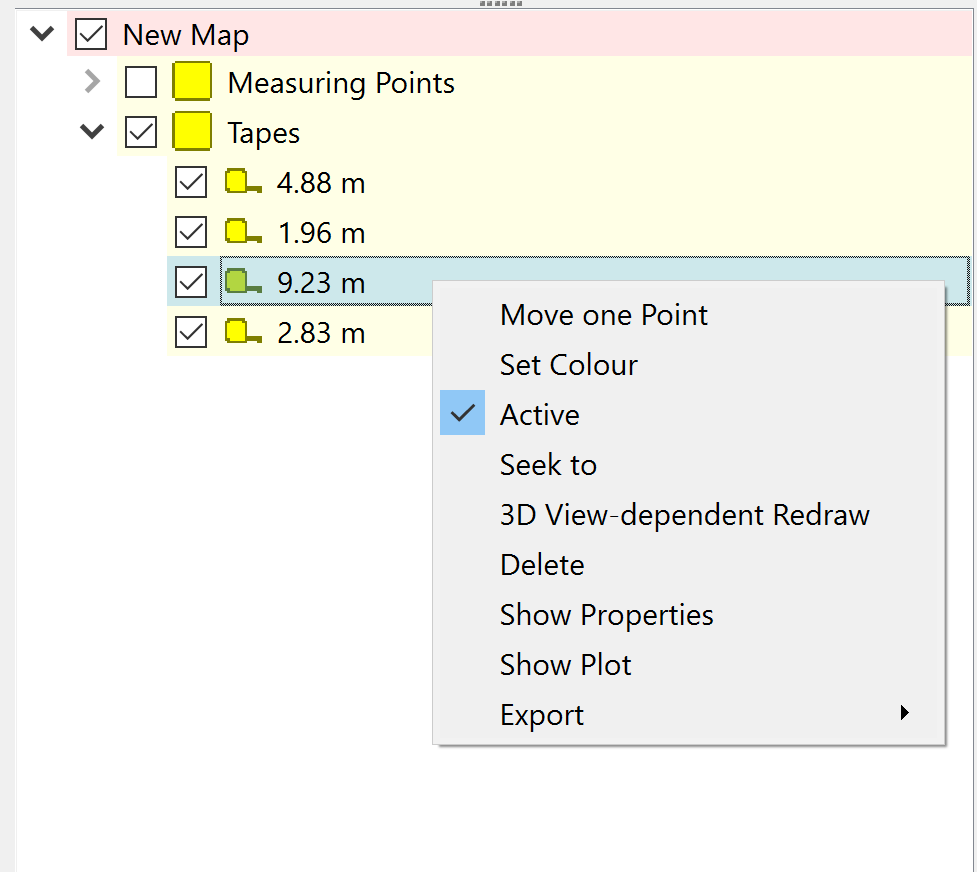
- Right-click on a Tape measurement and select Show Plot to plot the profile along the surface.
4.3 Area Basic Measurements
Area Basic measurement tool is used for annotating area-based structures (i.e. discontinuity surfaces) or for regions of common geological attributes. It is similar to the Area Measurement tool under the Structures tab; however, the Area Basic tool only provides information about the position and the size of the area. It does not provide information about the orientation of the area.
- Zoom into an arbitrary region in the 3D model that you would like to perform an Area Basic measurement.
- Select the Area Basic
 tool under Geometry > Measurements tab.
 Map the borderline of the Area to be measured on the 3D model by clicking the left mouse button. A polygonal line will grow instantaneously.
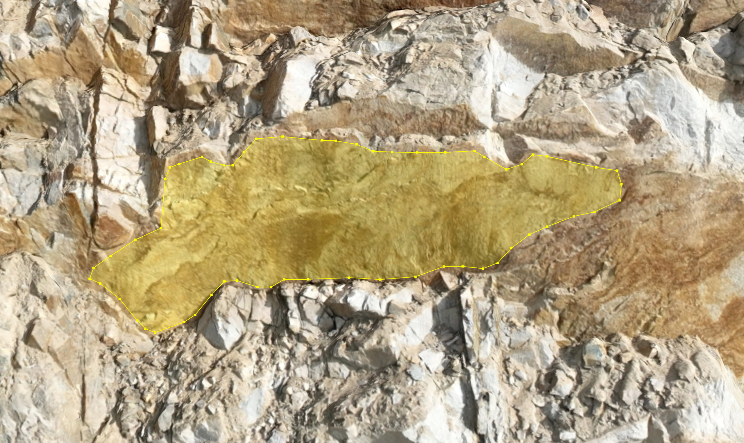
Complete the Area Basic measurement by pressing the ENTER key. The size and the position of the area will be provided instantly under the Areas Basic list in the Geometry tab.
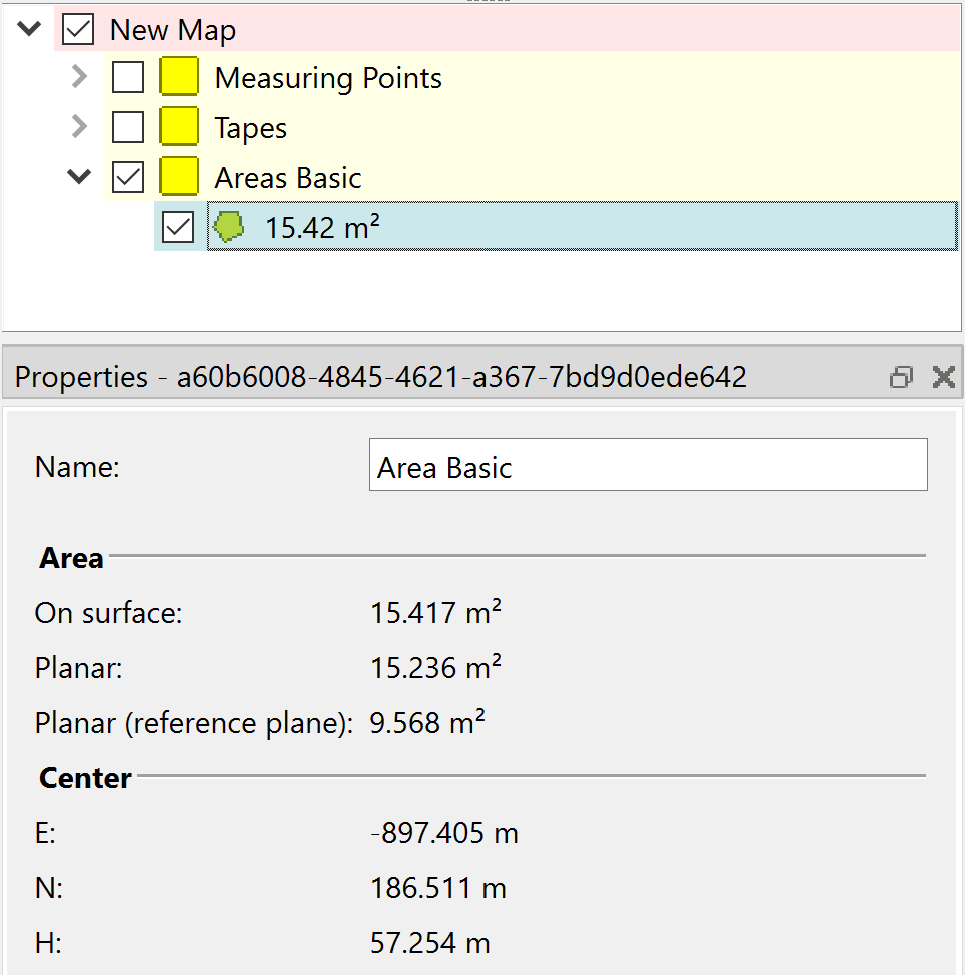
- Repeat steps 2 – 4 to add additional area measurements.
4.4 Volume Measurements
The Volume tool is utilized for estimating the volume of molds defined by a polygon on a 3D model.
- Zoom into an arbitrary region in the 3D model that you would like to perform a volume measurement.
- Under Geometry > Measurements, select the Volume
 tool.
tool. - Draw an area on the 3D model by subsequently clicking on the 3D model with the left mouse button. The drawn area will have the following properties:
- encloses the prospective volume body along the 3D model
- forms an artificial surface for closing the prospective volume body
Complete the Volume measurement by pressing the ENTER key. The calculated volume will be provided instantly under Volumes list in the Geometry tab.
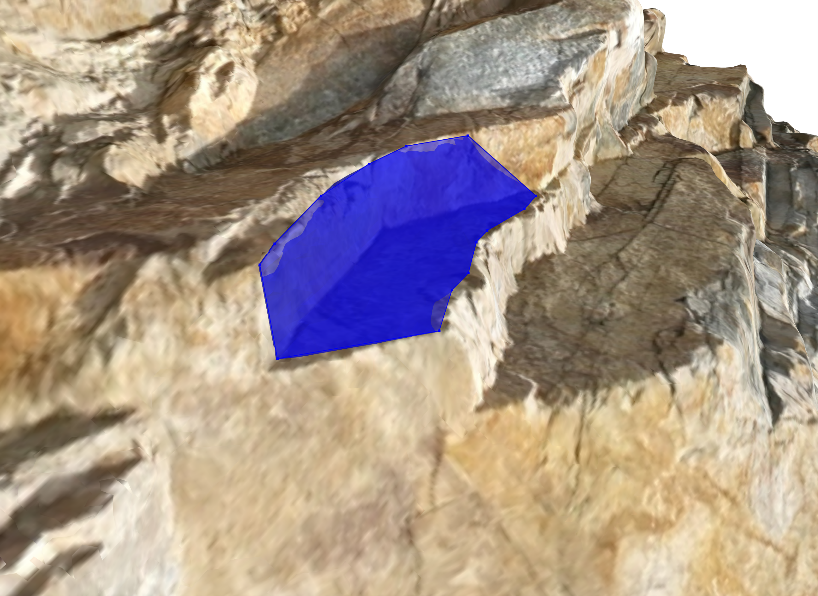
- Repeat steps 2 – 4 to add additional volume measurements.
Notice that when you click on the measured volume entity, there are three volume calculations provided under Properties tab.
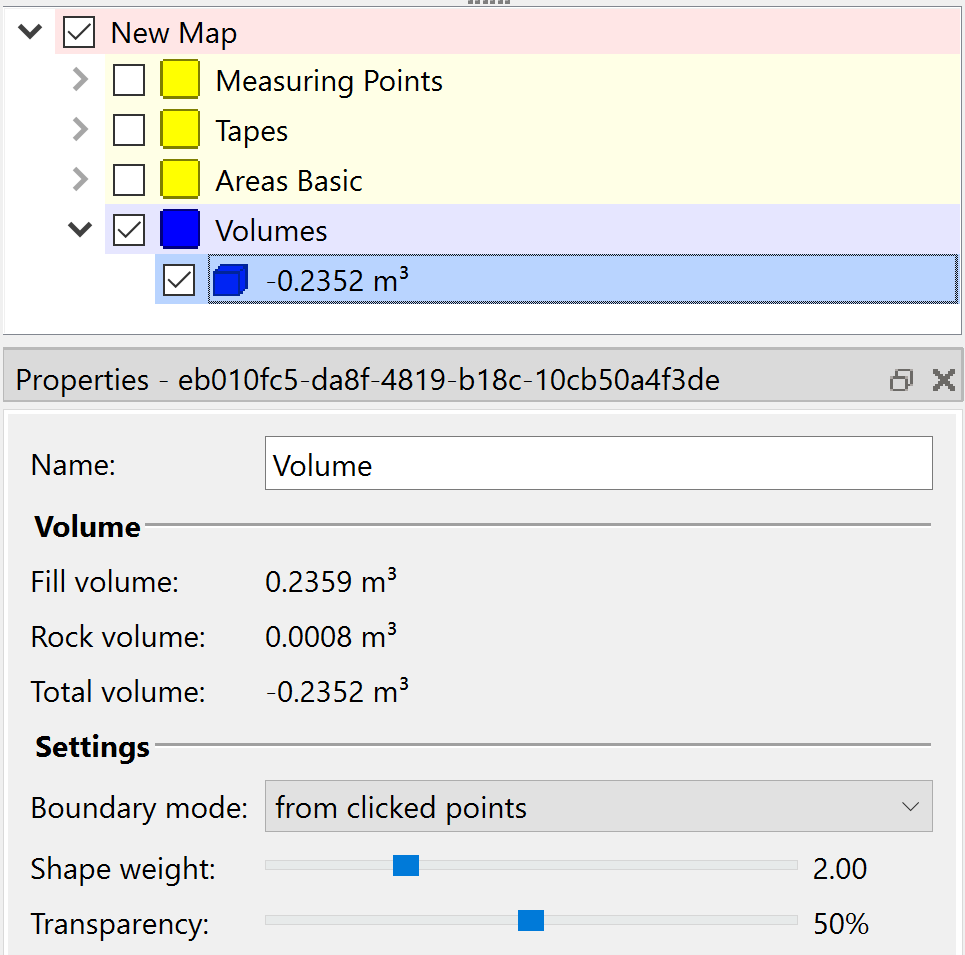
- Fill Volume – bounded by the area and the portion of the 3D model in front of it (“in front of the rock mass”)
- Rock Volume - bounded by the area and the section of the 3D model behind it (“in the rock mass”)
- Total Volume - calculated total volume (difference between the rock volume and fill volume calculations)
4.5 Generating a Section
A Section in the Analyst tool is a planar polygonal line formed by the intersection of a Cutting Plane and the 3D Model. The cutting plane is defined by its position (three coordinates) and orientation (inclination and strike).
- Under Geometry > Measurements, select the Section
 tool.
tool. - Define the Configuration of the Section under the Properties tab:
- Section Type = General
- Inclination = 90°
Strike Direction = 245°
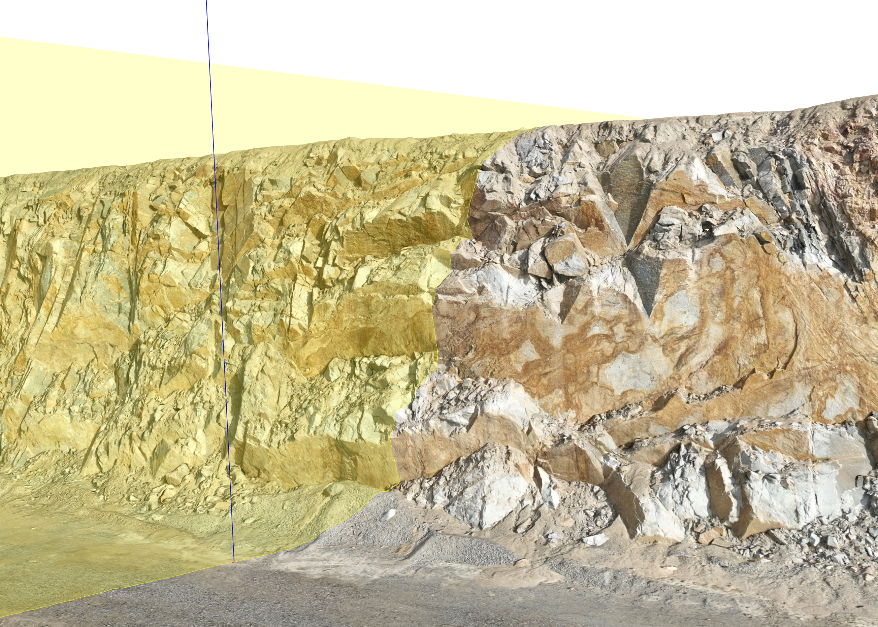
- Confirm the Section by pressing the ENTER key. The section will be provided instantly under Sections list in the Geometry tab.
Right-click on a Section and select Show Plot to plot to see the profile of the section.
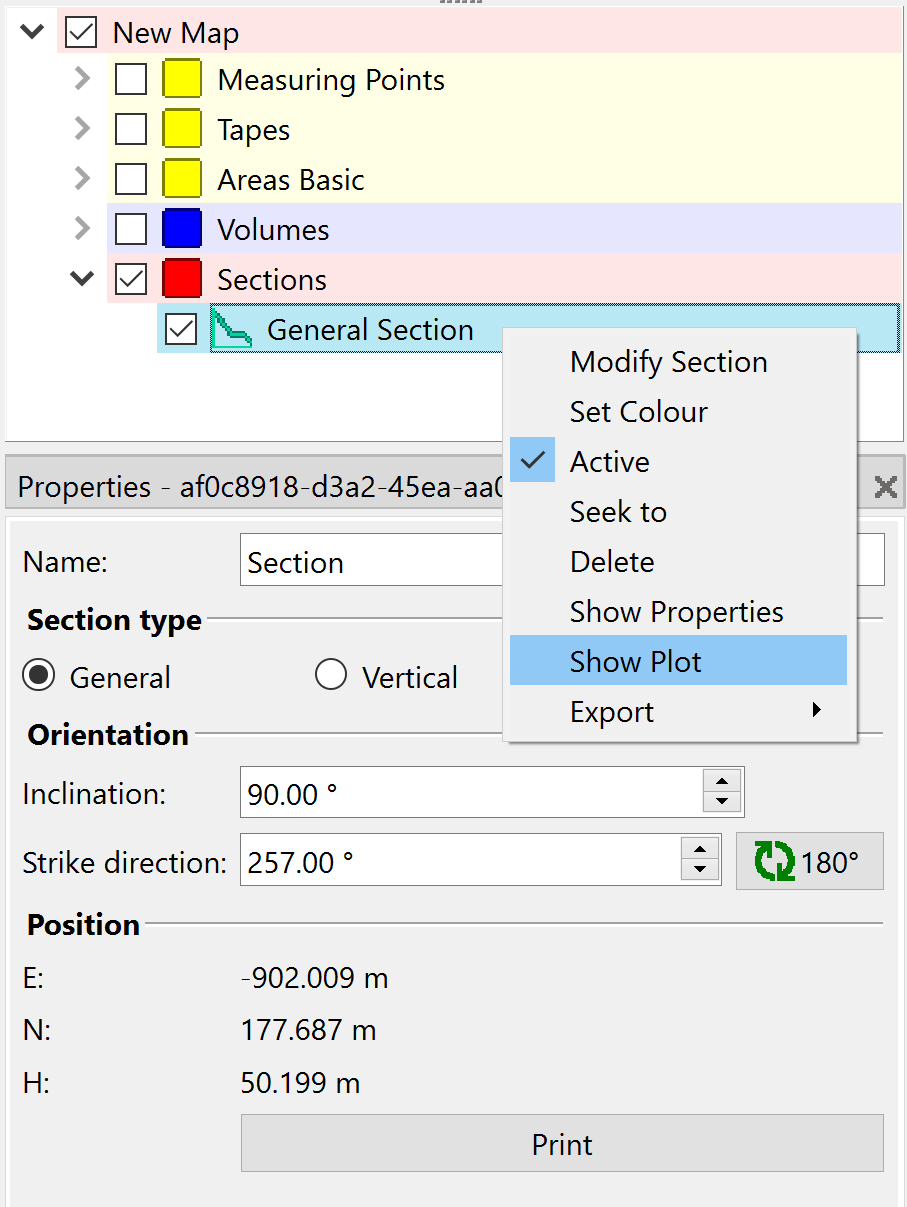
- Click Export to export the section in .csv or .dxf format for further geometry generation purposes in other Rocscience 2D programs.
4.6 Contour Lines
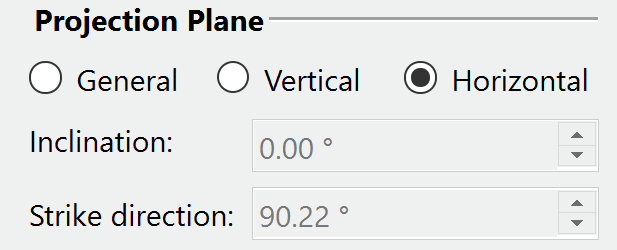
The Contour Lines tool in Analyst generates contour lines in respect to a user-definable projection plane (vertical, horizontal or general projection plane).
- Under Geometry > Tools, select Contour Lines

Select Horizontal projection plane.
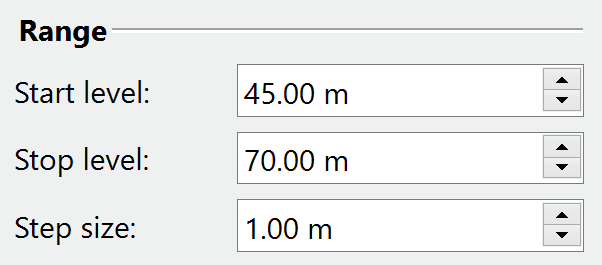
- Define contour range:
- Start Level = 45.00m
- Stop Level = 70.00m
Step Size = 1.00m
The Contour map will be updated automatically.
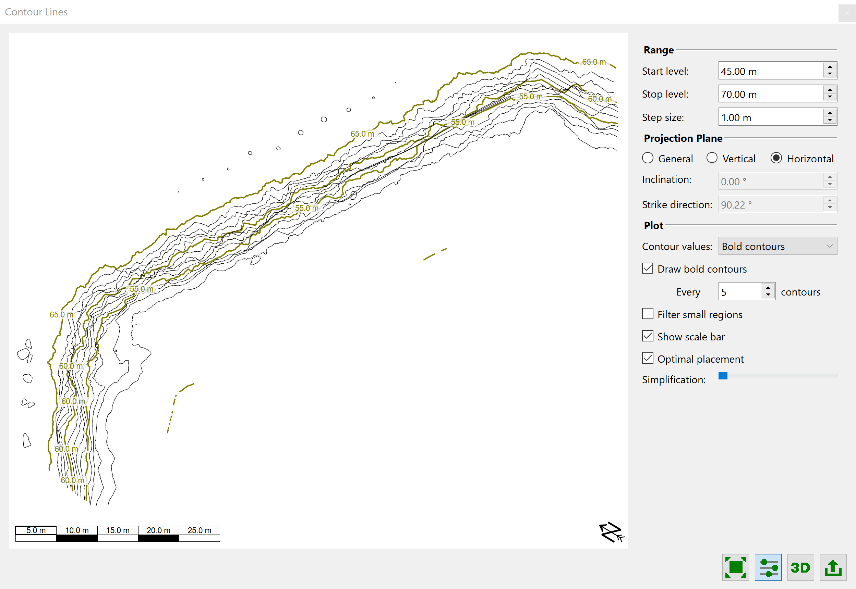
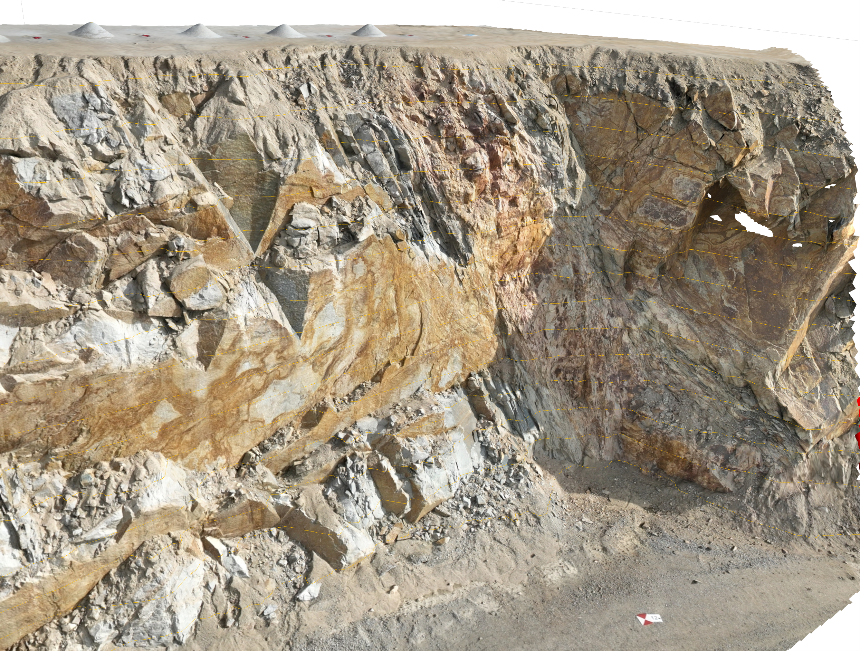
- Click 3D (Show on 3D Model) to overlay contour lines onto the 3D model.
5.0 Occurrences
An Occurrence in Analyst is a tool for mapping water or an event occurrence (single/punctual or non-punctual) on the 3D Model.
To map a water occurrence:
- Zoom into an arbitrary region in the 3D model that you would like to map a water occurrence.
- Under the Occurrences tab, select the Water
 tool.
tool. - Mark the Water occurrence with a left button mouse click on a desired location (clicking on a different location resets the position)
Complete adding the Water occurrence by pressing the ENTER key. Water annotation will occur as a blue sphere and the position of the occurrence will be provided instantly under the Water list in the Occurrences tab.
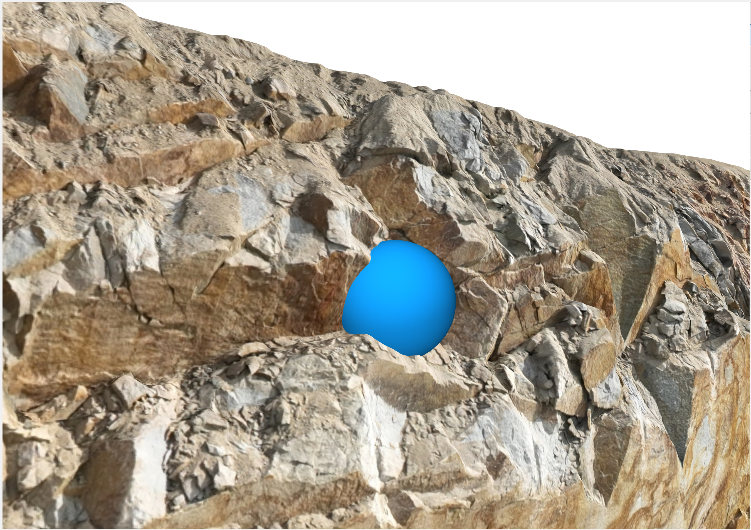
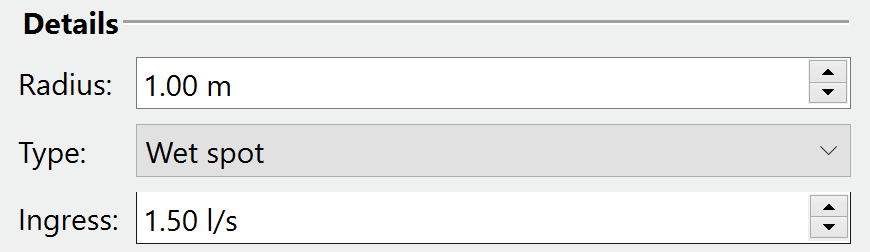
- Click on the added water occurrence entity and edit the details in the Properties tab.
- Radius = 1.00m
- Type = Wet Spot
Ingress = 1.50 l/s
- Repeat steps 2 – 4 to add additional water occurrences.
6.0 Area Partitioning
Area Partitioning is a tool for partitioning and quantification of user defined areas (Lithologic Regions and Homogenous Areas) on a 3D model. The Lithologic Region option allows to define different rock types (lithologies) while the Homogenous Area option allows to define segments with similar properties.
- Zoom into an arbitrary region in the 3D model that you would like to add Homogenous Region.
- Under the Area Partitioning tab, select the Homogenous Region
 tool.
tool. Create a rectangular outside border for the Homogenous Region (entire region) on the 3D model by subsequently clicking the left mouse button. A polygonal line will grow instantaneously.
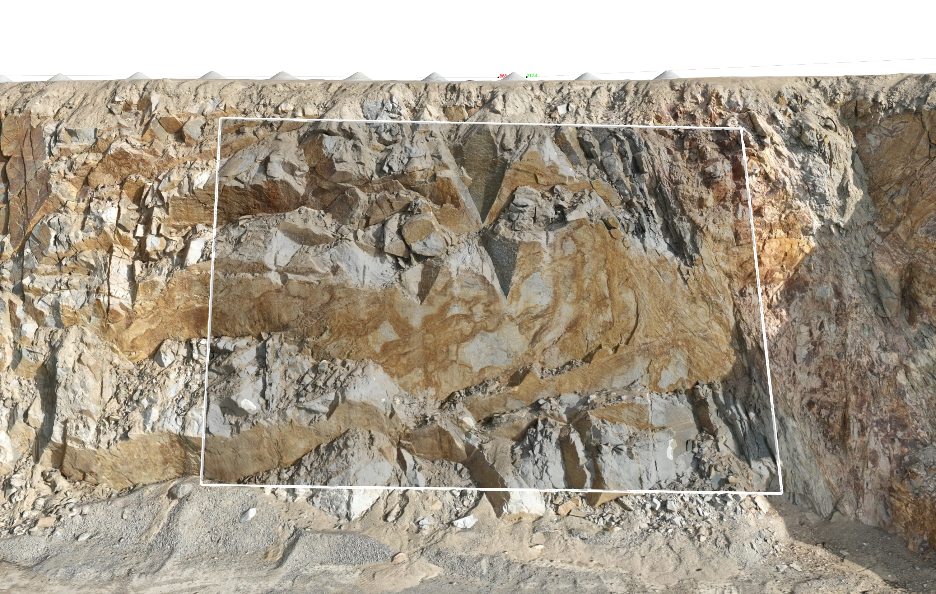
- Confirm the polygon for outside border of the Homogenous Region by pressing the ENTER key. The area will close automatically.
- Right-click on the Homogenous Region entity and select Insert Segment to add segments inside the Homogenous Region.
- Split the area into segments by drawing:
- A polygon, which intersect the border of the Homogenous Region
- A closed polygon inside the border of the Homogenous Region
- The segment will be automatically added under the Homogenous Region under the Properties tab.
- Continue splitting the Homogenous Region until all segments have been defined.
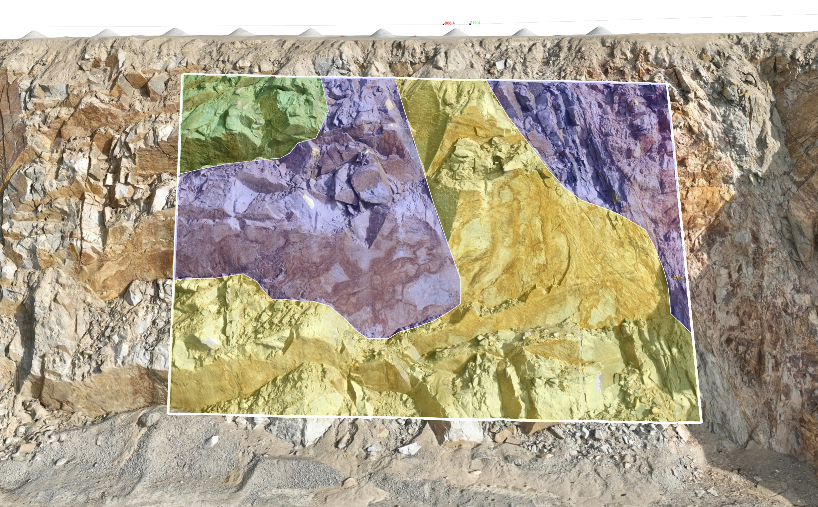
Under the Properties tab, assign the desired color and rock type to the segment with biggest area size.
Continue assigning lithology types to all the individual segments.
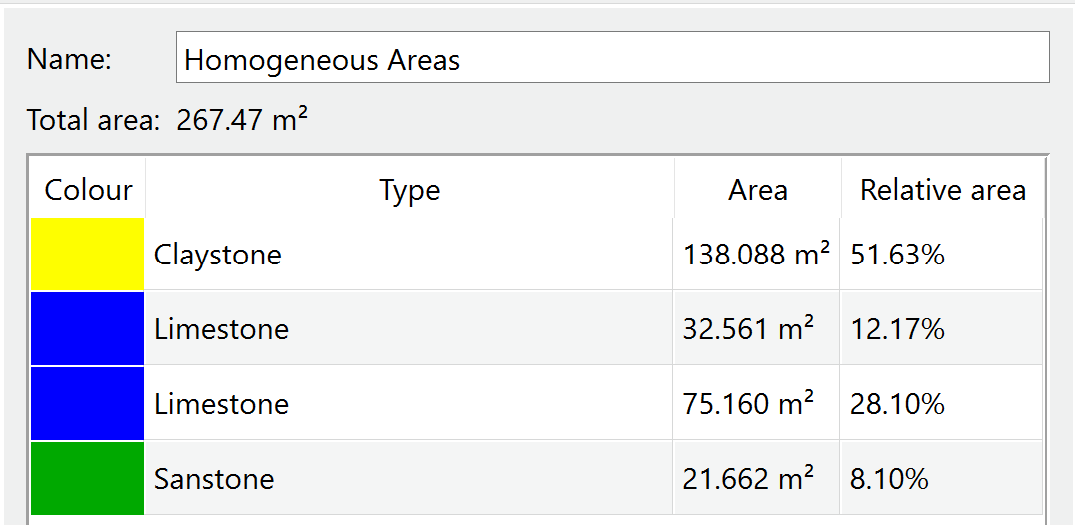
- Right-click on the Homogenous Region entity and select Show Plot to plot a pie chart of the area distribution of segments in the Homogenous Region.
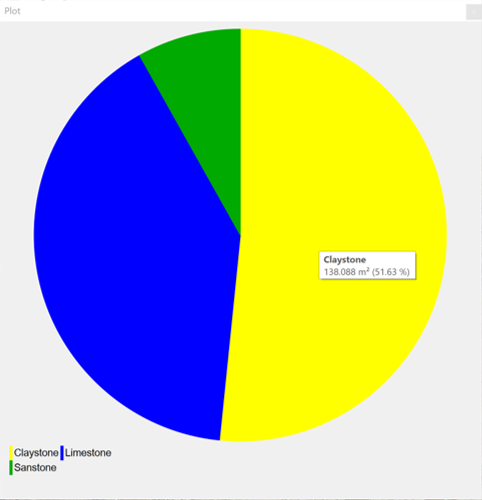
That concludes the tutorial for Geometry, Occurrences and Area Partitioning.