Missing CPT Data Points? Not a Problem For Settle3
- Steve Chai, Geotechnical AI Manager at Rocscience
Cone Penetration Testing (CPT) is one of the widely used tools in geotechnical engineering. With the increasing reliance on CPT to determine soil behavior, accurate and location-specific CPT data analysis is gaining high interest. Many projects grapple with the challenge of dealing with missing or unrecorded CPT points. This is precisely where the new feature steps in, offering the most comprehensive solution to date. By generating missing CPT points with unmatched precision and efficiency, we are empowering engineers to work with complete and reliable datasets. Not only that, now users can utilize this feature to predict settlement for the defined region where the loads will be applied in different locations and estimate empirical settlement for given CPTs.
The algorithm uses the sparse Bayesian Learning algorithm (Ching et al., 2021) to analyze site-specific CPT data for predicting site characterization. They have improved the method to address non-lattice data in three-dimensional probabilistic site characterization by determining the missing data points of CPT data based on the surrounding CPT data.
It has always been a challenging issue to estimate the missing CPT data points along the depth of soil to determine the CPT points or missing CPT points at specific locations. In the process of doing so, engineers were often faced with challenges such as:
- How to determine the missing CPT values along the depth of soil or at different locations.
- If the engineer wanted to check the settlement between the known CPT points, the unknown parameters were challenging to figure out.
With these two challenges when dealing with CPT analysis, we’ve responded in the most optimal way. The new feature will include implementing the algorithm presented by Ching et al. (2021). This feature has two components:
- The algorithm will be used to find missing CPT data points, and then
- Using the correlations and soil characteristics, empirical settlement will be calculated based on the soil layers that can be defined with soil properties obtained from these CPT points.
Note that the algorithm uses correlation length from the known CPT datapoints so the generated datapoints will be able to detect the range of interpolation. This is still an approximation, and we would always encourage users to check the results. Users will be able to see the range of simulated results for verification.

We’ve compared the simulated CPT point with the known CPT values and they were relatively close to each other.
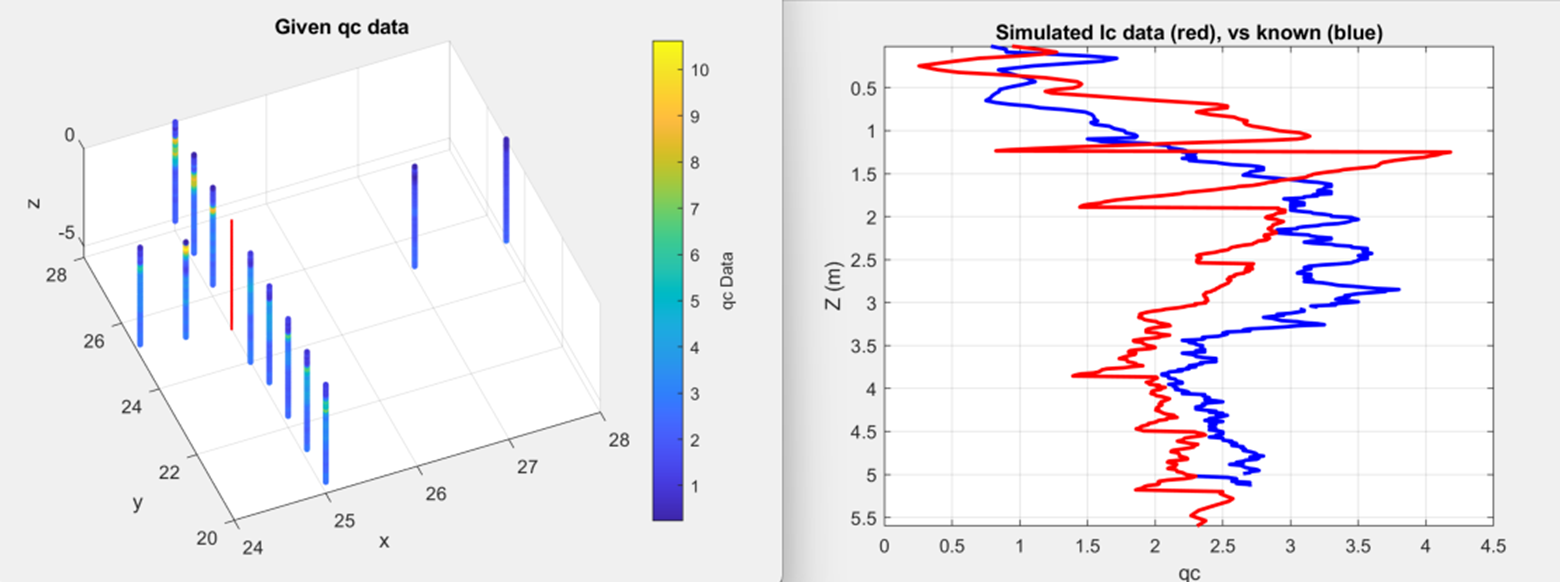
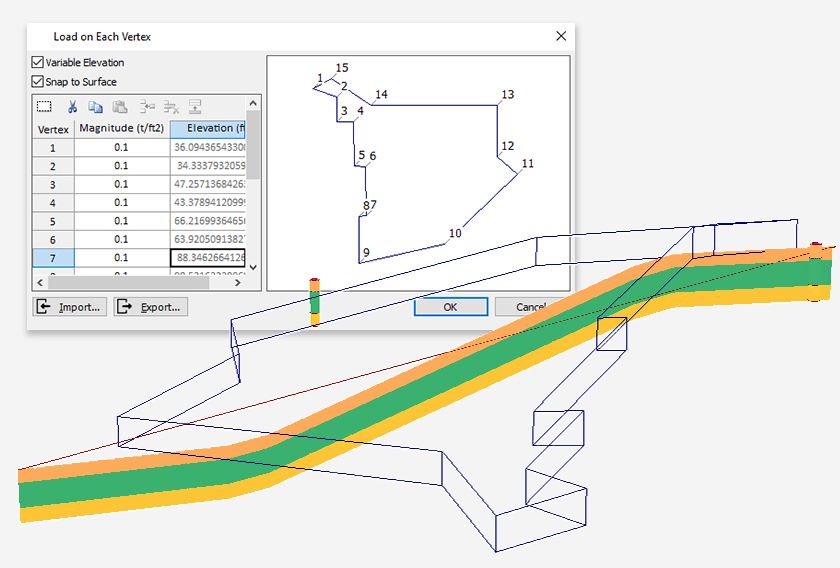
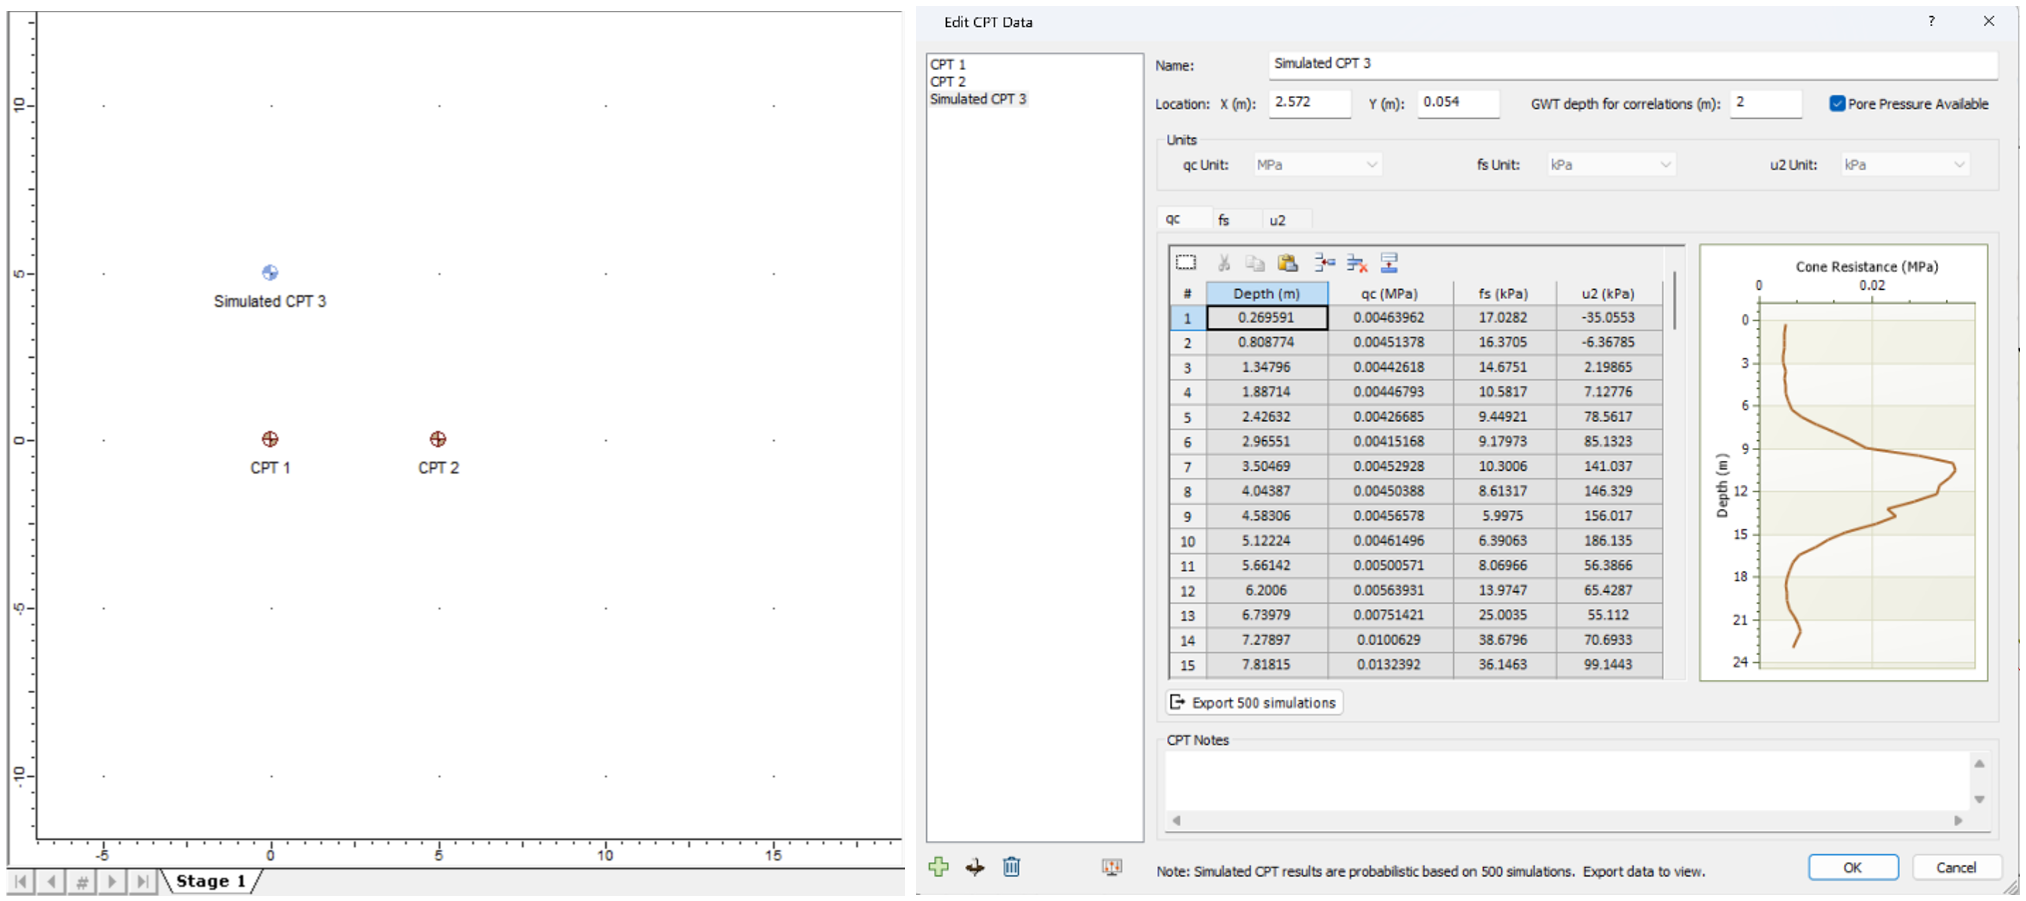
Now the user will be able to assign any location they want to simulate their CPT points. Users can also determine correlation length for the interpolation which changes the computation time for the accuracy. A typical simulated CPT points for given correlation length will take approximately less than 30 seconds to simulate. For more accurate data generation, it may take up to 2 minutes. Thus, users have to flexibility
to lessen the computation time along the depth of soil. Below shows the CPT dialog with the simulated points.
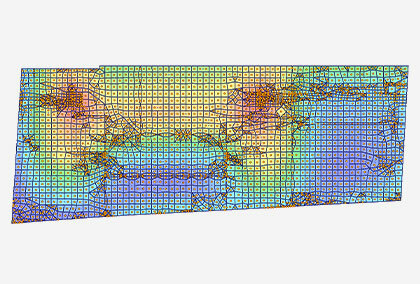
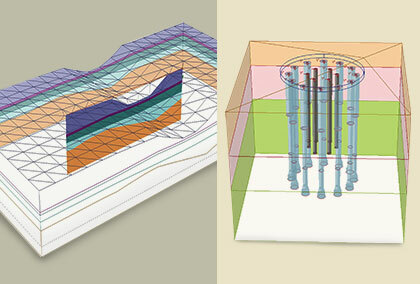
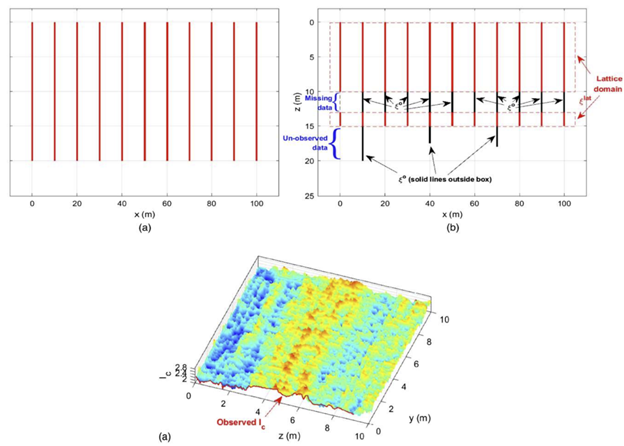
Then, the statistical algorithm presented by Ching et al. (2021) can be used to create different realizations of 3D conditional random fields. Below is an example of diagram showing the algorithm.
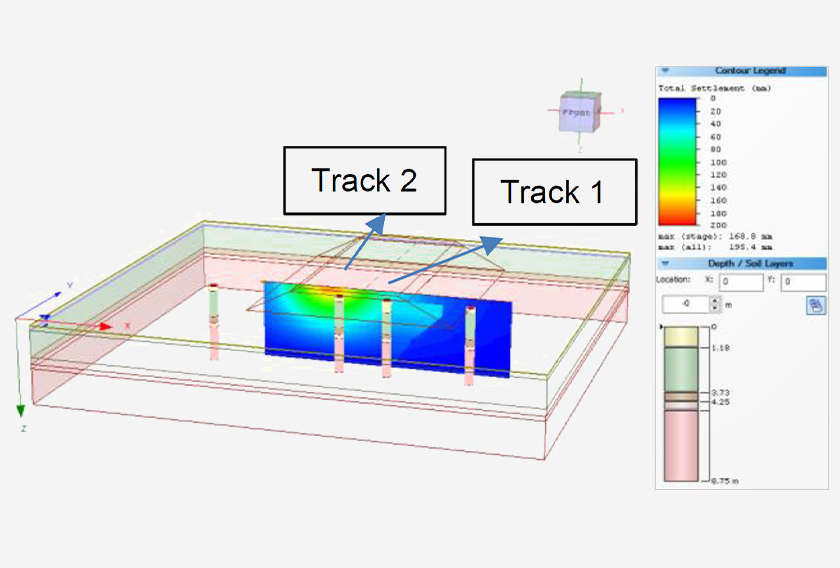
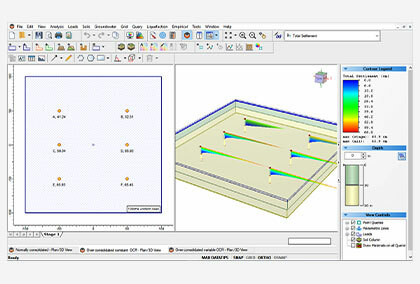
Using empirical settlement in the Settle3, the worst, median, and best-case scenarios (with regards to settlement) can be specified for 500 simulated soil profile region, and for those fields, immediate settlement can be computed using Schmertmann empirical settlement. Figure below shows a user-defined region where the load will be applied in different grid points for 500 different soil profile generation and the average values of empirical settlement have been shown.
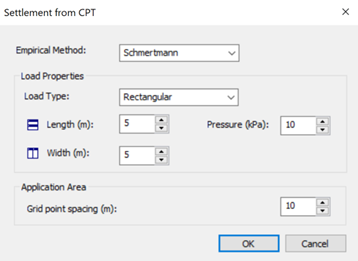
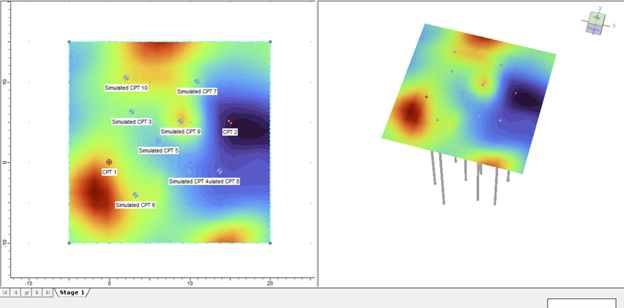
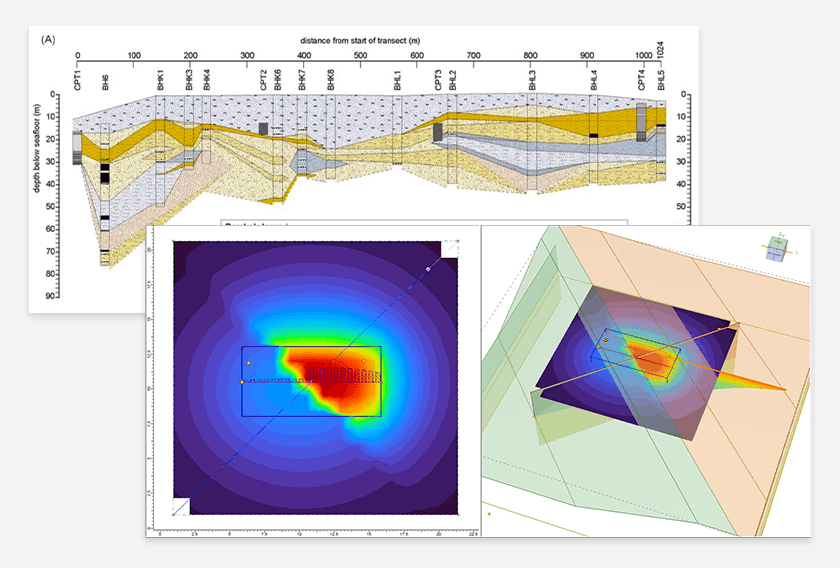
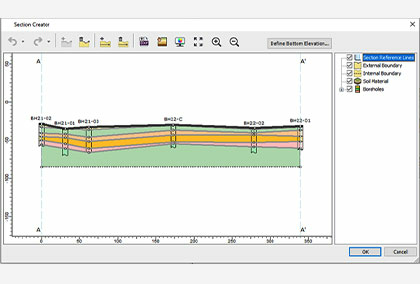
Figure 6 shows a typical deterministic example of CPT boreholes used which is then used to carry out the settlement analysis in a 3D domain using this new feature.
There are many more applications that you can use this feature for. Whether it’d be to check the CPT simulated points or settlement with their given CPT, now you can handle both of them in one feature with Settle3.
Reference:
Ching, Jianye & Zhiyong, Yang & Phoon, Kok-Kwang. (2021). Dealing with Nonlattice Data in Three-Dimensional Probabilistic Site Characterization. Journal of Engineering Mechanics. 147. 06021003. 10.1061/(ASCE)EM.1943-7889.0001907.
More from Rocscience