Three-Dimensional Numerical Analysis of a Large-Diameter Surge Shaft Using RS3
Introduction
Large underground excavations rarely behave as isolated, uniform openings. As excavation progresses, the surrounding rock mass redistributes stress, support is activated, and adjacent openings can alter the way loads are transferred through both the rock and the support system. For large-diameter shafts connected to tunnels and passageways, these interactions can become particularly important because the geometry itself can introduce localized effects that are difficult to represent with simplified two-dimensional or axisymmetric assumptions.
Surge shafts are a good example. As part of hydropower water-conveyance systems, they provide storage for transient water-level fluctuations and help reduce the hydraulic effects associated with rapid changes in powerhouse operation. A typical arrangement conveys water through a headrace tunnel toward the downstream powerhouse, with the surge shaft connected to the water-conveyance system through a passageway. From a structural and geotechnical perspective, however, the shaft, passageway, and tunnel form a coupled three-dimensional excavation system whose response evolves as each component is excavated and supported.
This article presents a three-dimensional finite-element analysis of a representative large-diameter surge shaft using RS3. The geometry and rock-mass properties are based on the case described by Kökten (2023), comprising a 27 m diameter shaft extending approximately 70 m in depth, a connecting passageway, and an inclined headrace tunnel. The analysis follows the construction sequence through staged excavation and sequential support installation, examining deformation, rock-mass yielding, bolt forces, and liner demands.
A key focus is the effect of introducing the passageway opening into the previously excavated and supported shaft. Before the connection is created, the shaft can be represented as an axisymmetric problem and compared directly with an equivalent RS2 model. Once the opening is introduced, that symmetry is lost and the resulting load redistribution becomes inherently three-dimensional. The comparison provides a useful illustration of where axisymmetric analysis remains appropriate, and where three-dimensional modelling can reveal effects that simplified representations cannot capture directly.
Geometry, Materials, and Support
The model represents a vertical circular surge shaft with a diameter of 27 m and an excavated height of approximately 70 m. The shaft is connected to a headrace tunnel by a short passageway. The headrace tunnel is inclined to reflect the water-conveyance alignment toward the downstream facilities. The geometry is shown in Figure 1.
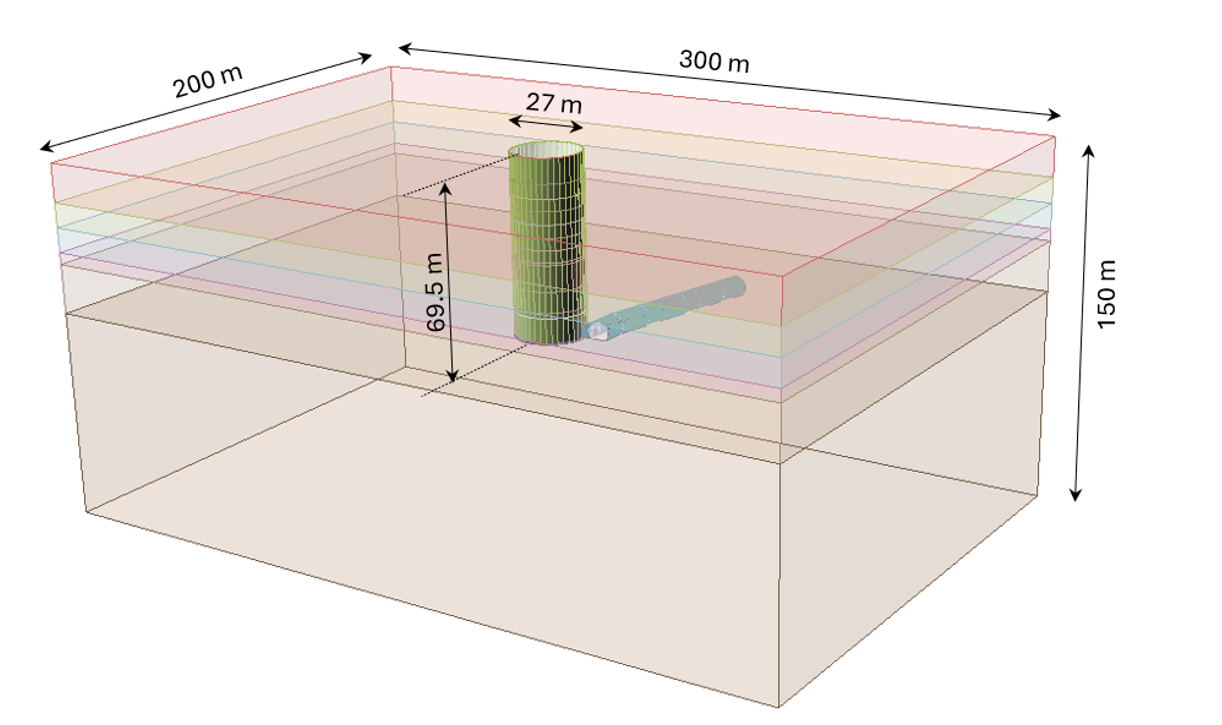
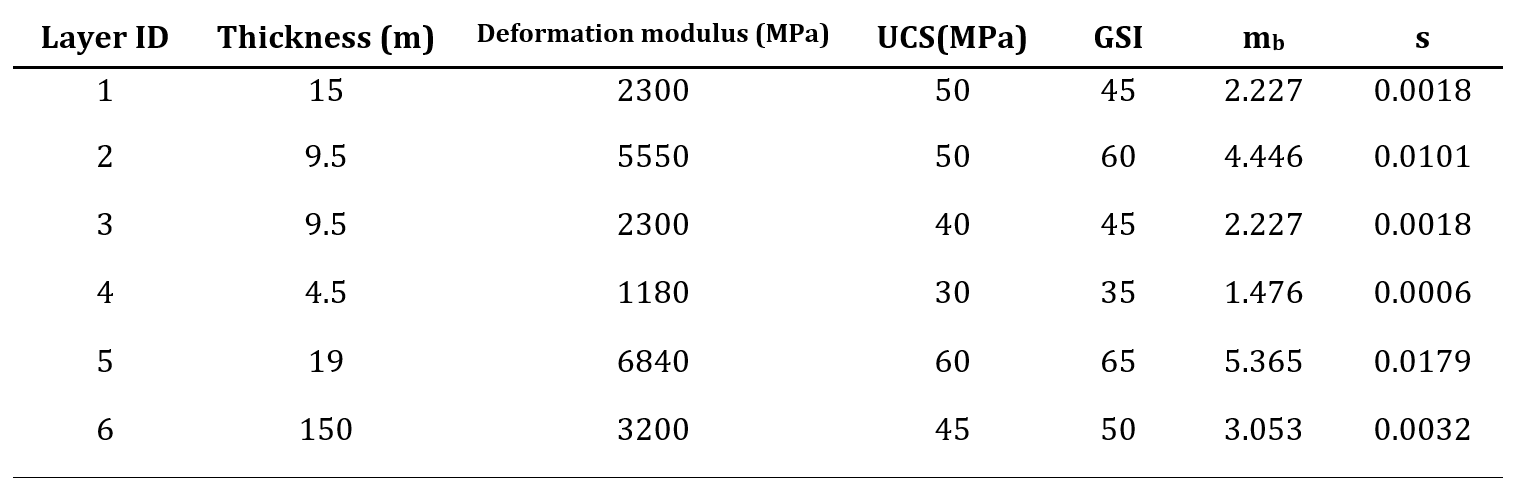
As shown above, the model consists of six rock layers. The Hoek-Brown constitutive model is adopted to describe the rock behaviour in each layer. The unit weight of the rock mass was assumed to be 25 kN/m³. The remaining rock-mass properties, together with the thickness of each layer, are summarized in Table 1.
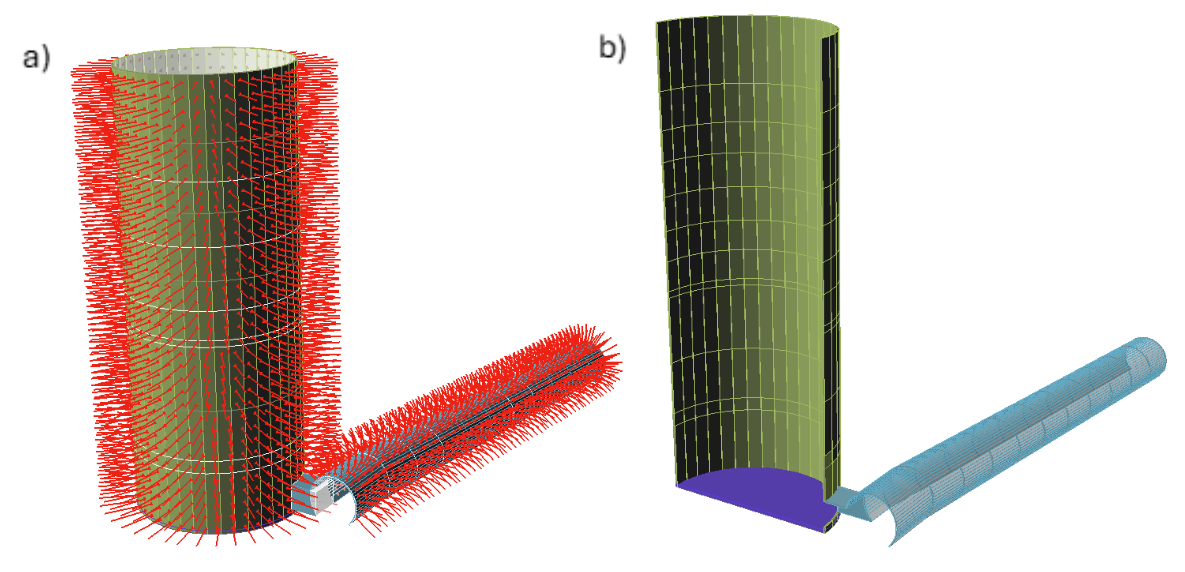
The primary support consisted of a 275 mm shotcrete liner and fully bonded rock bolts. The liner represents the three shotcrete layers described in the reference support concept: 100 mm + 100 mm + 75 mm. At the end of shaft excavation, a slab with a thickness of 0.4 m was placed at the bottom of the shaft. Along the shaft, 6 m long bolts with a nominal diameter of 26 mm were used, while in the headrace tunnel, the bolt length was reduced to 4 m to reflect the smaller tunnel opening and the different support requirements. The final support system is shown in Figure 2.
An interface was included between the rock and the liners. This allows relative movement and shear transfer at the rock–shotcrete contact instead of forcing the liner and rock to behave as a perfectly bonded continuum. The interface strength was defined using a material-dependent strength reduction coefficient of 0.7.
Construction Sequence in RS3
The construction sequence was defined to represent the staged excavation and support installation used for a shaft constructed in rock. The sequence is important because the calculated forces depend on stress release, support installation timing, and the stiffness activated at each stage.
First, the shaft was excavated downward sequentially. After each excavation stage, the shotcrete liner and rock bolts were installed around the newly exposed shaft perimeter. This process was repeated until the excavation reached an elevation of 69.5 m. The staged approach allows the model to capture progressive stress redistribution rather than applying the entire excavation in a single step.
After completion of the shaft excavation and primary support, a slab was placed at the base of the modelled connection zone. An opening was then created in the shaft wall to permit excavation of the passageway. This step is important because the passageway removes part of the previously supported shaft boundary and creates a local stress concentration.
The passageway and inclined headrace tunnel were subsequently excavated in stages. Following each tunnel excavation stage, the shotcrete liner and 4 m fully bonded bolts were activated. The sequence therefore represents the shaft being excavated and supported before the passageway and headrace tunnel are advanced. Figure 3 shows the excavation of the shaft in two stages.
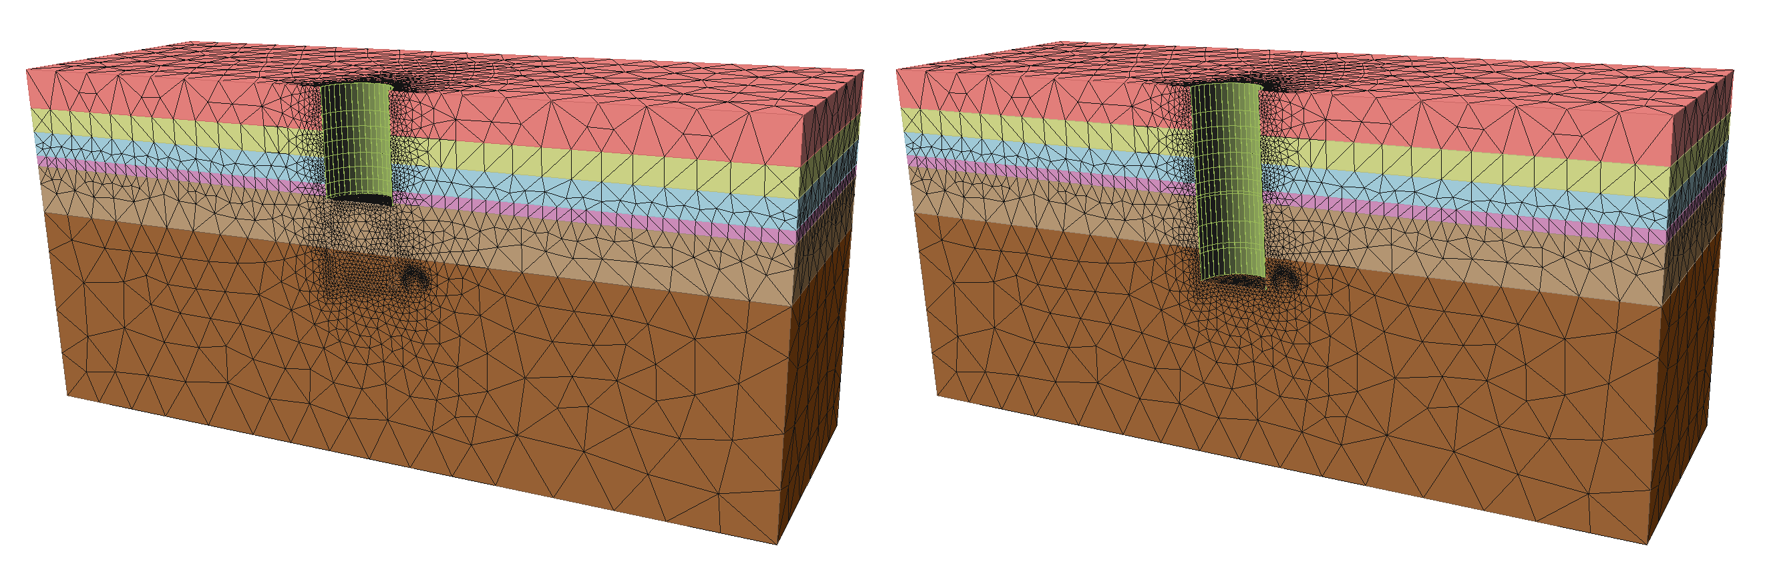
The liner–rock interface was retained in both the shaft and tunnel analyses. In addition to the principal RS3 analysis, a comparison was performed without the interface to evaluate how the assumed contact condition affects liner forces. A separate axisymmetric RS2 model was also used to compare the shaft response before the passageway opening was created.
Results and Discussion
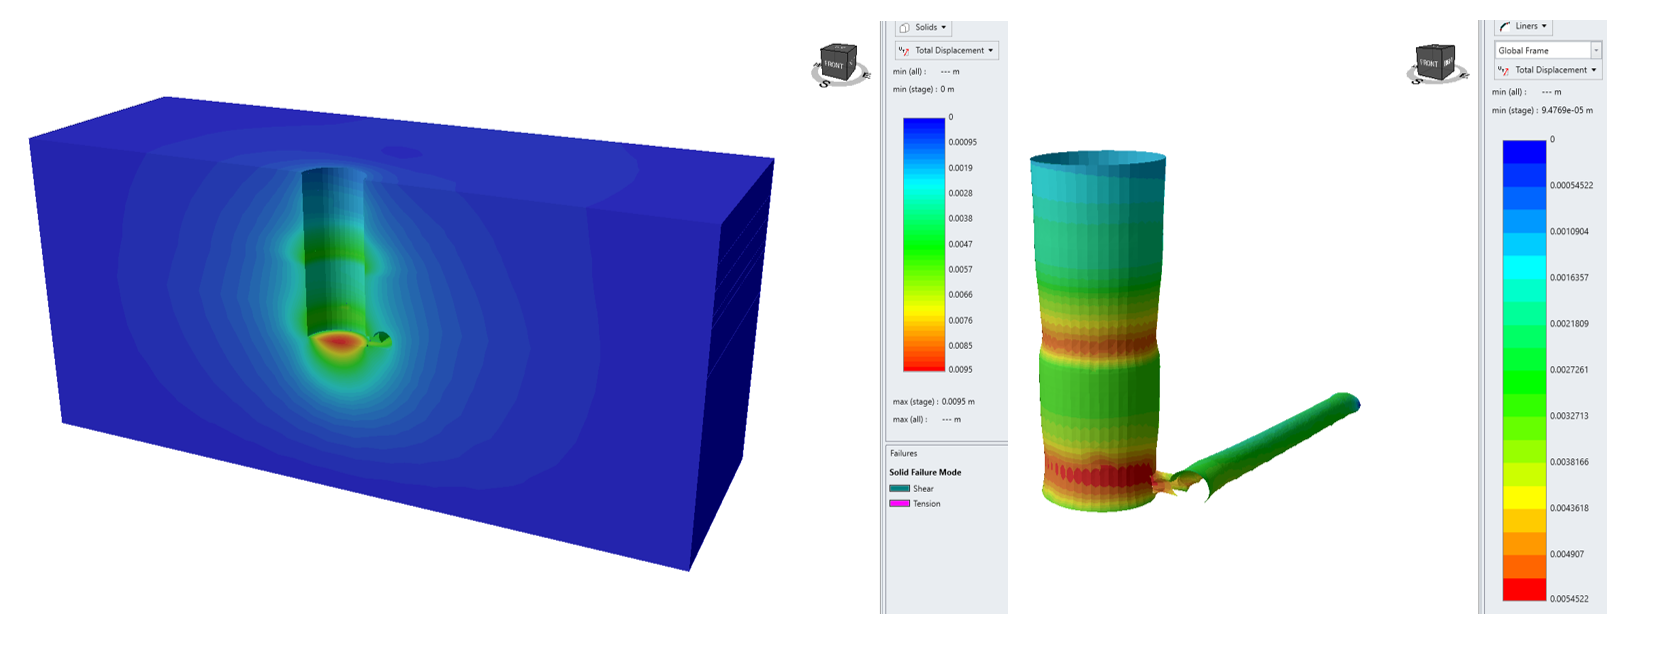
Figure 4(a) shows the total displacement distribution. Heaving occurred at the base of the slab, where the maximum displacement in the model was located. The calculated displacement results show that the largest movements for the shaft occur near the weaker rock intervals and toward the lower part of the shaft. This pattern is consistent with the adopted material profile: the weaker zones have lower GSI values and lower deformation moduli.
The model therefore predicts greater local deformation where the rock mass is more compliant and where the accumulated overburden stress is higher. To observe this behaviour, the scaled deformed configuration of the shaft is plotted in Figure 4(b).
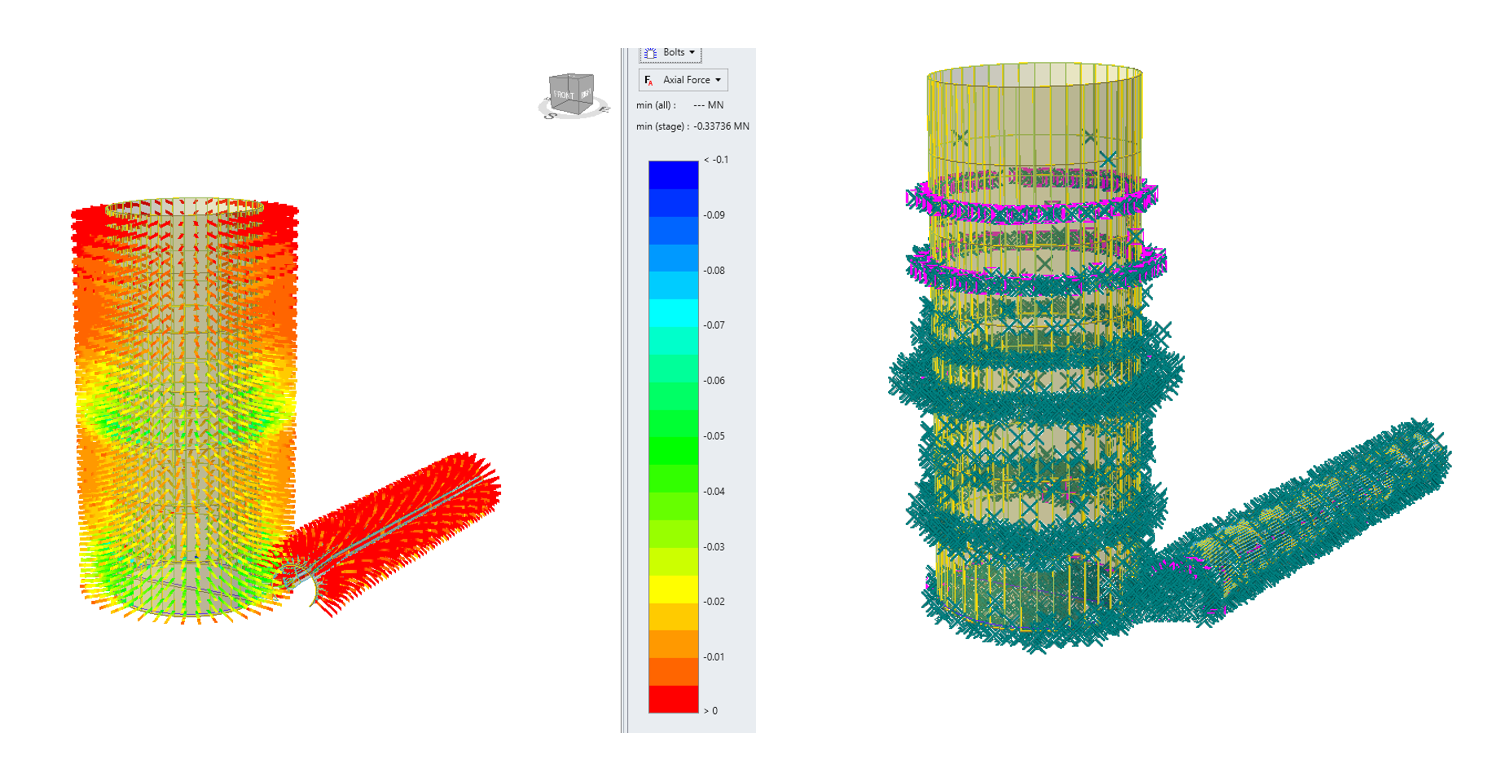
The calculated axial force in the bolts is consistent with the observed deformation. Because the bolts are fully bonded and not pre-tensioned, greater deformation around the shaft results in greater tension in the bolts. As shown in Figure 5(a), the highest axial forces occur in the areas where greater deformation is observed. The maximum axial force observed is about 120 kN, which is well below the maximum capacity of the bolts, indicating that the selected bolt length and spacing are adequate.
The calculated rock-bolt axial forces remain below the assumed tensile capacity of the 26 mm bolts. No bolt failure was observed in the RS3 results. This indicates that the selected bolt length and spacing provide adequate axial resistance for the analysed construction sequence and adopted rock properties.
To evaluate the extent of rock failure around the excavation, the shear and tensile failures are plotted in Figure 5(b). These failures occur in the immediate vicinity of the excavated surfaces. The yielded zones did not expand significantly into the far field. This indicates that the adopted support system is effective in limiting the development of the excavation-induced damaged or yielded zone for the assumed rock-mass parameters.
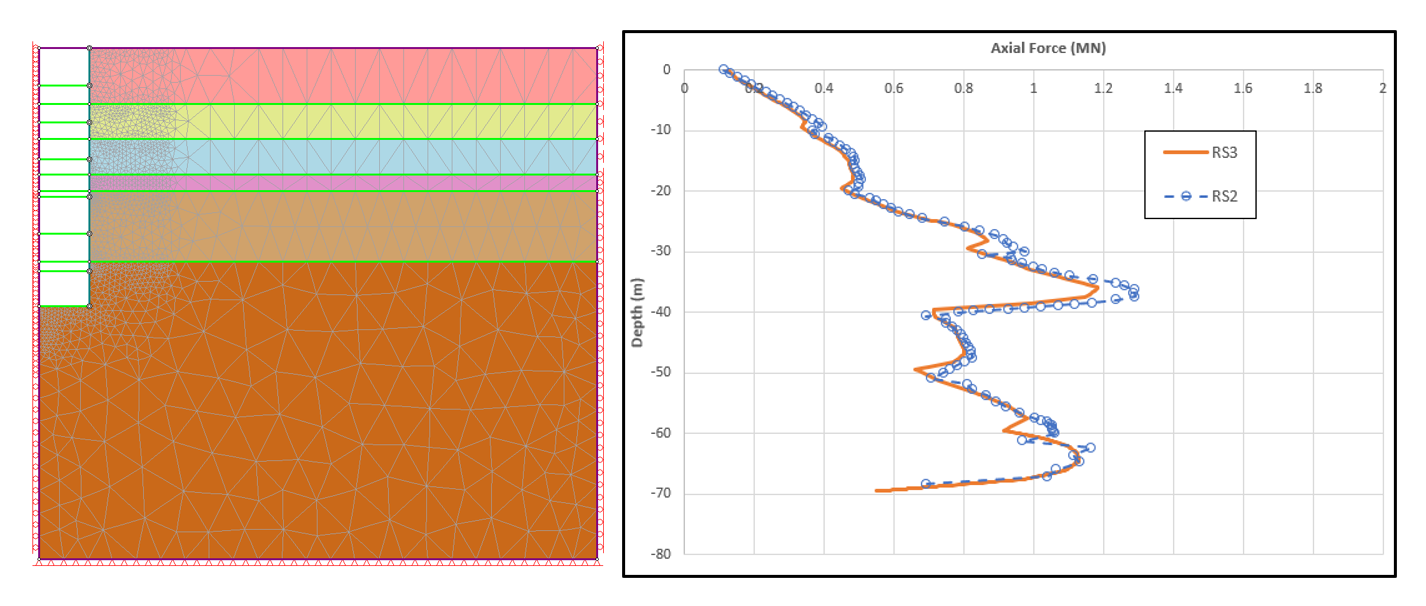
Before creation of the passageway opening, the shaft response is axisymmetric. The liner axial or hoop-force distribution can therefore be compared with an axisymmetric RS2 analysis. The RS2 and RS3 curves shown in Figure 6 show close agreement in the shaft section before the opening is introduced. This is the expected result when the geometry, rock properties, stress field, support assumptions, and construction stage are equivalent.
This comparison is useful because it demonstrates that RS3 reproduces the response of a simpler problem while also providing the capability to analyse more complex geometry. RS2 remains an efficient and appropriate tool for shaft sections that can reasonably be treated as axisymmetric. RS3 becomes especially valuable when the geometry or loading removes that symmetry.
After the passageway opening was created, the axial force around the nearby shaft liner increased by more than 20% (Figure 7). The increase is caused by the removal of part of the shaft boundary and the resulting load transfer around the opening. The liner near the opening has to redistribute forces toward the remaining supported perimeter and into the passageway support.
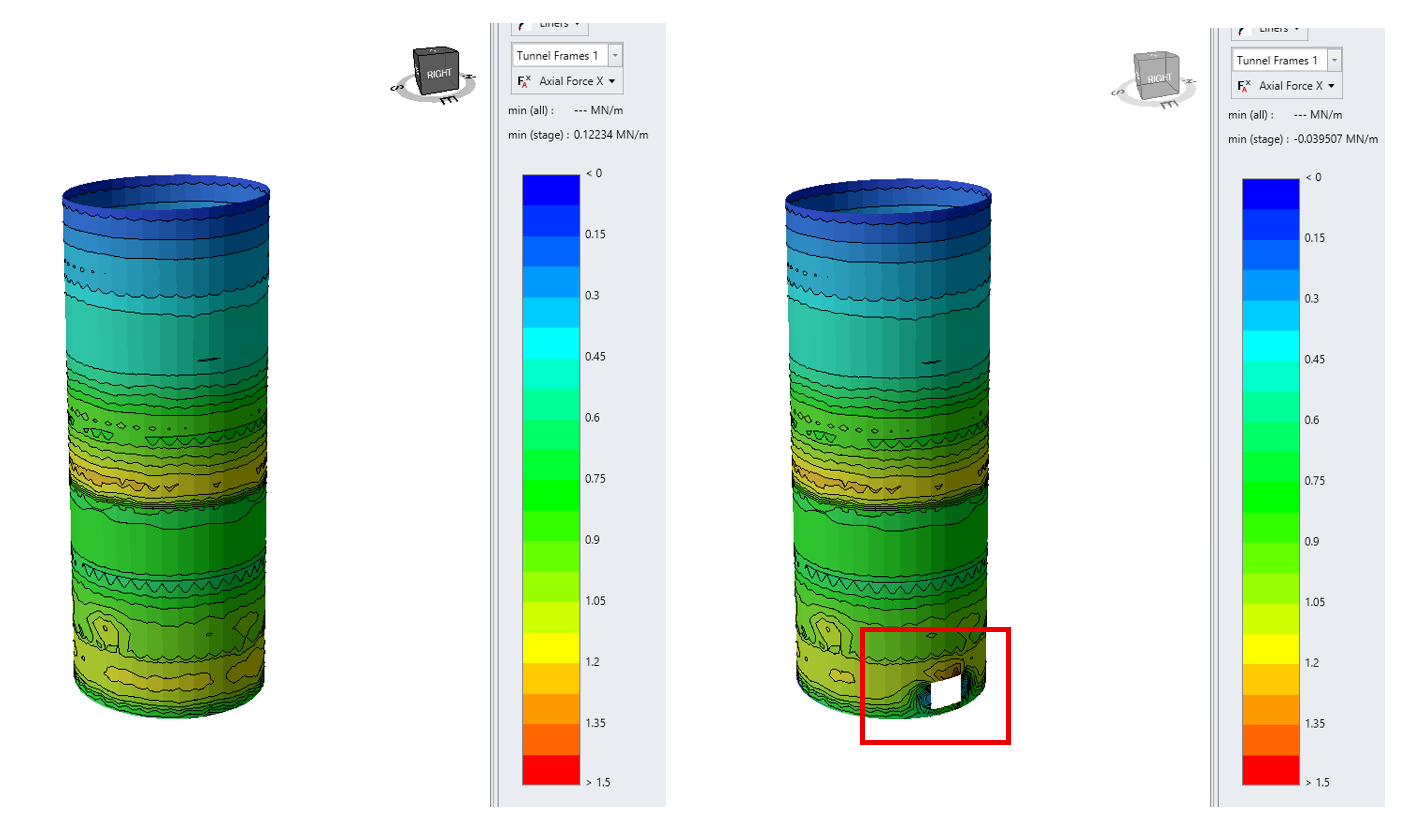
This effect cannot be captured directly in a purely axisymmetric RS2 model because the opening destroys circumferential symmetry. A two-dimensional analysis could be used for preliminary shaft design or for sections sufficiently far from the connection, but it would require simplifying assumptions to approximate the local effects of the passageway. The RS3 model calculates the redistribution directly from the three-dimensional geometry and staged excavation.
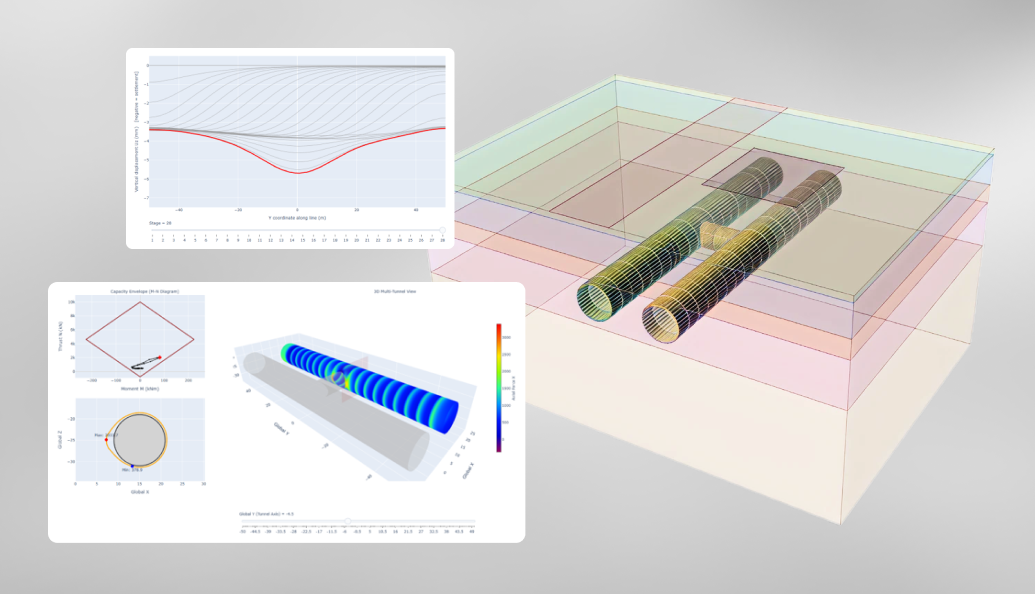
To evaluate the support condition at the critical section, the liner axial forces and bending moments were extracted in the local-coordinate system of the liner and compared with the Carranza-Torres support-capacity envelope for the liners. The results are plotted in Figure 8, which indicates that all the liners lie inside the envelope.
Conclusions
The analysis of the representative 27 m diameter surge shaft illustrates an important consideration in underground excavation design: the appropriate level of dimensionality depends on the geometry and construction sequence being investigated. Where the shaft remains axisymmetric, the RS3 results show close agreement with the equivalent RS2 analysis. This confirms that the simpler approach remains appropriate where its underlying assumptions are satisfied.
The response changes when the passageway is introduced. Removing part of the previously supported shaft boundary creates a local redistribution of load that cannot be represented directly by an axisymmetric model. In the RS3 analysis, the resulting axial force in the nearby shaft liner increased by more than 20%, demonstrating how a relatively localized geometric change can influence the surrounding support system.
For the analyzed construction sequence and adopted rock-mass properties, the support system remained within the assessed capacity limits. Rock-mass yielding was concentrated near the excavated surfaces, bolt demands remained below the assumed capacity, and the liner demands at the critical section remained within the adopted Carranza-Torres support-capacity envelopes.
The broader lesson is not that three-dimensional analysis should replace two-dimensional or axisymmetric methods. Rather, each has a role. Simplified models remain valuable for preliminary assessment and for sections where geometry and loading can reasonably be treated as uniform or axisymmetric. When openings intersect, symmetry is broken, or construction stages create localized load redistribution, a three-dimensional model can provide the additional insight needed to understand how the excavation and support system respond as a whole.
For large underground structures, the question is therefore not simply whether a model can reproduce the excavation. It is whether the model captures the mechanisms that govern its response. In this case, the passageway connection is precisely where that distinction matters, and where three-dimensional analysis provides a more complete view of the interaction between excavation geometry, rock-mass behaviour, and support.
Reference
Carranza-Torres, C., Diederichs, M (2009). Mechanical analysis of circular liners with particular reference to composite supports. For example, liners consisting of shotcrete and steel sets. Tunnelling and Underground Space Technology, 24, 506-532
Kökten, Ö. (2023). A design approach of large diameter surge shaft and passageway connection between headrace tunnels. In Expanding Underground: Knowledge and Passion to Make a Positive Impact on the World. Taylor & Francis.
Take Complex Underground Analysis into 3D
Model complex excavation geometries, staged construction and support systems with RS3.
Start Your Free RS3 Trial