State-of-the-Art 3D Limit Equilibrium Analysis: Slide3 Application at Bingham Canyon Mine
In open pit mine operations, displacement monitoring is crucial for ensuring safety and operational continuity. When unexpected displacements are detected, geotechnical models are used to assess if mining operations need to be modified. This case study highlights how Slide3 was utilized at Rio Tinto Kennecott’s (RTK) Bingham Canyon Mine to back-analyze wall movement and conduct predictive analyses, ensuring continued safe and efficient operation. This marks the first major 3D Limit Equilibrium (LE) modeling project undertaken in-house at RTK, authored by Jeffrey Telfer and Forrest Schumacher.
The Geological Setting
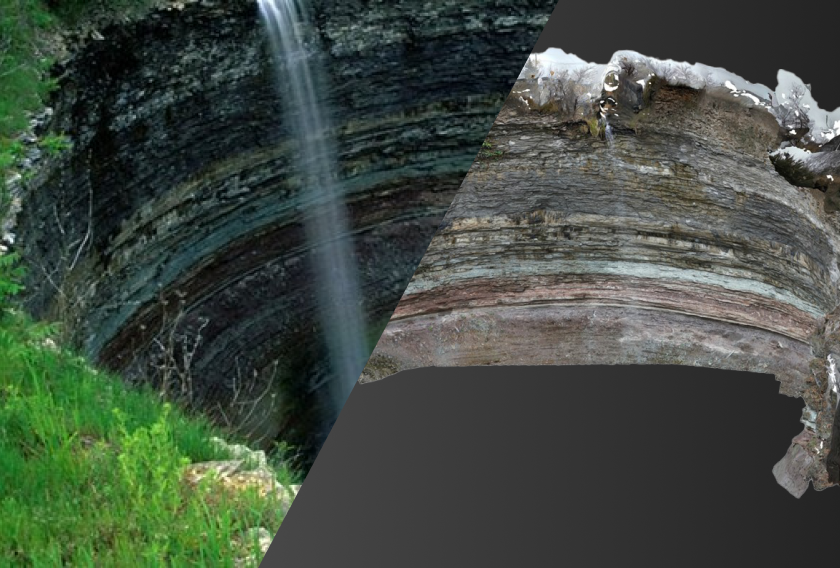
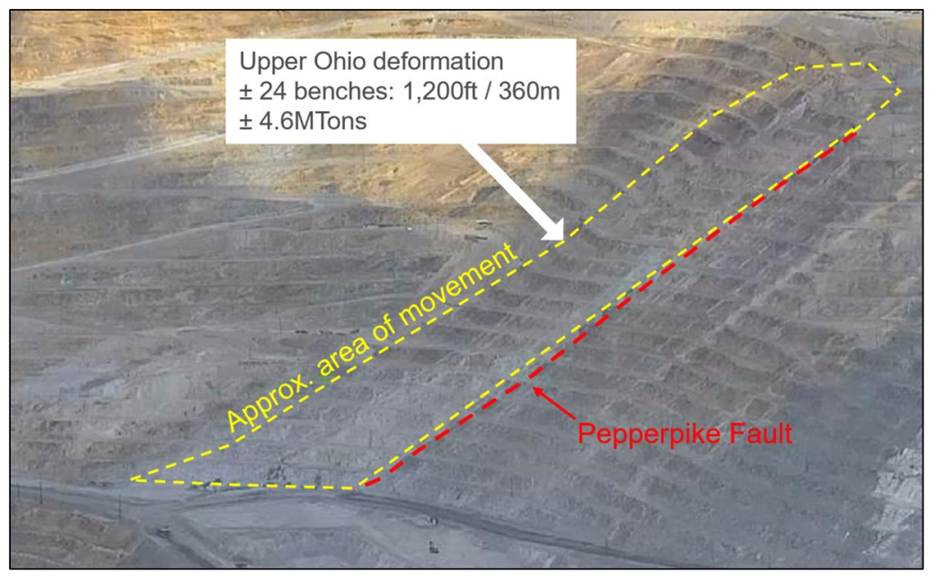
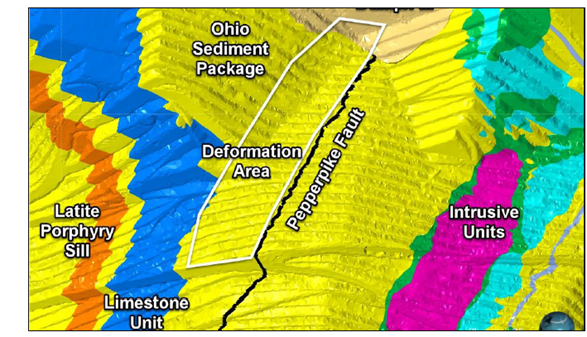
The Bingham Canyon Mine is a porphyry Cu-Mo-Au deposit located in the Oquirrh Mountains, southwest of Salt Lake City. The Upper Ohio instability, the deformation area in question, lies within a cutback with high mining rates and fast bench turnover. This multi-bench instability follows the Pepperpike bedding fault, with a side-release along persistent orthogonal joint sets. Bedding dips from high 30 deg to low 40 deg, striking greater than 50 deg oblique to the wall orientation.
The Challenge
Slope movement was detected through multiple surface and subsurface slope monitoring methods. Levels of movement, location of movement relative to critical infrastructure and sensitivity of movement to mining activities necessitated an in-depth examination of assumed geotechnical material properties and the creation of detailed slope stability models to determine whether mining operations could continue.
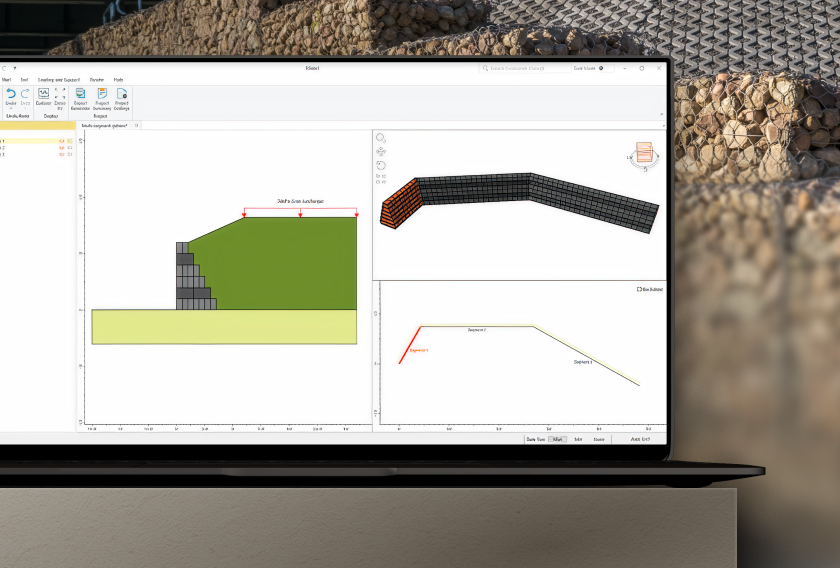
The Modeling
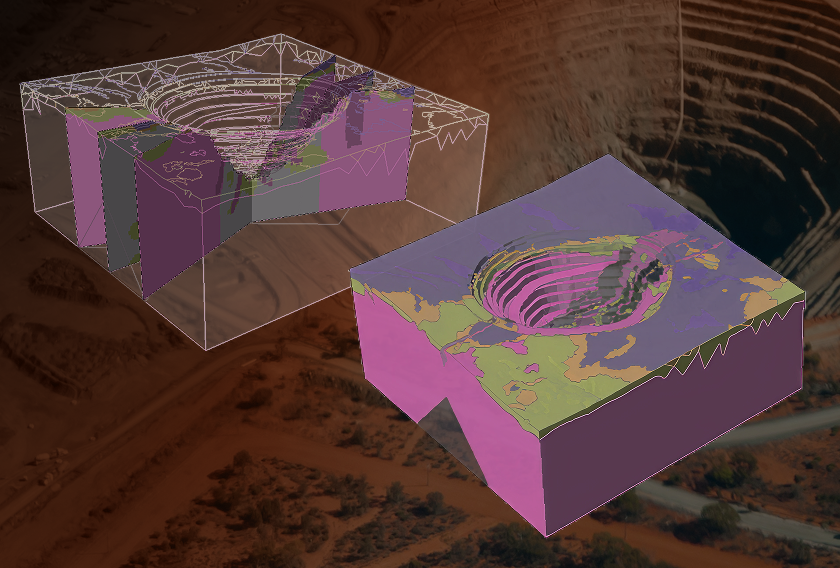
RTK conducted an in-house review of rock mass, structural geology and hydrogeological conditions to gain a full understanding of the failure mechanism of the Upper Ohio instability (full technical details can be found here – see Engineering Geology section). Because a kinematic-style mechanism with wedge characteristics was identified in the structural assessment, 3D LE was chosen as the analysis method.
Back-Analysis
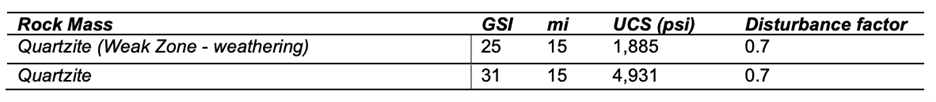
Slide3 was used to model the instability, with a target factor of safety FS=1.0-1.1. The starting rock mass properties were taken from the initial design feasibility studies.
Table 1: GHB Rock Mass Strength Parameters
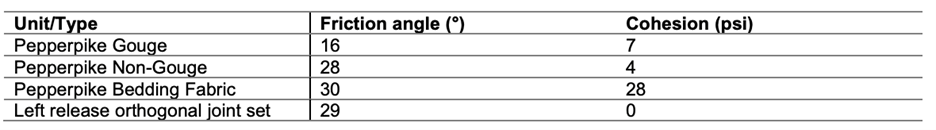
Initial material properties for the Pepperpike fault surface were determined after detailed analysis of the instability, undertaken after movement was detected.
Table 2: Mohr-Coulomb strengths for Pepperpike fault surface
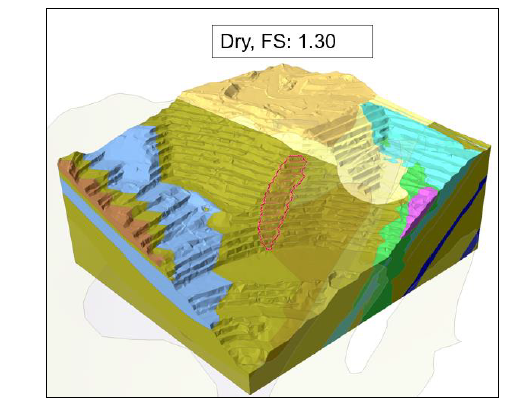
A dry condition was initially assumed, based on groundwater observations.
Initial material property assumptions yielded an unrepresentative failure surface with a FS that was too high (>1.3). A reduction in material properties led to a more appropriate FS.
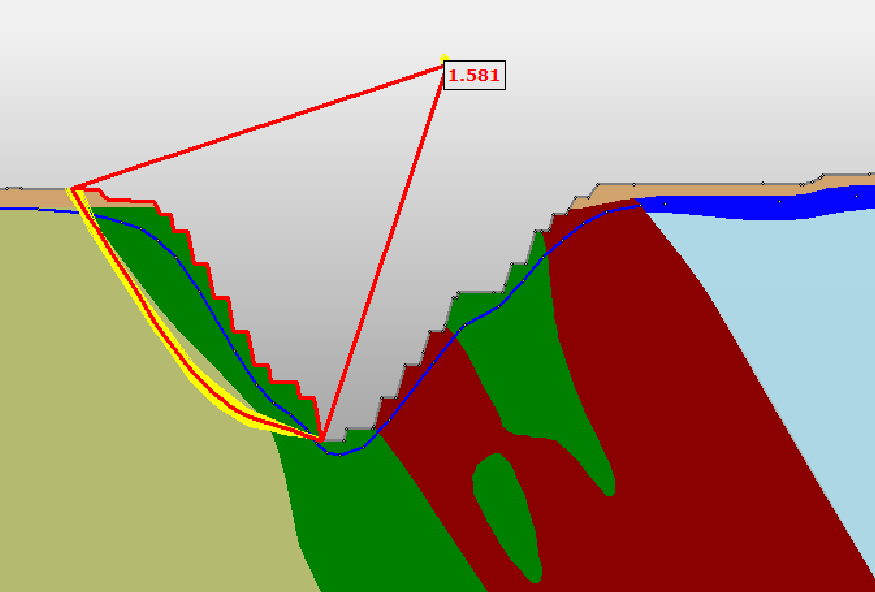
Analyses were also done taking into account the orthogonal joint set mentioned previously, and this more accurately captured the failure mechanism, consisting of the Pepperpike as the right release surface and the orthogonal joint set as the left release. To achieve a more realistic FS, material properties were reduced as follows:
- Increasing D factor to reduce rock mass strength
- Removing cohesion from non-gouge fault to reduce defect strength
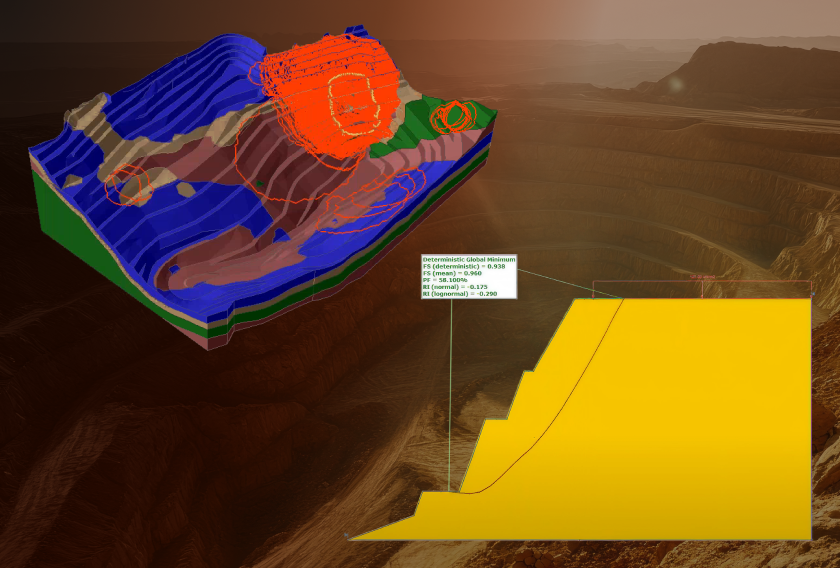
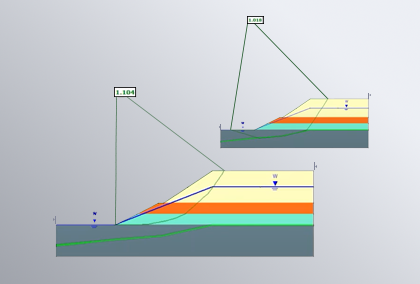
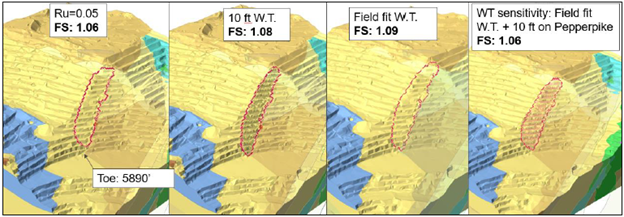
Water sensitivity analyses were also done, as blast holes taken closer to the time of the modeling indicated there was water in the slope. In the end, field measurements were used to develop a water table for the model and the stability results are shown below, with a FS of 1.09.
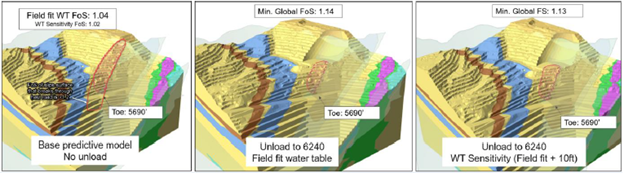
Predictive Analyses
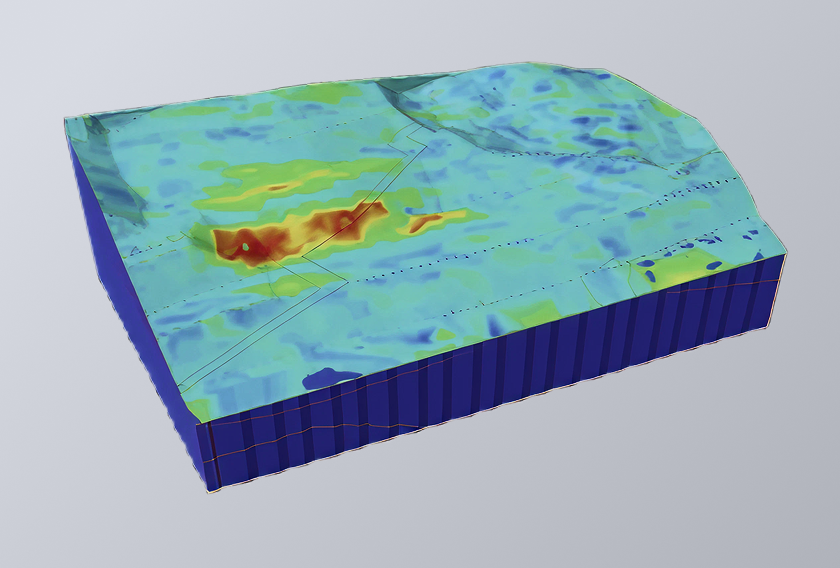
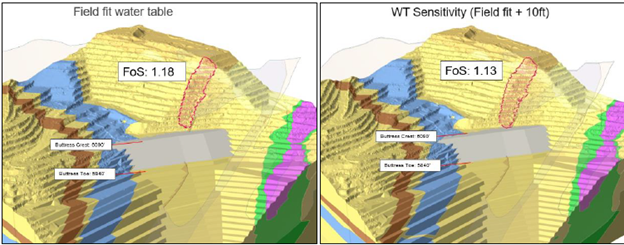
The field-fit water table model was used for additional predictive analyses. Unload, buttress and depressurization options were examined as options for reducing the risk of slope failure.
A depressurization program was already underway, and the slope responded well to that effort. No additional remediation options were taken.
On In-House Modeling
As the RTK team found, there is great value, and efficiency, in having in-house mine geotechnical engineers that are able to carry out slope stability modeling. The in-house team will already be familiar with material properties (or can become so quickly), will be aware of any other sources of uncertainty, and can more effectively collaborate with other internal teams when creating the model than an outside modeling team could.
Rocscience Modeling Resources
To achieve realistic results with geotechnical modeling, it is critical that engineers are equipped with the knowledge to use the relevant modeling software properly. For this reason, Rocscience offers a comprehensive collection of tutorials for each of its programs and offers both standardized and custom courses. For more detailed assistance on specific projects, Rocscience also offers Expert Modeling. A custom course or Expert Modeling can be an excellent way to get your team up to speed on the specific type of modeling they will be doing most.