From Internal Design to 2D and 3D Overall Stability Analysis
- Sina Javankhoshdel, Senior Manager - LEM at Rocscience
A comprehensive stability assessment begins with the right tools. This case study, originally presented by Brocca et al. (2023), demonstrates how leveraging an integrated software suite — RSWall, Slide2, and Slide3 — can be used together to assess the stability of a multi-segment gabion wall supporting a roadway on sloped terrain.
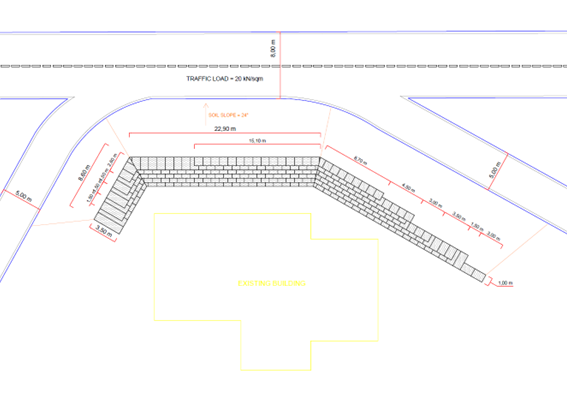
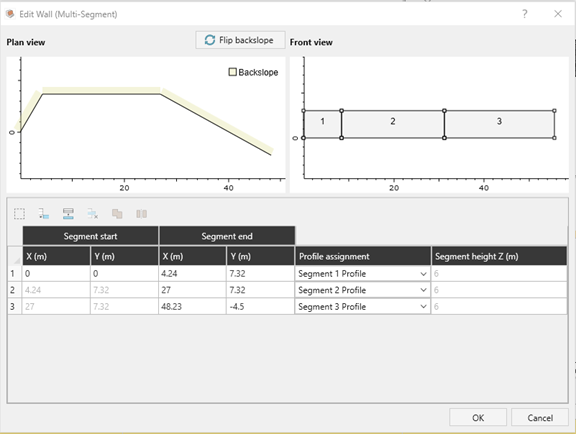
The wall was built in three segments measuring 8.6 m, 22.9 m, and 24.2 m in length. All segments were designed to a uniform height of 6 m, and the wall was constructed to retain soil with a 24° backslope and to support a traffic load of 20 kN/m².
Internal Design of the Gabion Wall Using RSWall
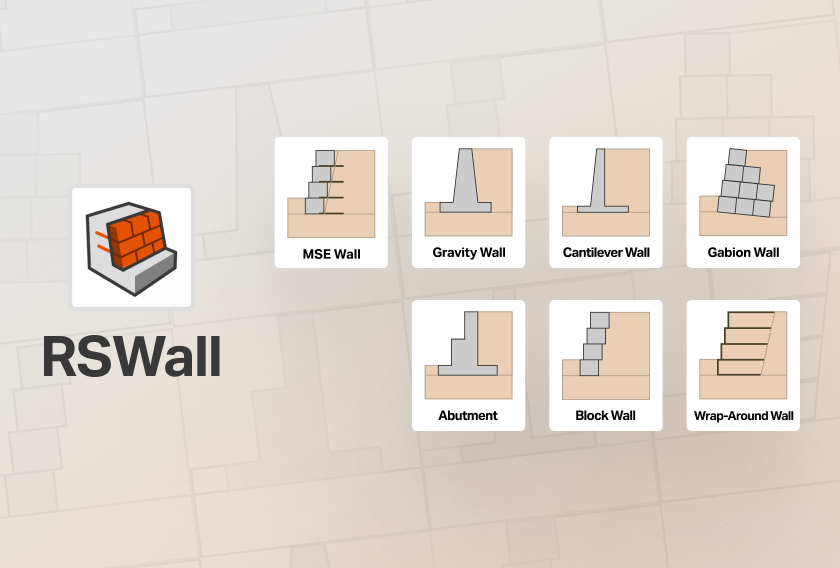
The wall was designed using the Gabion Wall option in RSWall.

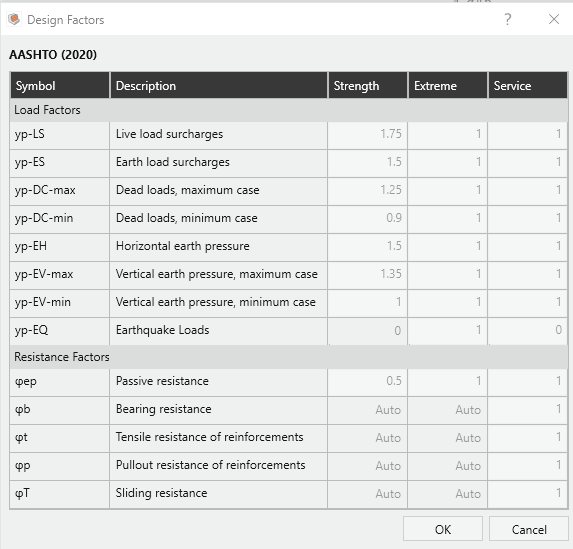
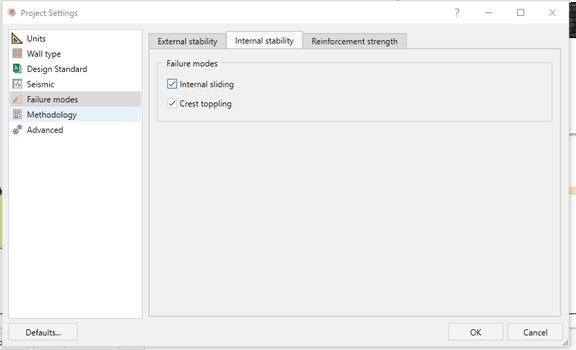
The design followed AASHTO 2020 standards with the Strength Load Combination. RSWall performs external and internal failure checks using the LRFD approach. Load and resistance factors are selected based on the design standard specified by the user.

The following failure modes were considered:
- External stability: sliding, overturning, and bearing capacity.
- Internal stability: including internal sliding and crest toppling (only applicable for segmental and gabion walls).
- For walls with reinforcement, internal sliding can occur along reinforcements and facing blocks.
- For gabion walls, internal sliding relates to the gabion baskets.

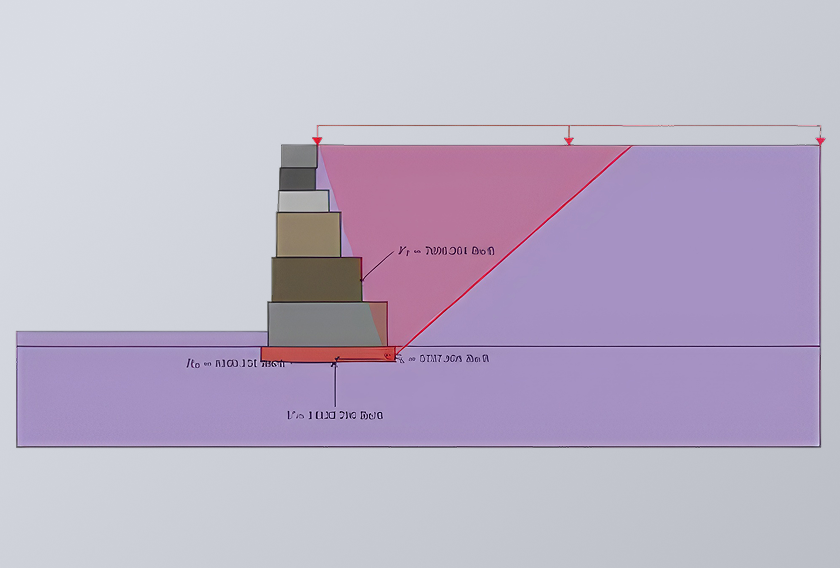
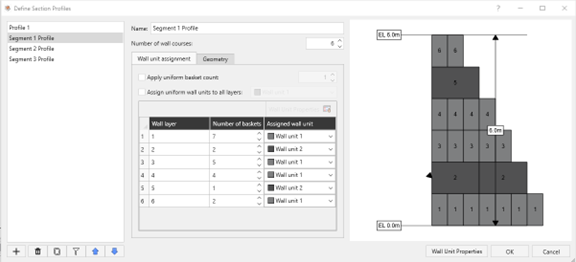
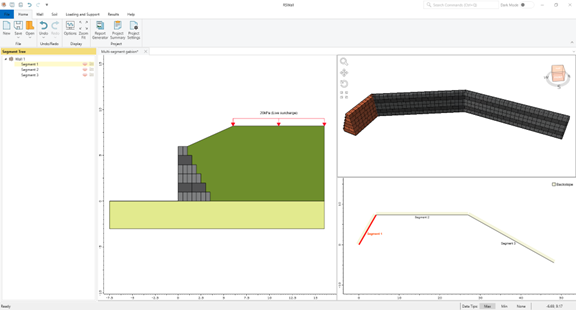
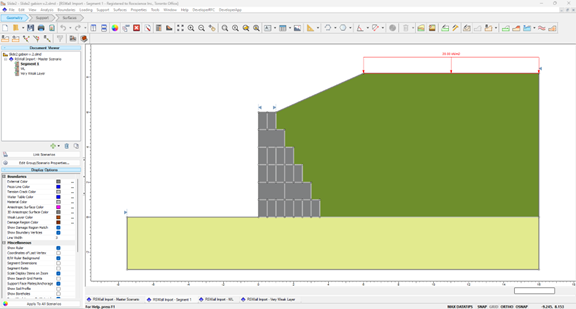
The Coulomb method was selected in RSWall to calculate active earth pressure. Two basket depths (0.5 m and 1.5 m) were used to create a non-uniform wall profile. The multi-segmental wall geometry was defined using the soil profile coordinates, via the Wizard Tool in RSWall.
Three segment profiles with identical geometry were modelled. Dark-colored baskets indicate a 1.5 m depth, while lighter-colored baskets indicate 0.5 m depth.
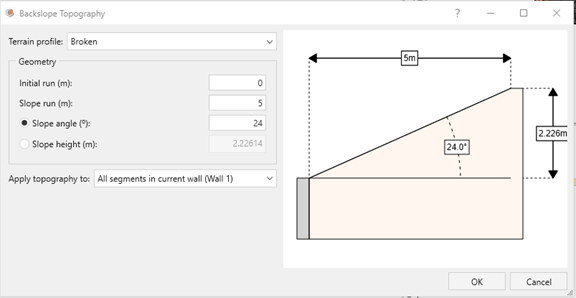
The backslope was defined at an angle of 24°.
Soil Properties
Soil\ Parameter |
Unit weight kN/m3 |
Friction angle(o) |
Soil-structure friction angle(o) |
Long-term cohesion (kPa) |
Backfill |
20 |
30 |
24.5 |
0 |
Foundation |
20 |
30 |
24.5 |
10 |
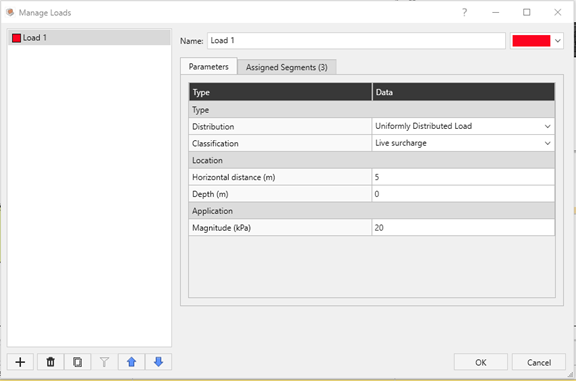
A live distributed load of 20 kPa was also applied to the wall.
The multi-segment gabion wall model is shown below.
After computation, the results showed that the wall is stable. The lowest Capacity-to-Demand Ratio (CDR) was 1.01 for base sliding (external failure). As all segments have the same height and profile, they exhibit the same CDR.
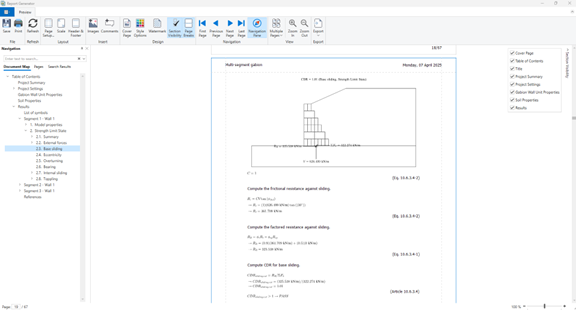
RSWall’s redesigned report generator provides detailed hand calculations for each wall segment. Below is an example hand calculation for the base sliding failure surface in Segment 1.
Since the model satisfied both external and internal stability, the next step involved importing it into Slide2 for overall stability analysis.
Overall Stability Analysis Using Slide2
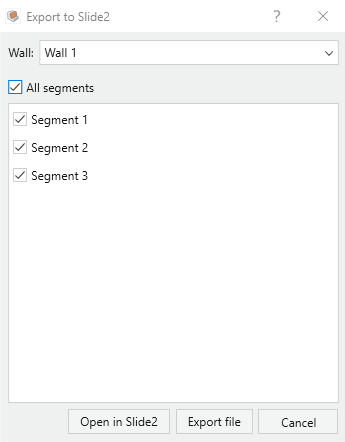
All segments were exported into Slide2, generating a multi-scenario project file.
In Slide2, the wall was modelled with a cohesion of 500 kPa, a friction angle of 45°, and a unit weight of 24.3 kN/m³.
The method by Javankhoshdel et al. (2022) was used to estimate the strength of the gabion units. With a minimum gabion dimension of 0.5 m and mesh tensile strength of 40 kN/m, the equivalent cohesion (Cr) of the gabion wall was calculated using the following equations:

Where:
- φ is the friction angle of the fill in the baskets.
- Δσ₃ is the increase in confining pressure from Eq. 2 (Bathurst & Karpurapu, 1993).
- fₜ is the mesh tensile strength.
- d is the minimum gabion dimension.
- εₐ is the axial strain at failure (typically 0.05–0.07).
- εc is the circumferential strain from Eq. 3.
Using an Excel sheet and assuming 75 kN/m mesh strength for 1 m x 1 m blocks, cohesion was estimated as 110–115 kPa. A value of **c = 110 kPa** was used for this model.
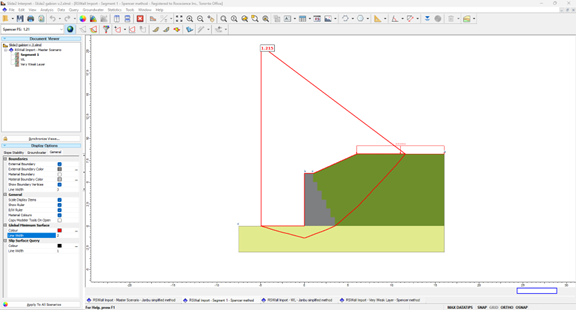
The overall factor of safety (FS) using the Spencer method and auto-refine (circular search) was FS = 1.35, which satisfies most design thresholds.

Javankhoshdel et al. (2022) also recommend using non-circular search for gabion walls, especially when weak layers exist between basket interfaces. Using the Cuckoo search (non-circular method), Slide2 produced FS = 1.2 with the failure surface extending behind the wall.
Non-circular searches typically produce lower FS values than circular ones.
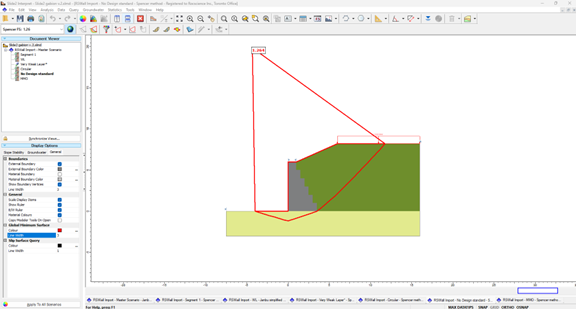
Note: Slide2 applies LRFD factors when models are imported from RSWall. If the design standard is set to "None", Slide2 switches to ASD (Allowable Stress Design), which slightly increases the FS.
A weak layer was modelled in Slide2 at the basket interfaces using c = 20 kPa and φ = 15°. This reduced the FS to 1.1 using the Spencer method.

Enabling "Show All Surfaces" and filtering Fs < 1.2 revealed multiple potential slip surfaces, characteristic of multimodal failure.
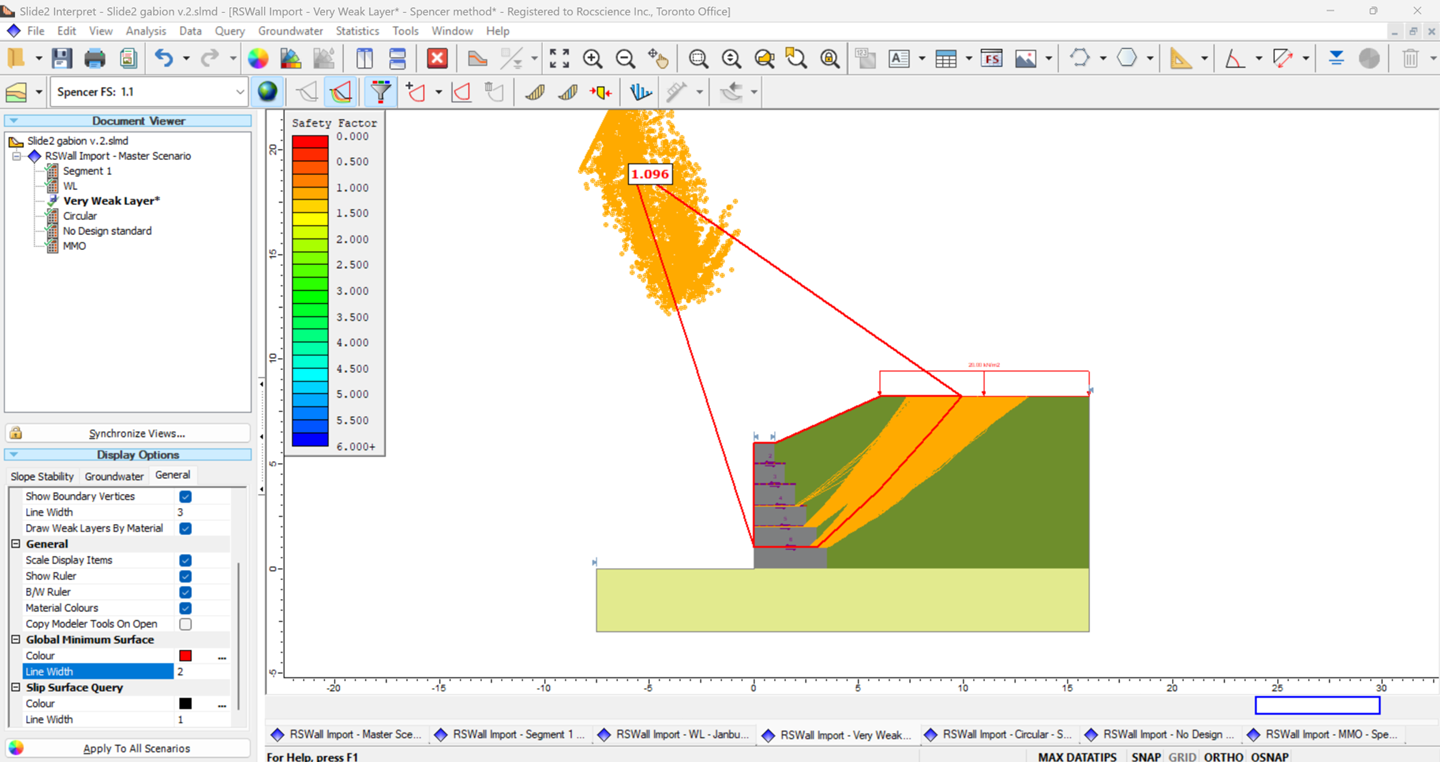
The Multiple-Modal Optimization (MMO) option in Slide2 (Particle Swarm → Multiple) was used to identify multiple valid slip surfaces.
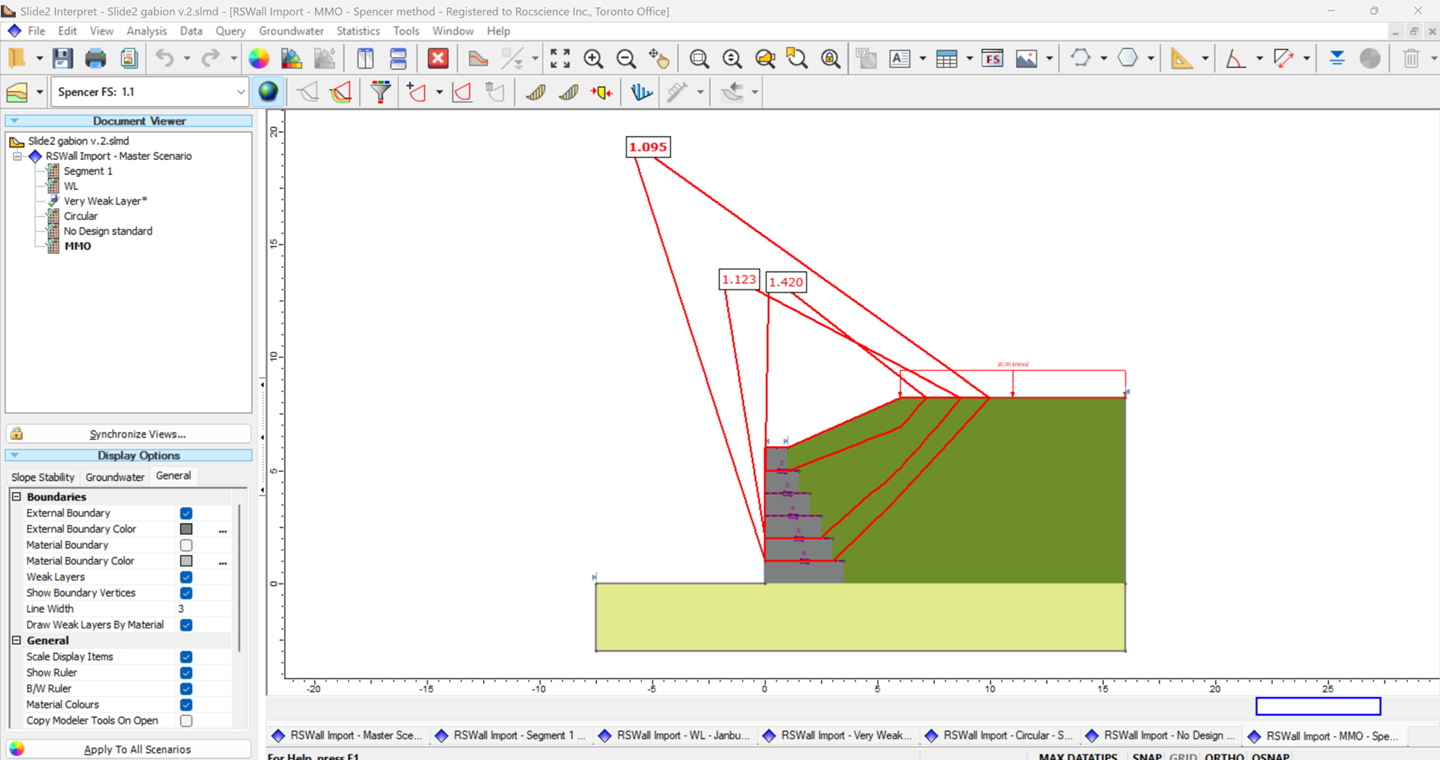
The results showed several failure surfaces with FS < 1.2, confirming the multi-modal behavior. Since the wall and soil properties were the same across all segments, Slide2's stability results applied to all. However, a 3D analysis offers a more comprehensive picture, as 2D models assume infinite geometry and loading normal to the model plane.
3D Overall Stability Analysis Using Slide3
The model was recreated in Slide3, including actual road and wall dimensions, angles, and traffic loads. 3D analysis provided even greater insight.
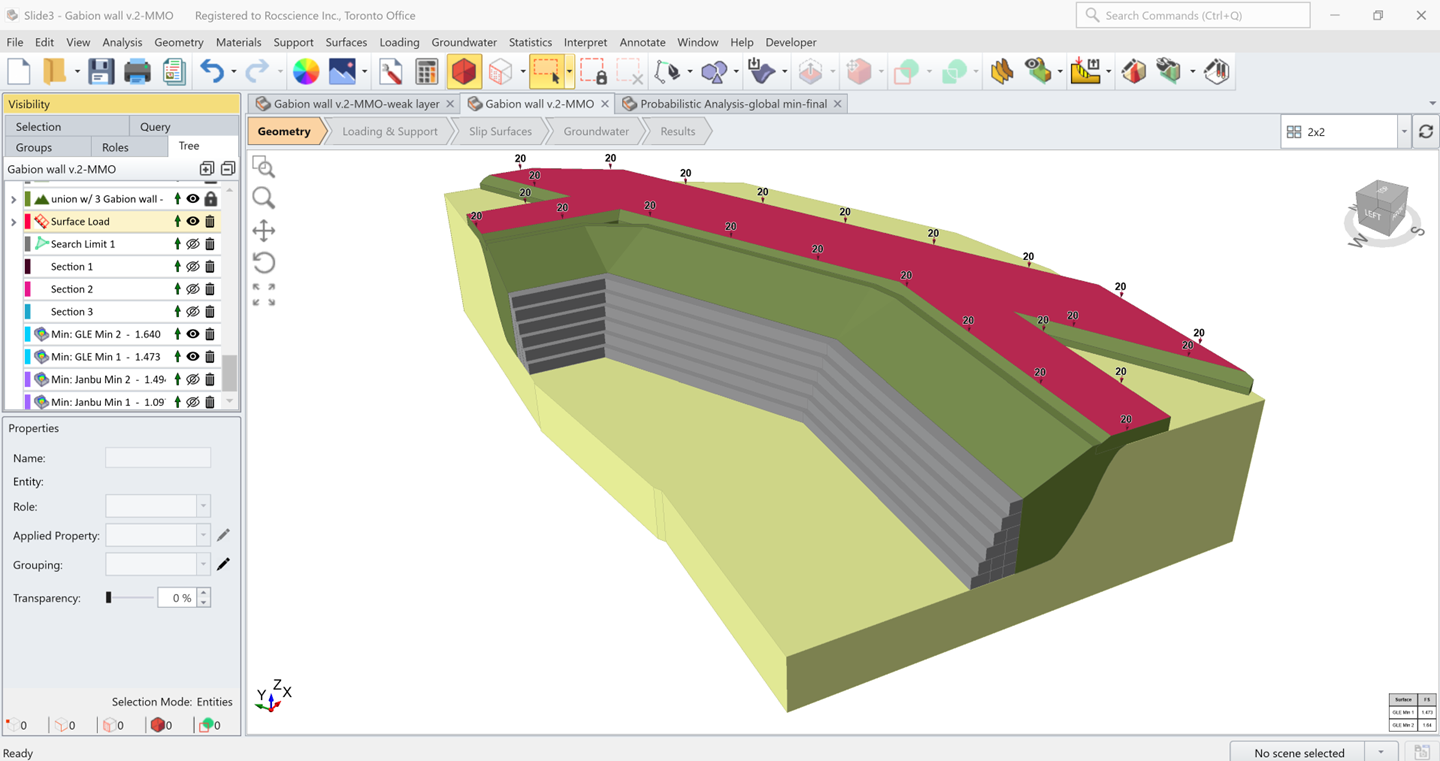
Using the cohesion method (c = 110 kPa) and the MMO option in Slide3, critical slip surfaces were identified.
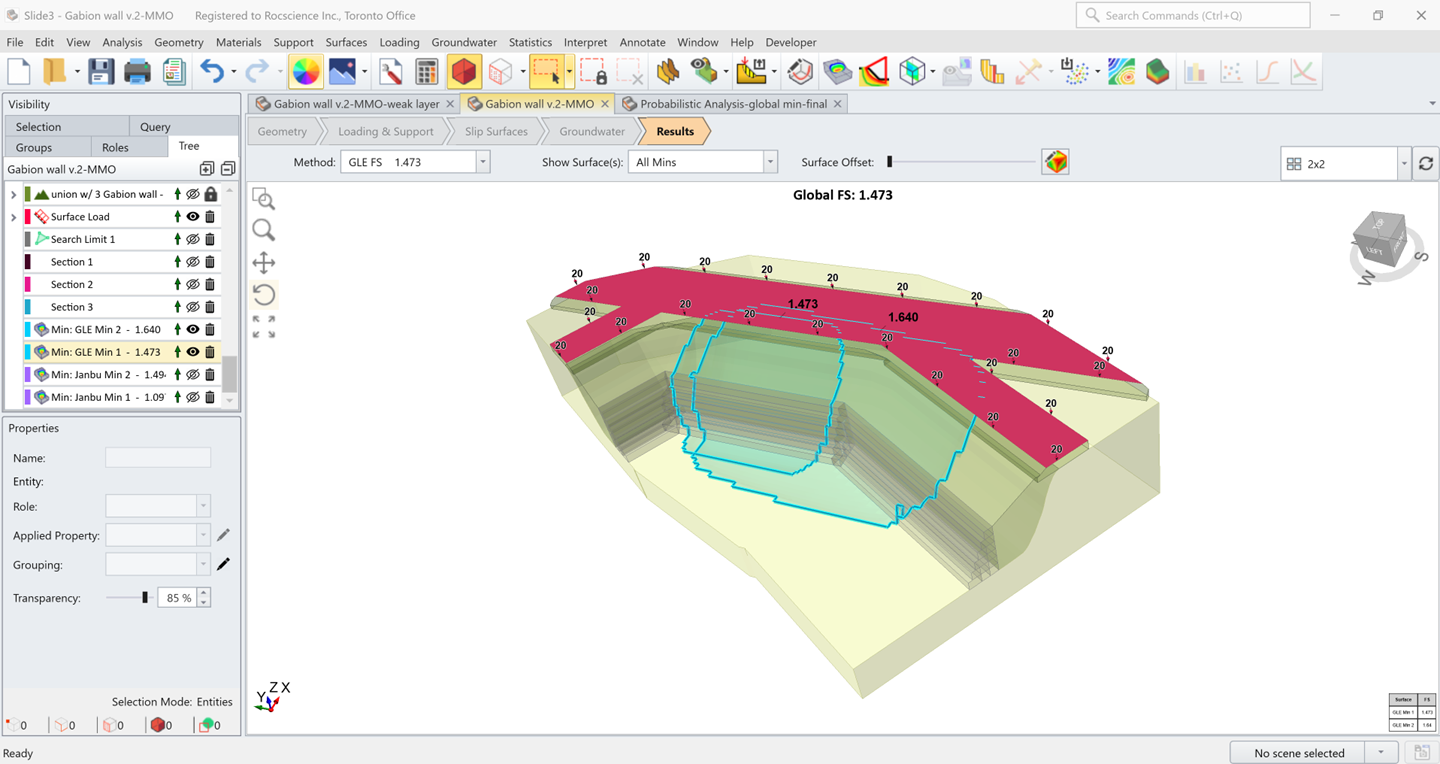
The results showed two primary failure surfaces with FS = 1.4 and 1.6, both higher than 2D values. This is typical, as 3D analysis accounts for wall strength more realistically.
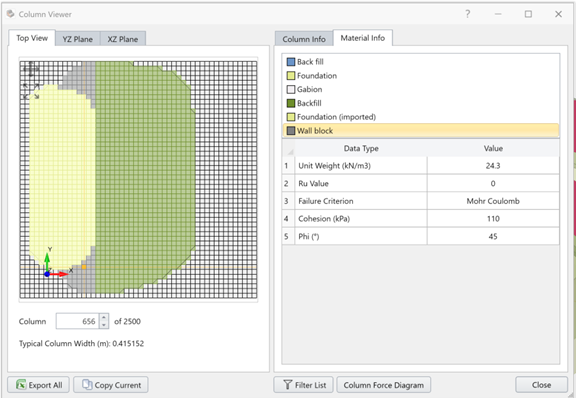
The column viewer in Slide3 confirmed that some parts of the slip surface intersect the high-strength gabion blocks.
What This Means for Future Gabion Wall Designs
Using RSWall, Slide2, and Slide3 in sequence allows you to assess both internal and global stability with precision across 2D and 3D models. With this approach, you can identify critical slip surfaces early, especially in complex geometries and layered interfaces.
References
Bathurst, R.J. and Karpurapu, R. 1993. Large-Scale Triaxial Testing of Geocell-Reinforced Granular Soils. Geotechnical Testing Journal, 296-303.
Brocca, G., Vicari, M., Javankhoshdel, S., Ma, T. and Cami, B., 2023, November. Internal and Global Analysis of a Gabion Wall Using 2D and 3D Limit Equilibrium Analysis: A Comparison of Multiple Methods. In Rocscience International Conference (RIC 2023) (pp. 751-762). Atlantis Press.
Javankhoshdel, S., Sy, L.J., Ma, T., Cami, B., Yacoub, T. 2022. Limit equilibrium analysis of gabionwalls. GeoCalgary 2022.
Put RSWall to the Test
Model your next gabion wall with full stability analysis — your free trial starts here.
Try it nowMore from Rocscience