Studying Freeze-Thaw Erosion at the Devil’s Punchbowl With the Rocscience Software Suite
- Dr Grace Huang, Geotechnical Product Manager
At the Devil’s Punchbowl in Hamilton, Ontario, where a subvertical sedimentary gorge hosts a famed waterfall, a team of researchers from Western University is studying how freeze-thaw erosion impacts rock slope stability.
Using drone-based photogrammetry and LiDAR, the team captured the site at various stages of the freeze-thaw cycle. Each set of photos was reconstructed into a 3D model using ShapeMetriX, which will later be used in Slide3, RocSlope3, and RocFall3, highlighting how our integrated software suite brings new insights to rock slope stability assessments.
The Devil’s Punchbowl
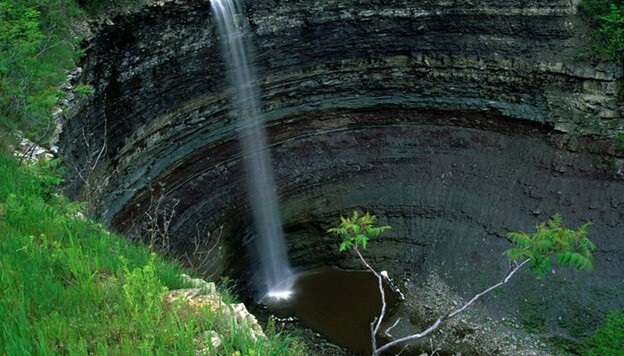
Located on the Niagara Escarpment, there’s a 37 m ribbon waterfall at the Devil’s Punchbowl that cascades over exposed, colourful sedimentary strata dating back 450 million years. It was formed at the end of the last ice age by glacial meltwater, and today, it is a popular hiking destination with trails leading down the gorge.
The team from Western University chose the Devil’s Punchbowl as the study site for two reasons: (1) There is substantial evidence of erosion and slope failure, as seen in the form of groundwater seepage from the subvertical gorge walls and the mounds of talus at the slope toe. The seepage is expected to freeze over the winter then thaw in the spring. (2) The rock slopes are exposed, meaning that photogrammetry could be adopted without vegetation interfering with the slope geometry measurement.
Field Data Collection via Photogrammetry and LiDAR
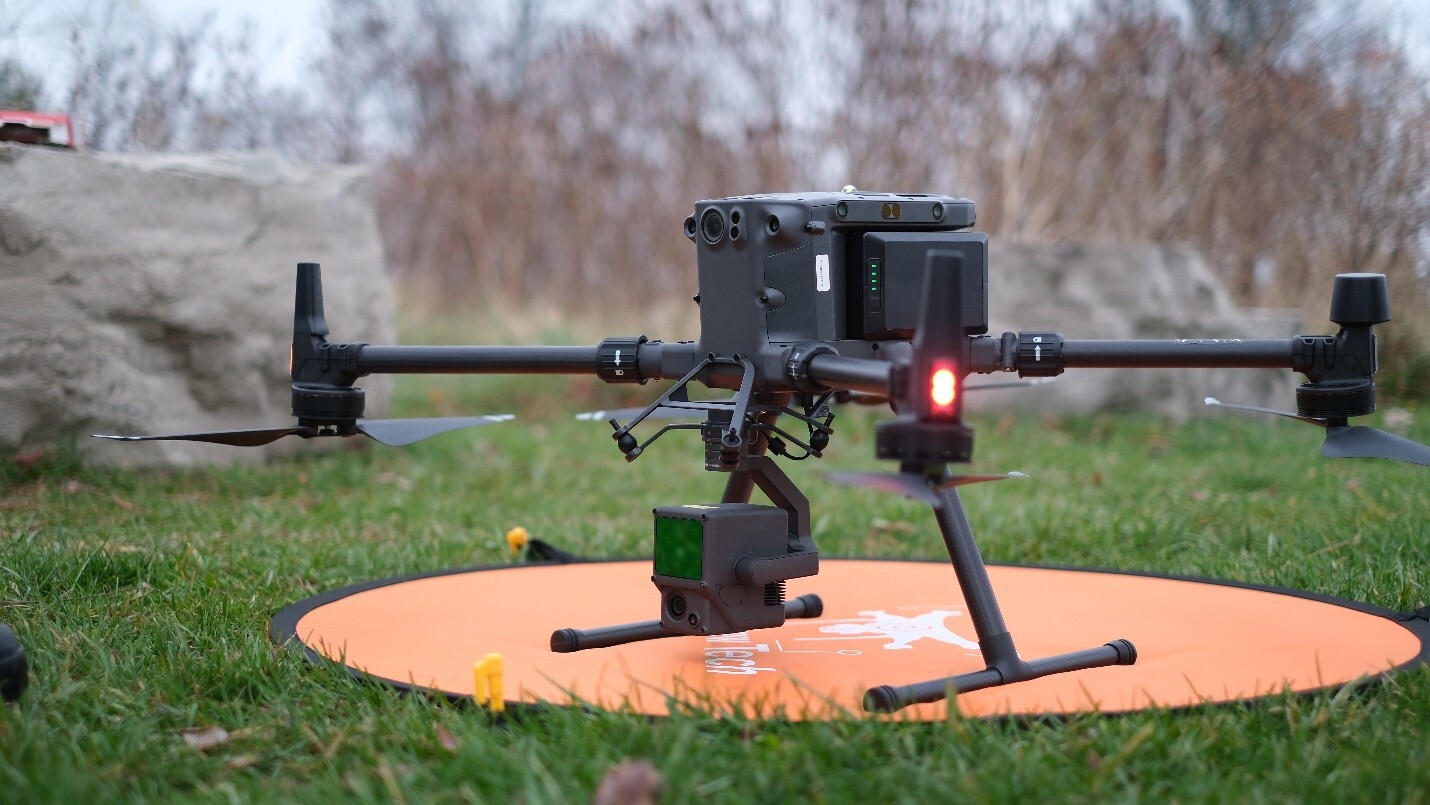
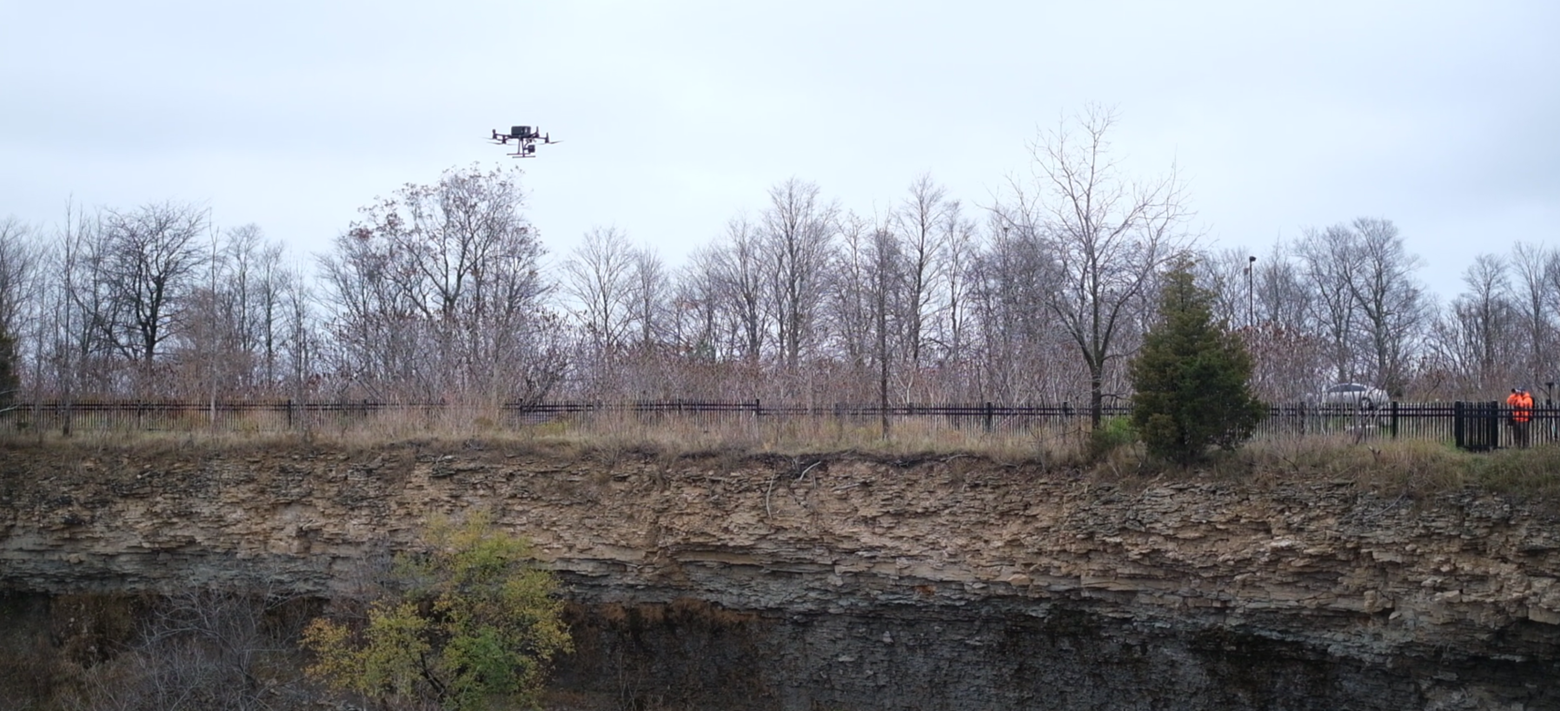
To capture slope geometry at various instances in the freeze-thaw cycle, a DJI Matrice 300 drone with separate payloads for photogrammetry and LiDAR was deployed.
Both photogrammetry and LiDAR are remote sensing techniques that enable the generation of 3D models of the real world. Photogrammetry relies on the use of overlapping 2D photos of the site, whereas LiDAR results in a point cloud representing the ranges measured from the sensor to the slope via laser.
Georeferencing was provided by an RTK station, which was connected to the Global Navigation Satellite Systems and the drone. This way, the drone’s location and the location of the data collected were always known.
Data collection occurred across key stages of the freeze-thaw cycle:
- November 15, 2024: The waterfall was flowing freely.
- December 2, 2024: The waterfall was partially frozen.
- January 23, 2025: The waterfall was completely frozen.
One more round of deployment is planned for April or May to obtain the post-thaw data. The team plans to generate a total of 8 models (i.e., 4 days x 2 remote sensing techniques) and to perform a stability analysis for each model to compare the site’s stability throughout freeze-thaw.
Data Processing
The Western team used ShapeMetriX to generate 3D slope models using the photogrammetry data. While ShapeMetriX is also capable of processing LiDAR data, the team’s LiDAR unit came with its own proprietary software for generating the point cloud and was processed separately.
Each photogrammetry data set consisted of approximately 1800 photos (.png) covering an area of 70 m x 30 m. Every photo set was simply uploaded onto the ShapeMetriX MultiPhoto module, which then stitched together the photos using their location metadata to construct a 3D mesh and surface texture of the site.
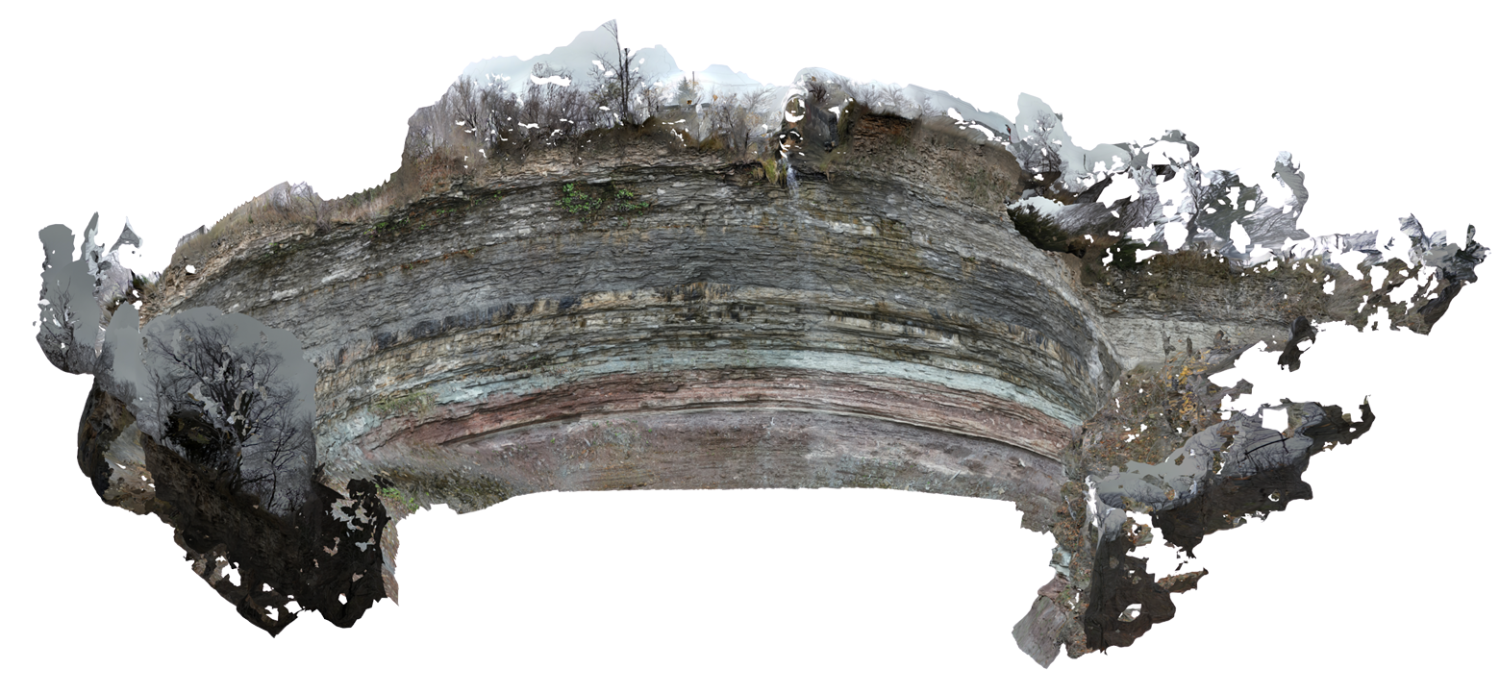
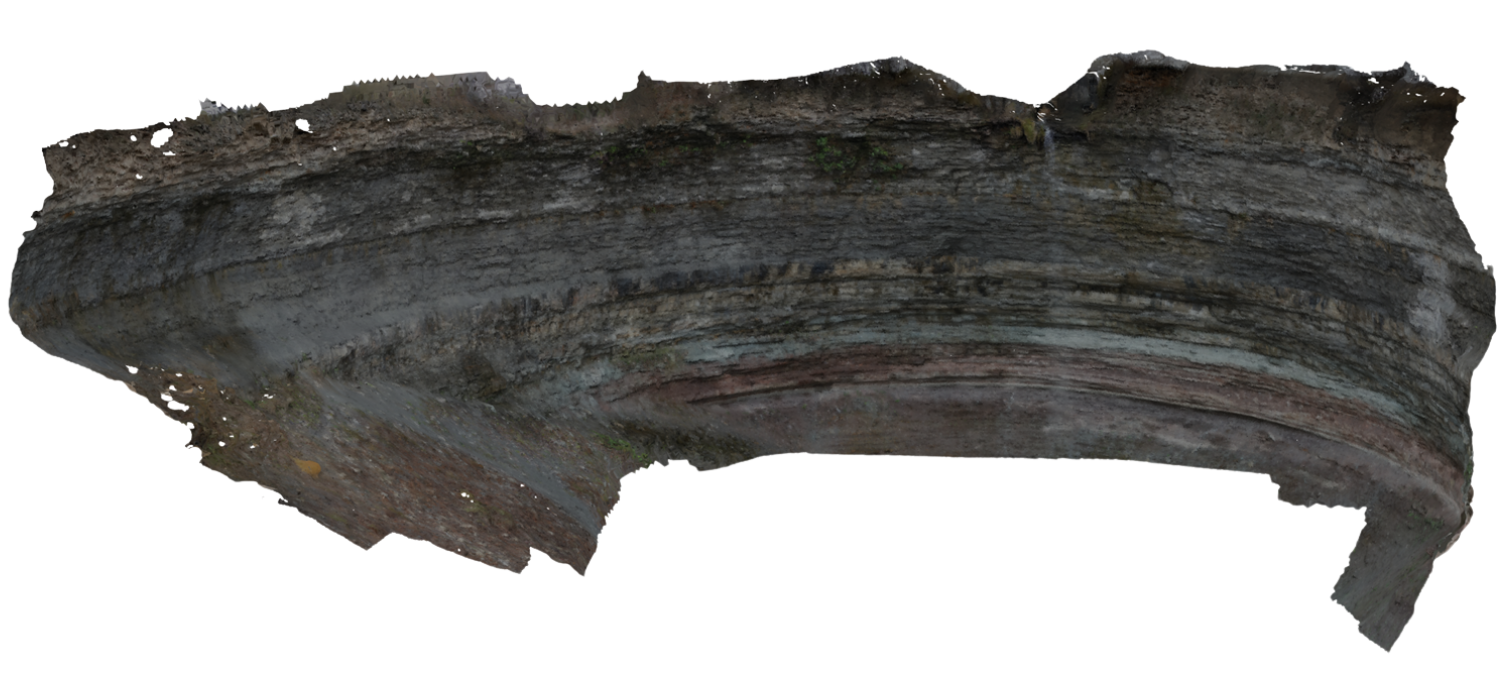
The model peripheries tended to lack data, resulting in holes and incomplete surface generation. However, the ShapeMetriX Model Editor module cleaned floating pieces and trimmed the models.
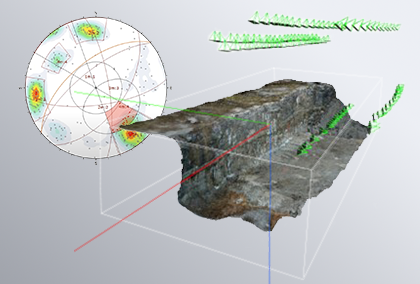
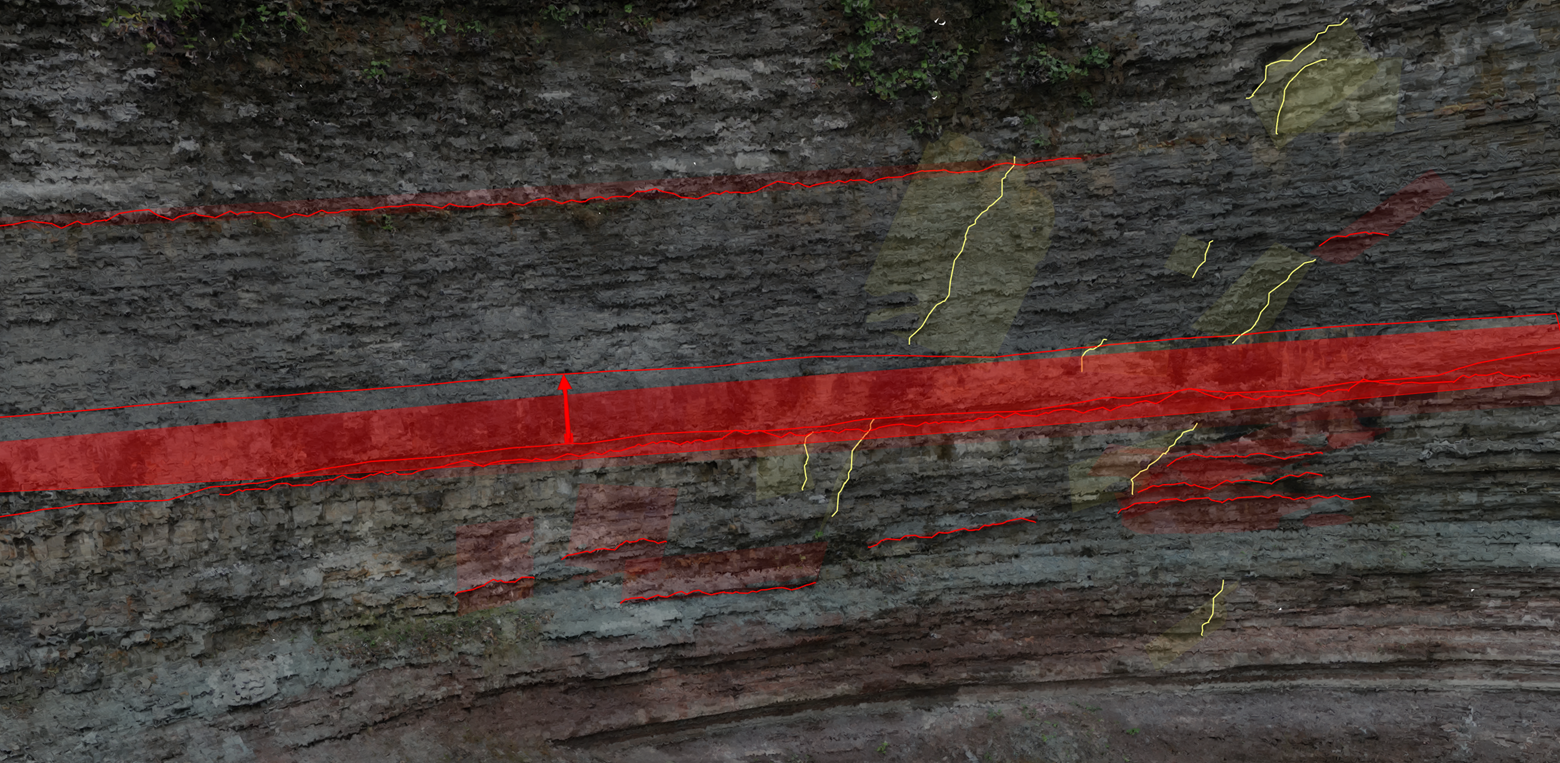
The team also plans to use the structural mapping features in ShapeMetriX’s Analyst module to generate discontinuity models. After reconstructing the Devil’s Punchbowl in a surface texture and 3D model, the team can then map structures by identifying their locations, orientations, and apparent sizes.
Application of 3D Models
Although the project has not yet reached the modelling phase, the team plans to use the 3D models for several types of slope stability assessment across the Rocscience software suite.
Global Stability Assessment in Slide3
The 3D slope model generated in ShapeMetriX will be imported into Slide3 to serve as the model geometry. The structures mapped in ShapeMetriX will also be imported into Slide3 in the form of .dxf files to serve as weak layers, such that the discontinuities are explicitly modelled. Although bedding planes can be clearly mapped, some assumptions will have to be made for the subvertical structures in the limestone. Slide3 can then be used to search for the critical slip surface and calculate a factor of safety for every model.
Block Stability Assessment in RocSlope3
If during structural mapping the team finds some orientations favorable for wedge or planar failure, then a 3D block stability assessment could be performed in RocSlope3.
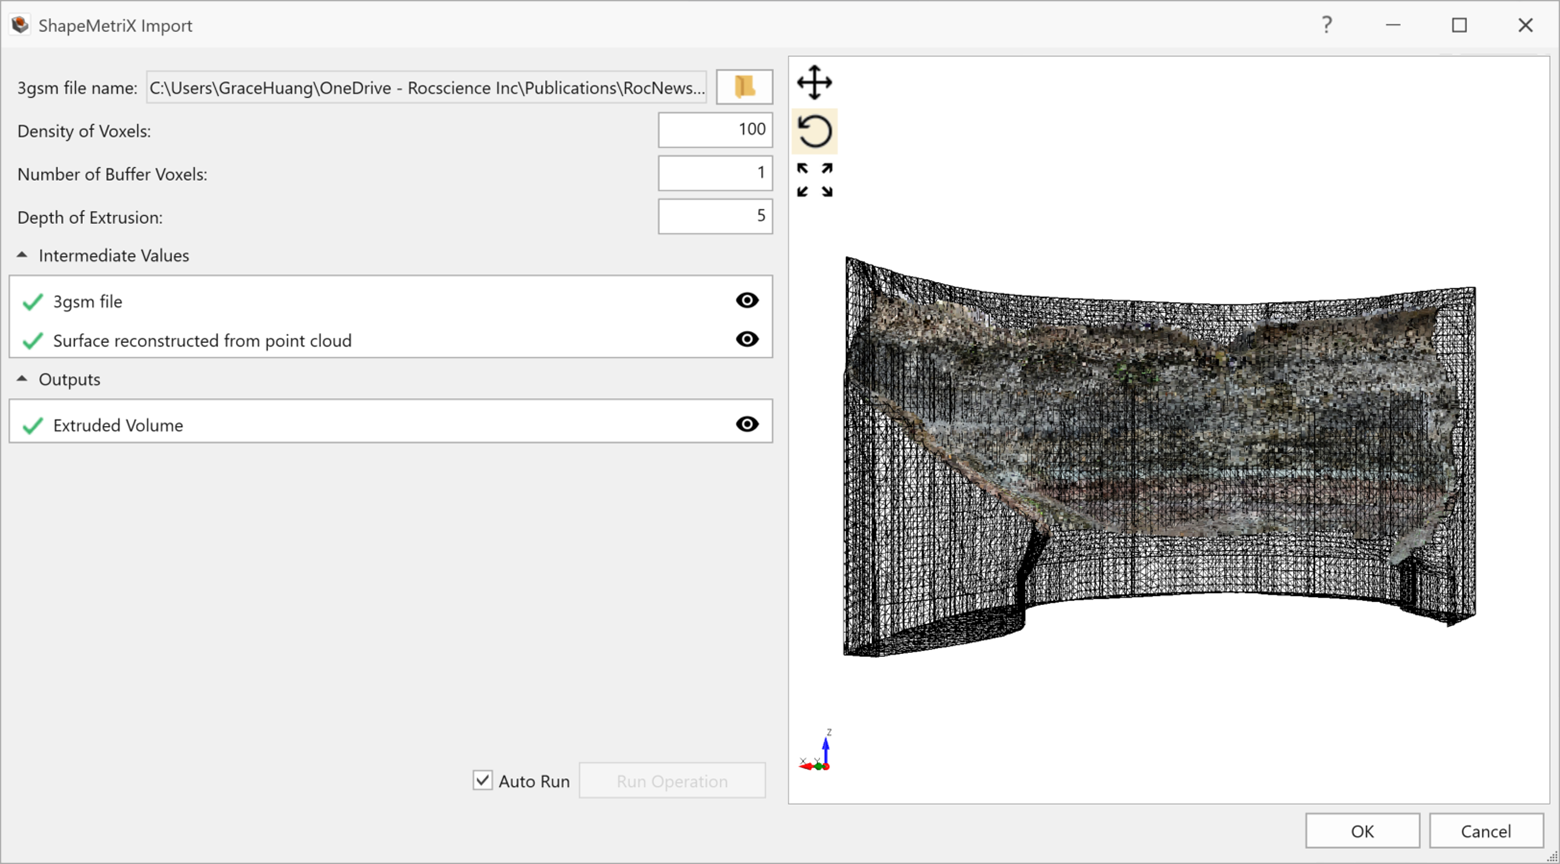
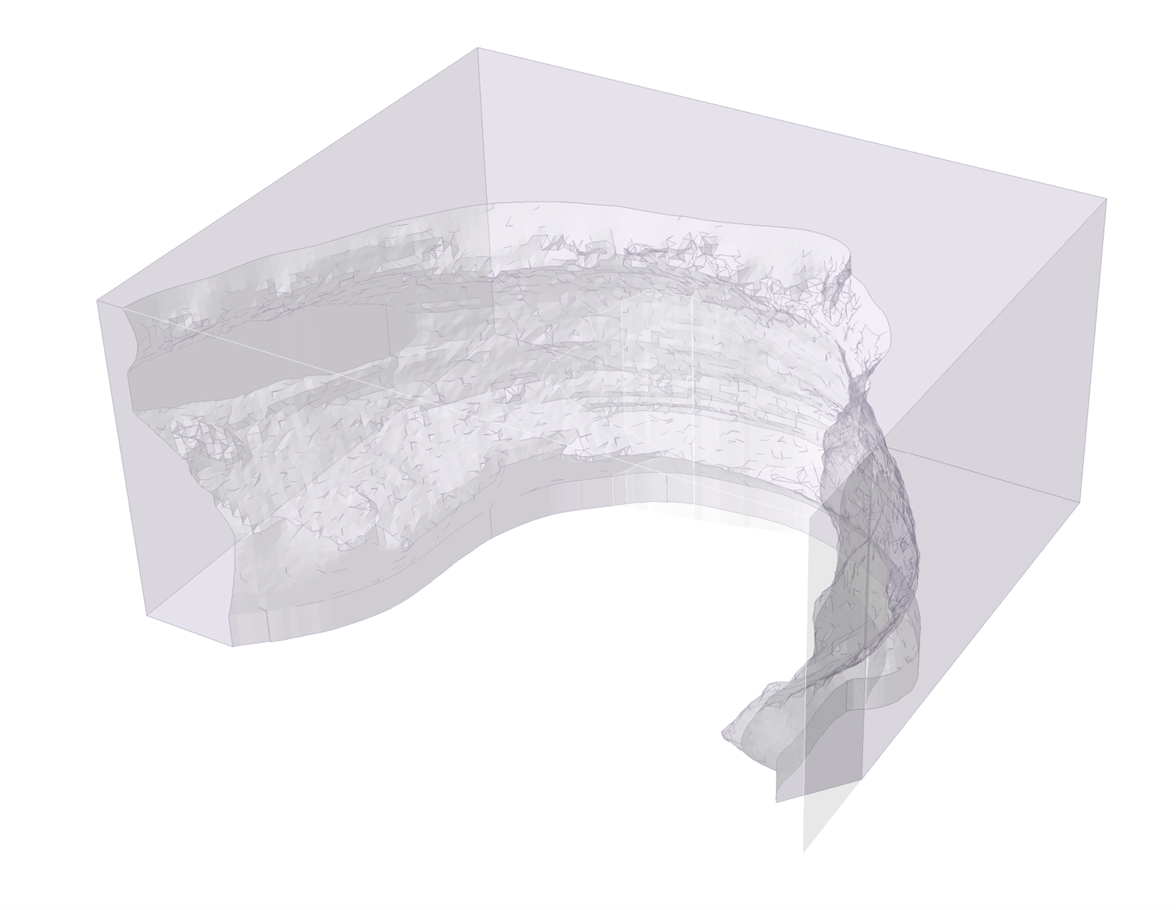
ShapeMetriX and RocSlope3 are closely integrated. The 3D slope surface (.3grs from ShapeMetriX) can be automatically generated into a 3D slope volume on import into RocSlope3. Mapped joints can be imported as geometry surfaces (.dxf) then assigned a joint shear strength; or they can be imported as measured joints given measurements for the dip, dip direction, location, and size, but assuming circular in shape.
RocSlope3 can determine blocks that form from the intersection of joints and use the limit equilibrium method to compute the factor of safety for block sliding, lifting, and falling.
Rockfall Hazard Assessment in RocFall3
Lastly, any areas of instability identified in RocSlope3 or Slide3 can be modelled as area seeders, or origin areas of rockfall, in RocFall3 for 3D rockfall assessment.
The same slope geometry used in Slide3 and RocSlope3 is also interoperable in RocFall3. The attributes of the falling rocks can be obtained from the talus in the field and block volume distributions found in RocSlope3. The rockfall hazard assessment could be used to inform the Hamilton Conservation Authority if any protection measures may be required for this popular tourist site.
3D model construction and geological mapping have become more accessible than ever. We hope this article has shed light on how drone-based 3D modelling and the Rocscience suite can support real-world studies of freeze-thaw erosion and rock slope stability.
For more information about ShapeMetriX, see link below:
The study was also featured in Hamilton’s local newspaper.
Looking to apply a multi-software workflow to your next project?
Start your free trial of any Rocscience product today!
Start Free Trial