Modelling Slope Stability Using Radar Monitoring, Slide3 and RS3
Intense rainfall in open pit mines can rapidly weaken slopes, increasing the risk of deformation and failure. Taking a modern approach to slope risk management, combines real-time monitoring data with advanced numerical modeling to accurately assess stability and enable timely remediation.
The Case Study
A critical slope in a +250 m open pit gold mine began to deform after intense rainfall — triggering a time-sensitive investigation. Using integrated built-in tools in Slide3 and RS3, engineers were able to validate the slope failure mechanism, overlay slope stability radar data, and develop an effective remediation strategy quickly through the seamless modelling ecosystem.
This case study, based on research from A. McQuillan (Rocscience), T. Yacoub (Rocscience), N. Bar (Gecko Geotechnics), N. Coli & L. Leoni (IDS GeoRadar), and S. Rea & J. Bu (Newcrest Mining) shows how combining limit equilibrium and finite element methods allowed the geotechnical team to move quickly from detection to decision, highlighting Rocscience’s powerful interoperability for real-world slope risk management.
The Geological Setting
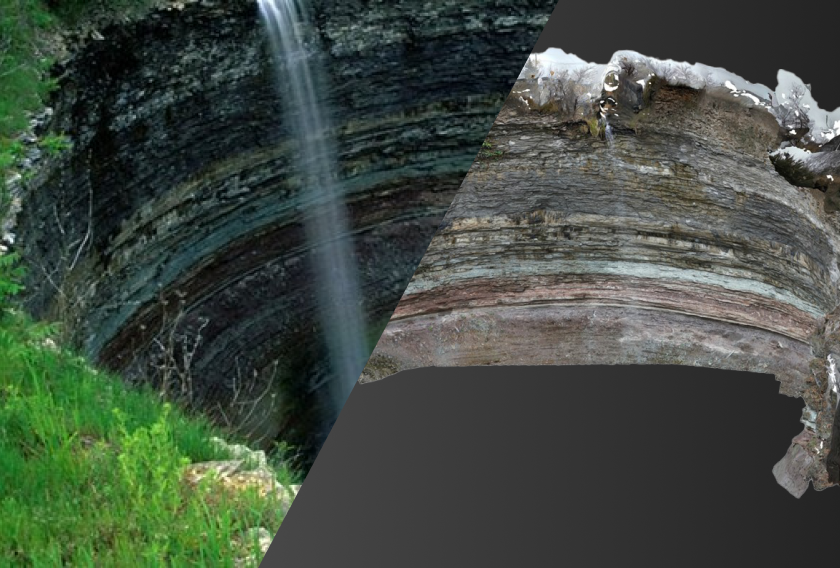
The project site was a highwall cutback at an open pit gold mine in Papua New Guinea, where a series of benches were excavated into a highly anisotropic, argillic-altered rock mass. A relic fault dipping gently toward the pit interior, overlain by saturated colluvium, defined the primary geological hazard. The slope height is 250m, with variable lithology and joints trending nearly parallel to the slope face — conditions known to complicate failure mechanism and groundwater control.
The Research Challenge
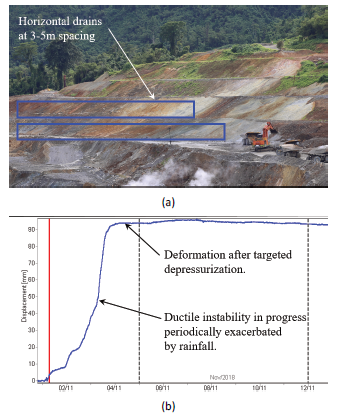
Following several consecutive days of heavy rainfall, slope movement was recorded by an IBIS-FM synthetic aperture radar (SAR) system positioned on the crest of the pit. The radar detected fluctuations in displacement and velocity, suggesting progressive failure. Visual inspections, both on foot and via UAV, revealed open tension cracks up to 50 cm wide at the crest — and pore pressure data from vibrating wire piezometers confirmed the slope was fully saturated.
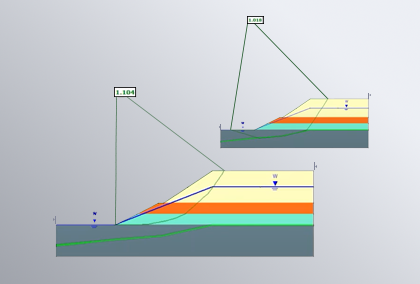
Initial 3D limit equilibrium models built in Slide3 estimated a critical factor of safety (FS) of 1.49, assuming dry conditions. However, given the evidence of rainfall infiltration, saturation, and progressive movement, a more detailed model incorporating hydraulic effects and real-time deformation data was urgently needed.
The challenge was not just to confirm the suspected failure mechanism, but to guide remediation — and do so in a format robust enough to support confident engineering decisions.
The Solution
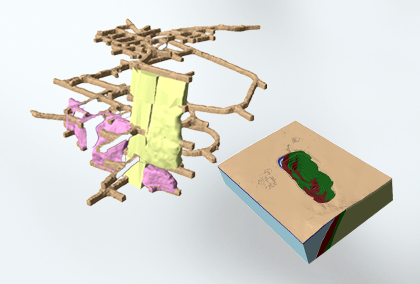
The team used Slide3 to rapidly construct an updated 3D limit equilibrium model of the slope. Geological wireframes, surveyed topography, and mapped faults were imported directly into the software. Pore pressure conditions were updated based on piezometer readings, and the model geometry was adjusted to account for new deformation zones observed in the field.
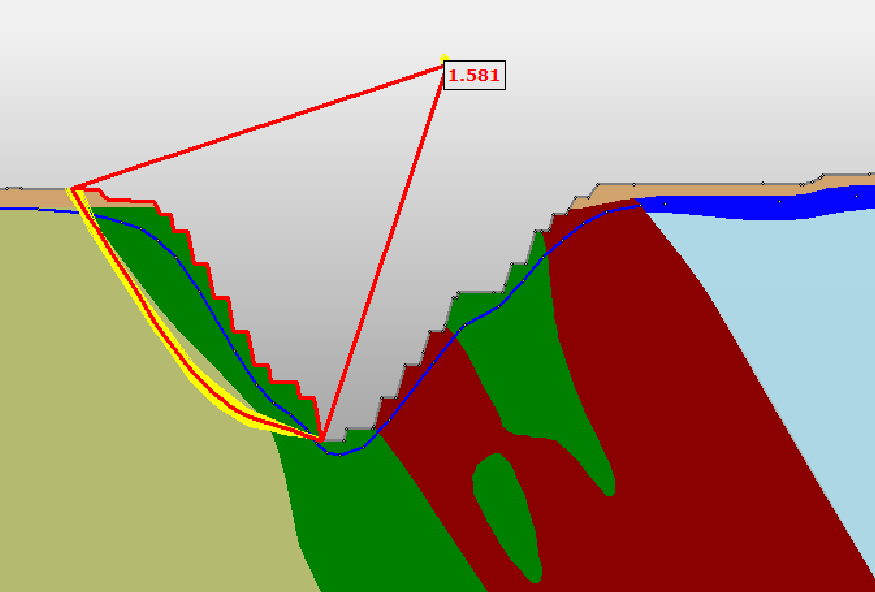
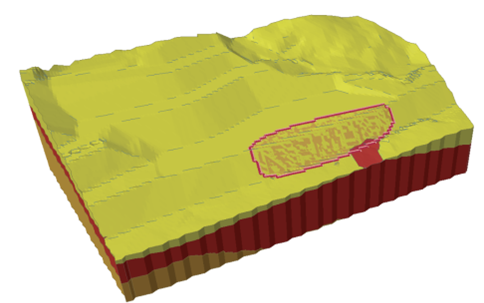
This updated Slide3 model returned a revised FS of 1.03, with the critical failure surface aligned along the low-angle relic fault plane beneath the saturated colluvium. While this confirmed the slope was approaching instability, it did not provide insight into how the slope might deform, nor did it allow for direct analysis of stress redistribution under remedial conditions.
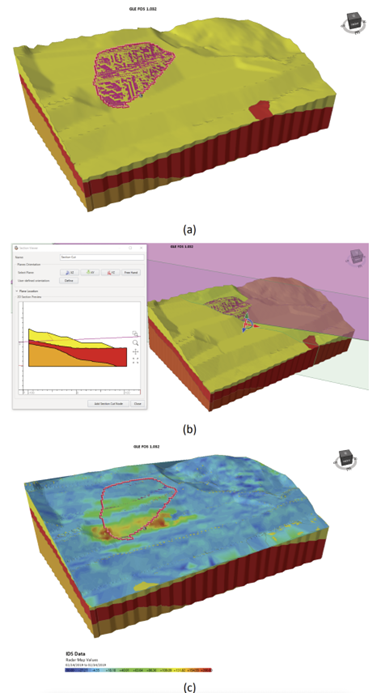
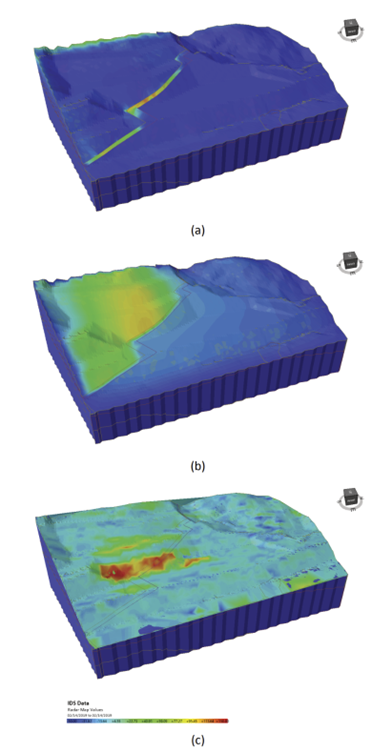
To address this, the same model geometry and input data were imported into RS3 for finite element analysis. In RS3, the team applied a Shear Strength Reduction (SSR) method to evaluate global stability under fully saturated conditions. The SRF dropped to 0.92, with deformation and shear strain localizing along the same fault zone identified in Slide3.
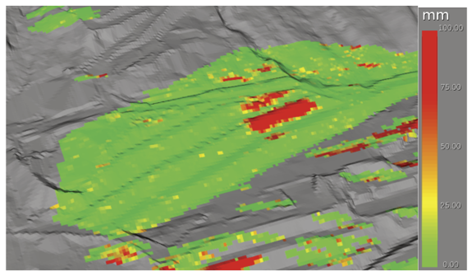
Crucially, IBIS-FM slope stability radar data was overlaid directly onto both the Slide3 and RS3 models. The deformation patterns recorded by the radar matched the predicted slip surfaces and displacement fields with high fidelity, validating both the modelling assumptions and the back-analysed material parameters.
The Results
With the failure mechanism clearly identified and validated, the team ran multiple remediation scenarios using both Slide3 and RS3. These included:
- Depressurization via horizontal drains: Over 50 horizontal boreholes, each 150 m long and spaced 3–5 m apart, were drilled from the pit floor into the faulted zone.
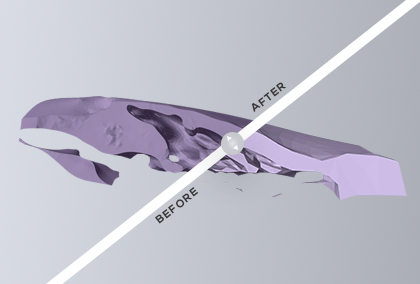
- Slope unloading: A 12 m thick layer of colluvium was removed from the slope crest to reduce driving forces.
- Surface water management: Diversion channels were added to prevent infiltration along the upper slope.
RS3 models captured the stress redistribution and shear strain reductions resulting from the horizontal drains, while Slide3 offered fast re-evaluation of FS under updated pore pressure conditions — allowing the team to iterate efficiently between design options.
The Verdict
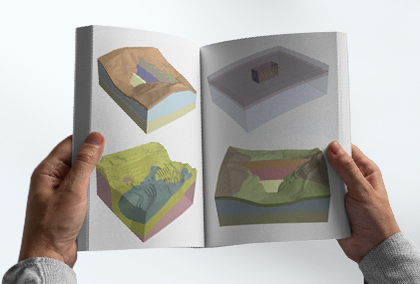
This case highlights the advantages of a fully integrated 3D geotechnical modelling workflow, where Slide3 and RS3 work in tandem. Slide3 provided fast identification of critical slip surfaces under updated field conditions, while RS3 enabled deep insight into how the slope would deform and respond to remediation.
The ability to import geometry and material properties across platforms, overlay real-time slope stability radar data, and rapidly compare stabilization scenarios allowed the team to act with precision under pressure.
For mining engineers managing high-risk slopes, Rocscience’s interoperable ecosystem is both a modeling tool and a platform to help you make better decisions.
Ready for detailed 3D insights into your projects?
Start your free trial of Slide3 or RS3 and see how integrated 3D slope modelling can transform your workflow.
Try it now!