Revealing Hidden Failure Mechanisms in Heap Leach Pad Stability with 3D FEM Analysis
- Alison McQuillan, VP, Mining at Rocscience
Heap leach pads are constructed in stages, but their stability is governed by more than the geometry visible in a typical 2D section. Foundation inclination, slope curvature, material interfaces, and interactions between individual lifts can all influence how instability develops.
Kazakhstan's Aktogay copper mine has operated its Heap Leach Pad (HLP) year-round since 2015, using heated leaching solution delivered through insulated pipes to withstand summers past +40°C and winters to -40°C. Stage 1 went up in five 13 m lifts to roughly 65 m, with excellent slope performance and minimal settlement of the placed rock fill. Stage 2 would add two more tiers – reaching 91 m overall while easing the slope angle from 23° to 20°.
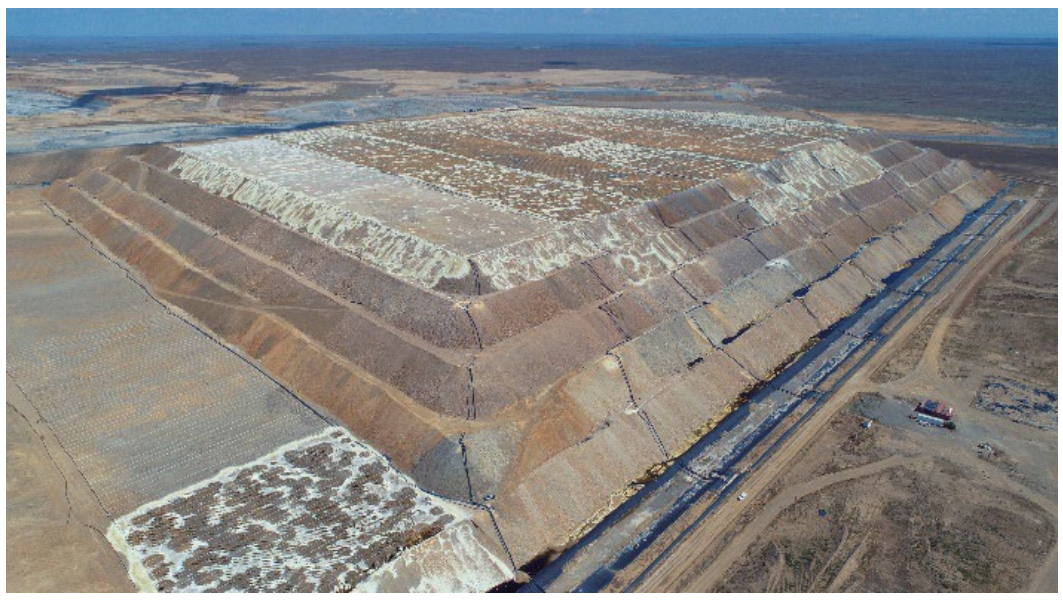
The engineering question was therefore not simply whether the expansion was stable. It was whether the analysis methods being used could adequately capture the mechanisms governing stability in a large, three-dimensional heap leach structure.
A geotechnical assessment by Gecko Geotechnics, KAZ Minerals, and TRE ALTAMIRA compared 2D and 3D Limit Equilibrium Method (LEM) and Finite Element Method (FEM) analyses using Slide2, Slide3, RS2, and RS3, alongside survey-prism and satellite InSAR monitoring of the existing pad. What they found not only settled whether Stage 2 was stable, but also showed that different modelling approaches can return materially different stability margins — and identify entirely different failure mechanisms.
The Engineering Context: A 91 m HLP on an Inclined Foundation
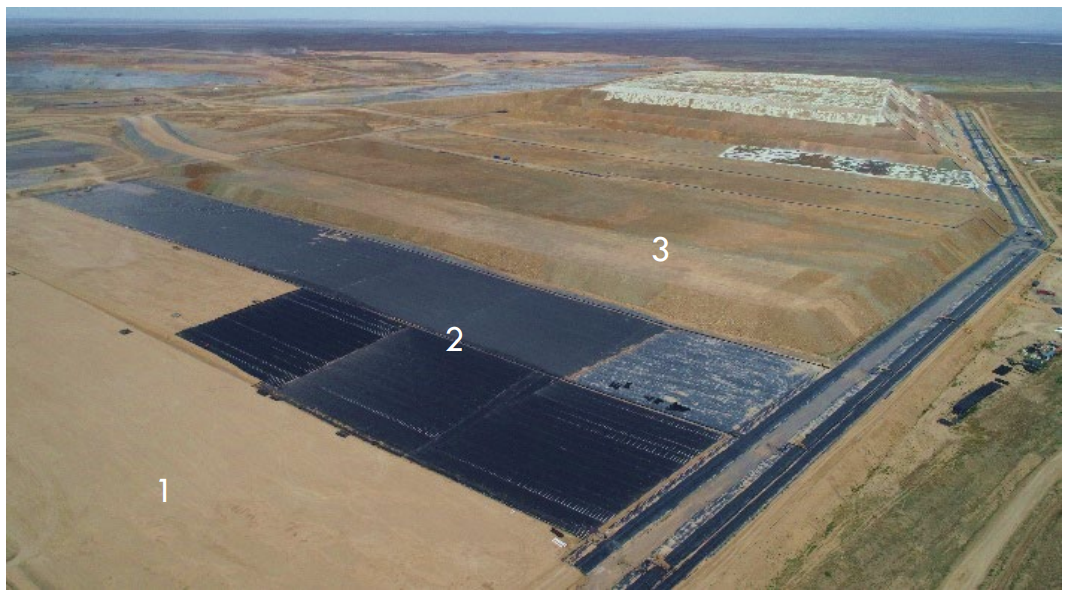
The Aktogay HLP foundation is relatively uniform and nearly flat but slopes approximately 7° to the south – a modest inclination that would prove significant later in the analysis. The HLP was constructed over an engineered fill base, clay underliner, textured LLDPE (liner low-density polyethylene), and coarse overliner before oxide ore rock fill was placed in lifts up to 13 m high.
This construction sequence is important to the stability assessment because the liner system creates a potential weak interface beneath the rock fill.
Large-scale direct shear testing characterized the liner interface under loading conditions representative of the future HLP. The lowest measured interface strength was:
- Peak: c′ = 0 kPa, φ′ = 19°
- Residual: c′ = 18 kPa, φ′ = 11°
These interface properties were incorporated into the numerical models, with the residual soils, engineered fill, clay underliner, LLDPE, and gravel overliner represented as weak interface layers.
Existing Performance Provided the Field Baseline
Before assessing the expansion, the team checked how the existing Stage 1 pad was actually behaving, using survey prisms and seasonal satellite InSAR.
Both monitoring systems indicated low-velocity, constant, or decelerating deformation: consistent with stable conditions and low risk. Maximum vertical displacement reached 175 mm/year on the northern side, while east-west displacement generally stayed below 30 mm/year, concentrated near the upper lifts. That pattern reads as settlement from rock fill compaction under load, not progressive instability; no accelerating trends were observed anywhere on the pad.
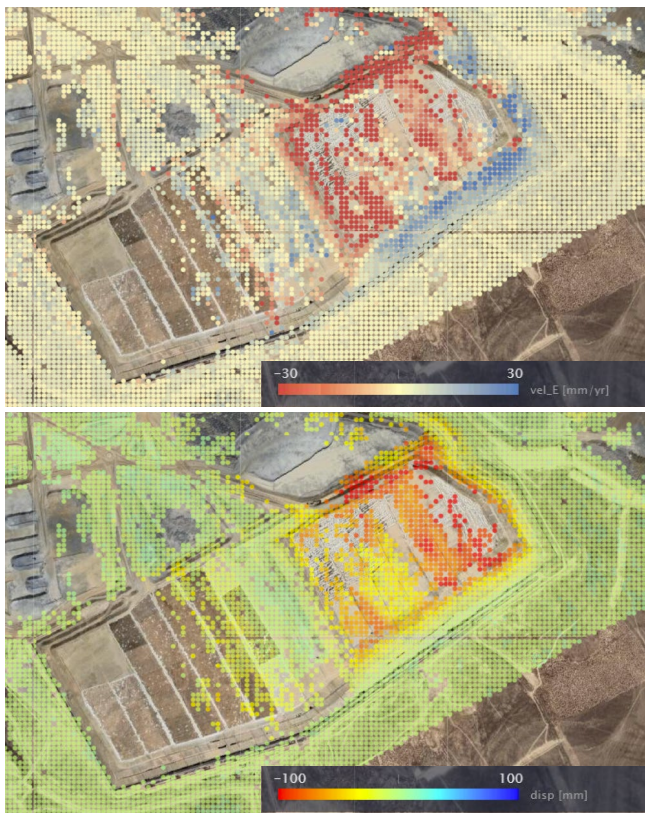
This gave the numerical models an important field reference before Stage 2 was even modelled: the existing pad was deforming under load exactly as expected, not showing early signs of failure.
One Geometry, Four Analysis Methods
The study developed a common 3D model representing the approximately 2.0 km × 0.9 km HLP footprint. The numerical model extended approximately 2.8 km in the NE-SW direction, 2.0 km in the NW-SE direction, and 0.3 km in depth. Slide3 ran the 3D limit equilibrium analysis; RS3 ran the 3D finite element analysis. Slide2 and RS2 sections were derived directly from that same geometry for 2D comparison, so every result that follows compares the same slope, the same material properties, and the same groundwater assumption. Groundwater was conservatively modelled 0.5 m above the LLDPE rather than at the base of the weathered rock.
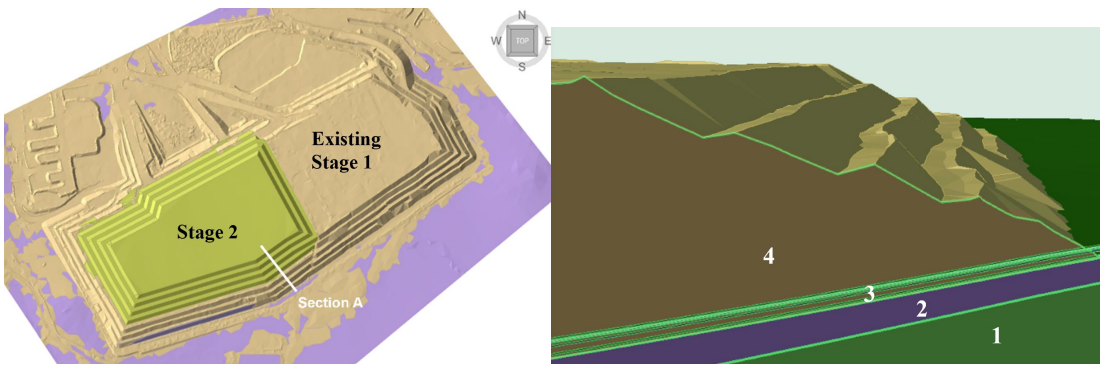
LEM analyses used non-circular slip surfaces in 2D and ellipsoidal surfaces in 3D, letting Slide2 and Slide3 combine shearing through the rock fill with sliding along the discrete LLDPE interface. What followed was a direct comparison of the same engineering problem across four analysis methods.
Limit Equilibrium: 2D vs 3D
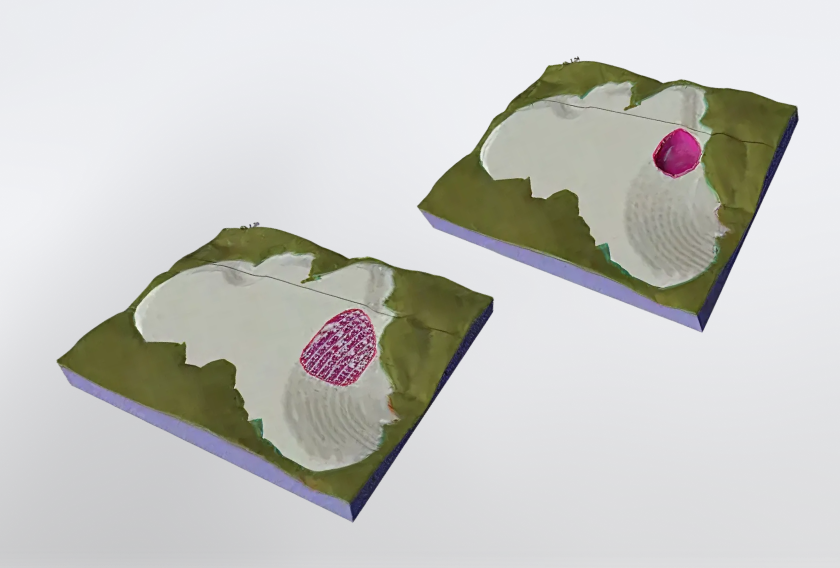
Both LEM approaches found the overall HLP slope stable, with factors of safety (FoS) above 2.00. But the 3D analysis returned a lower FoS number and caught something the 2D section couldn't: a mildly convex, or bullnose, slope profile.
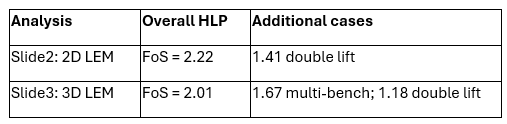
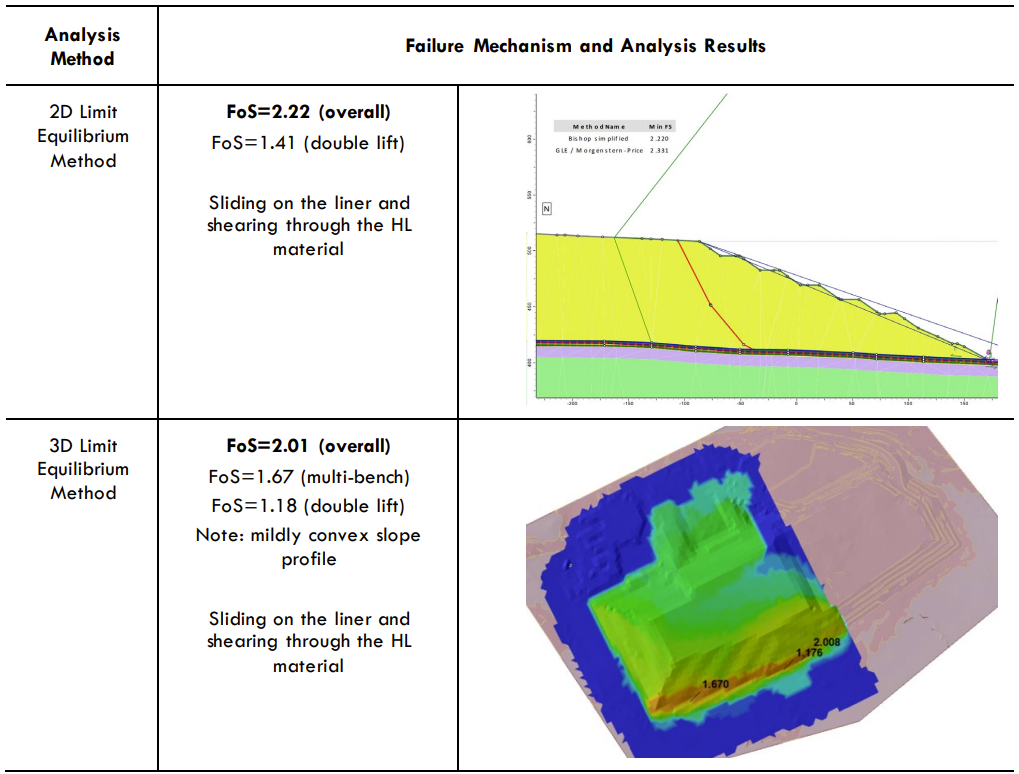
For the overall slope, 2D LEM overestimated FoS by more than 10% against 3D LEM. Both approaches agreed on the failure mode – sliding along the liner, shearing through the rock fill. But only Slide3 could account for the bullnose geometry driving that lower number.
FEM Reveals the Failure Mechanism
Comparing LEM against FEM, using shear strength reduction, exposed something more fundamental than a geometry effect.
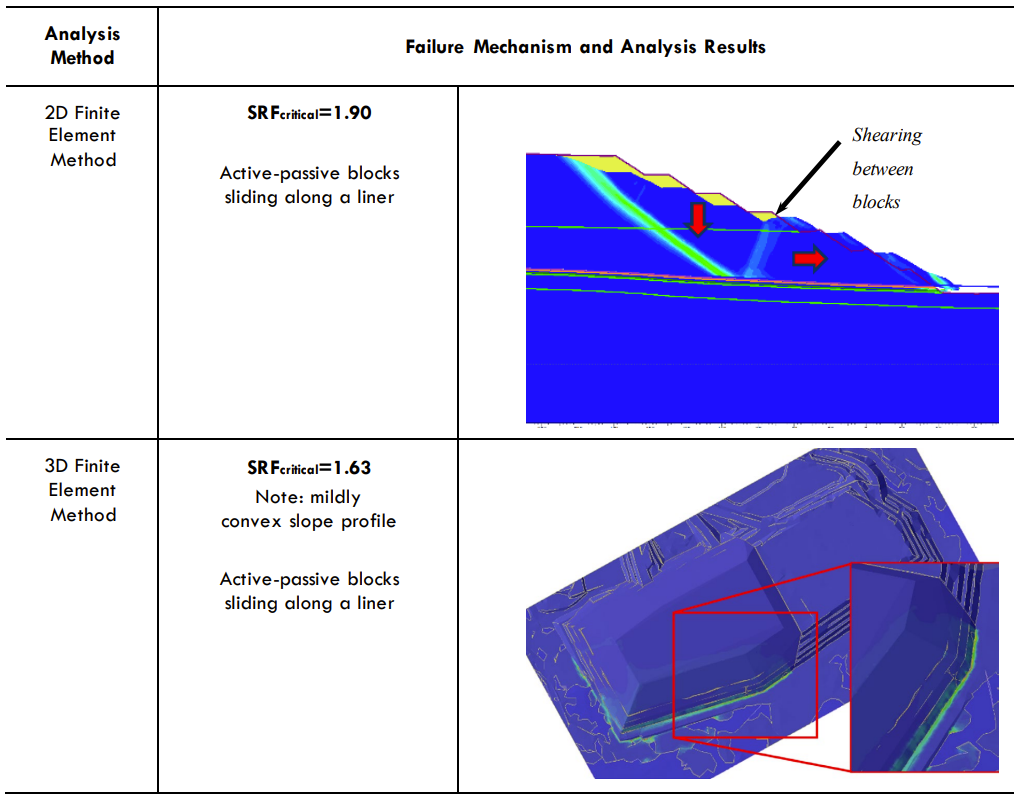
2D FEM overestimated FoS by more than 15% against 3D FEM, but the bigger story wasn't the number. RS3 identified an active-passive block failure: rock fill lifts forming an active block that drives a wedge downward, mobilising a passive block to slide along the clay underliner/LLDPE interface, with distinct shearing between the blocks. Slide2 and Slide3, built on limit equilibrium, can only simulate sliding on the liner and shearing through the rock fill — they cannot represent active-passive blocks at all. Wherever that mechanism governs, LEM's factor of safety ran up to 23% higher than FEM's.
The analysis method didn't just change the factor of safety. It changed what failure looked like.
Foundation Angle Changes the Failure Mechanism
A conceptual 2D FEM study (a simplified 90 m HLP with a 24° slope angle) tested how foundation inclination alone shifts the failure mode. Below 5°, the mechanism stayed simple: sliding along the liner and shearing through the rock fill. Above 5°, it shifted to active-passive blocks, and SRFcritical kept falling as the foundation steepened: from 1.58 at 0° to 1.31 at 20°.
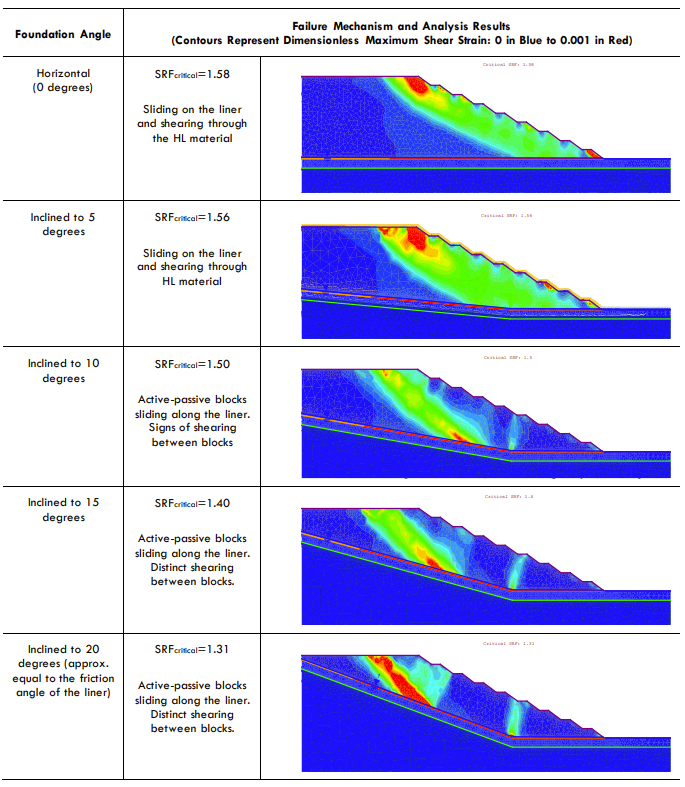
Aktogay's own 7° foundation sits just inside that threshold. The paper is careful to caveat that these are simplified 2D results, which could themselves overestimate SRFcritical wherever convex geometry or varying foundation inclination is present; exactly the conditions the Aktogay 3D model was built to capture directly.
A More Complete View of HLP Stability
The Stage 2 expansion was found to be feasible. Both 2D and 3D FEM found the overall slope stable above 1.50, and every method agreed the planned lifts are more stable than the existing ones, consistent with their shallower slope angle.
But the gap between methods was substantial: Slide2's 2D LEM result of FoS = 2.22 ran more than 35% above RS3's 3D FEM result of SRFcritical = 1.63. To illustrate why that matters, the paper poses a hypothetical: if a project's Design Acceptance Criterion required a minimum FoS of 1.30 – not Aktogay's actual criterion, just an illustration – a 35% overestimation could mean the real factor of safety sits below 1.00. That's not a claim about Aktogay's pass/fail status. It's a demonstration of what relying on the wrong method can cost you. Such costs or consequences may be evidenced by recent heap leach failures in Canada and Türkiye.
None of this makes 2D analysis obsolete. It's the fastest way to screen a design, and Slide2 and RS2 agreed with their 3D counterparts everywhere the geometry was simple enough for a 2D section to hold up. The limitation matters specifically where three-dimensional geometry, foundation inclination, and complex failure mechanisms are actually governing stability – which is exactly what a 3D model is built to check.
From Factor of Safety to Failure Mechanism
The Aktogay assessment demonstrates the value of examining the same engineering problem through complementary numerical methods.
Slide2 and Slide3 quantified how three-dimensional geometry changes the calculated factor of safety. RS2 and RS3 went further, revealing the active-passive block mechanism and the role of the rock fill/liner interface that LEM cannot represent at all. Because the 2D models were derived directly from the 3D geometry, the comparison held the engineering problem constant and varied only the method.
Combined with interface testing and InSAR monitoring, the result was a complete picture: the existing pad was settling, not failing; the expansion was feasible; and the governing question wasn't only the factor of safety – it was whether the analysis could see the mechanism behind it.
For complex heap leach facilities, 3D FEM analysis isn't about adding another dimension. It's about seeing the failure mechanism the section cannot.
References
Bar, N., McQuillan, A., Zlobin, G., & Meloni, F. (2025). Criticality of 3D Numerical Modeling for Assessing Heap Leach Pad Stability and Integration with Monitoring Data, Including InSAR. Proceedings of Heap Leach Solutions 2025, Sparks, USA, pp. 223–238.
Run Your Own 2D-to-3D Comparison
Try Slide3 and RS3 alongside Slide2 and RS2 to see whether your 2D section is telling you the whole story.
Start Your Free Trial