Modelling the Stability of a 115 m Filtered Iron Ore Tailings Stack Using Slide3
Following the catastrophic tailings storage facility (TSF) failures in Minas Gerais, the industry faced a reckoning. Brazil’s regulatory landscape changed overnight with the prohibition of upstream dams. The industry responded by redesigning its waste strategy from the ground up; literally. Mining could continue, but only with disposal methods capable of standing firm under the region’s intense rainy seasons and complex terrain.
Filtered Tailings Dry Stacking (FTDS) emerged from that transition — not as a convenience, but as a response to a changed regulatory reality.
This study examines one such FTDS design through 3D limit equilibrium analysis. The authors use Slide3 to understand how a tall, multi-bench dry stack performs when its foundation geometry refuses to behave like a textbook plane. Their approach combines high-resolution geology, seasonal tailings behaviour, and realistic water conditions to test stability under peak and post-liquefied material strengths.
Geological Framework: A Foundation That Would Not Stay Flat
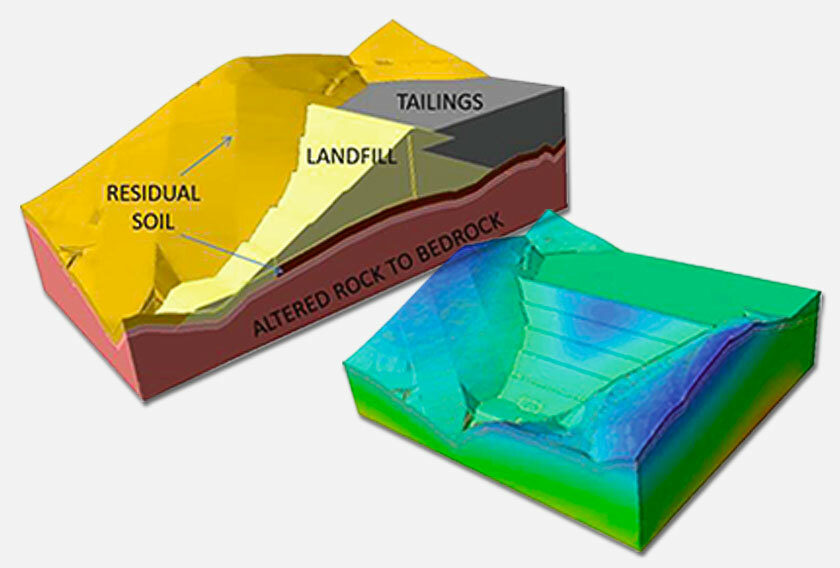
The FTDS lies in the Iron Quadrangle, a region defined by Archaean-Paleoproterozoic geology and long histories of deformation. The authors integrated surface mapping with drilling data to identify the four foundational materials:
- Colluvium
- Residual soil
- Saprolitic soil
- Saprolite
A 3D geological model was then built in Leapfrog, capturing the contacts between these units and the critical n’SPT boundary at 8 strokes — the transition used to define the foundation surface.
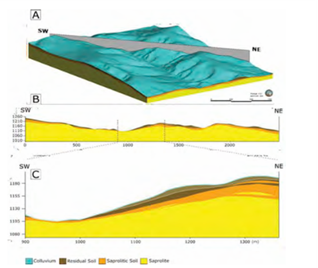
This foundation is steep, irregular, and materially variable. Any slip surface traversing it will form a geometry that cannot be captured reliably in 2D.
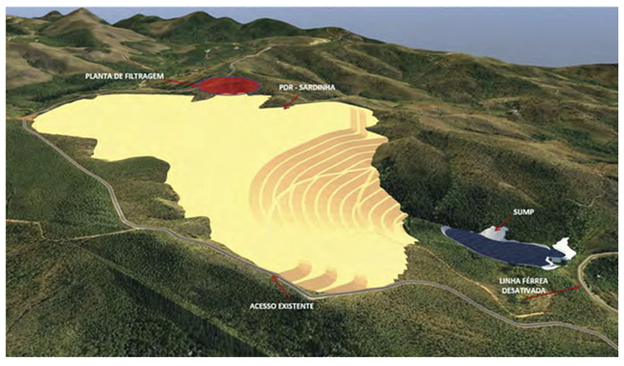
FTDS Geometry: A Large Structure Built for Seasonal Extremes
The stack is substantial: 115 m in height, 62.65 Mm³ in capacity, and designed to operate for 17 years. Its geometry reflects both the waste production schedule and the operational challenges of wet seasons. Bench heights are 10 m, bench widths 8 m, and bench face angles 18°.
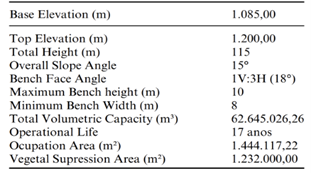
It is engineered to operate through Brazil’s intense wet seasons, where high moisture “off spec” tailings accumulate outside the shell zone.
Model Parameters and Strength Considerations
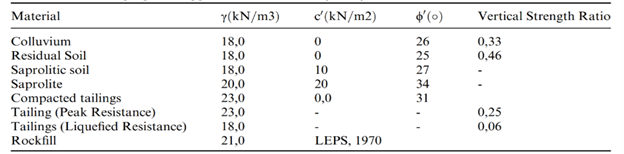
Material properties used for 3D stability analysis are given explicitly in Table 2. The undrained strength of the tailings was derived from Consolidated Isotropic Undrained (CIU) triaxial tests at 85% compaction — selected intentionally as the worst-case scenario. Post-liquefied strengths were also incorporated to simulate “off spec” tailings associated with the rainy season.
A perched water condition was simulated by applying a Ru coefficient of 0.545 to the off spec tailings, consistent with the authors’ characterization of seasonal wet deposition.
This combination of seasonal material states and water pressures is at the heart of realistic TSF assessment.
3D Equilibrium in Slide3
The 3D stability model was built by importing the FTDS geometry from Civil3D software and the geological surfaces from Leapfrog software, which defined the colluvium, residual soil, saprolitic soil, saprolite, and the n’SPT = 8 foundation transition. Material parameters from Table 2 were then assigned to each volume in Slide3.
Failure mechanisms were searched using ellipsoidal, asymmetric slip surfaces with a minimum depth of 5 m, optimized through the Cuckoo Search algorithm. All stability calculations were carried out using the Bishop Simplified method.
Two factors of safety (FOS) were used as the reference benchmarks for evaluating the computed results:
- FOS ≥ 1.3, based on Standard 13 (ANM, 2019) for undrained liquefaction at peak resistance strength.
- FOS ≥ 1.2, based on CDA (2014) guidance for post-liquefaction scenarios, adopted because the Brazilian standard does not specify a value for this case.
Results
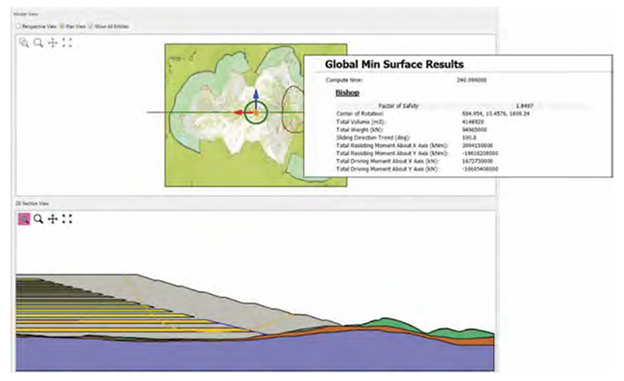
1. Residual Strength Scenario
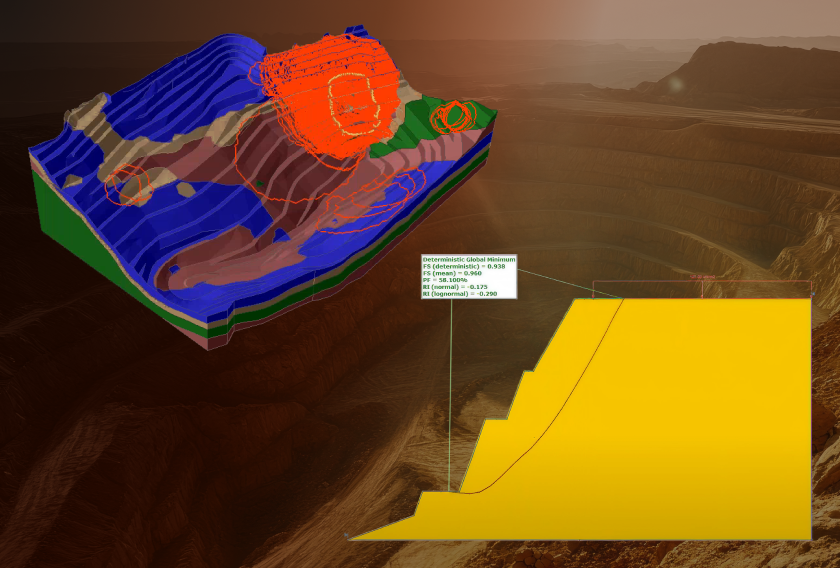
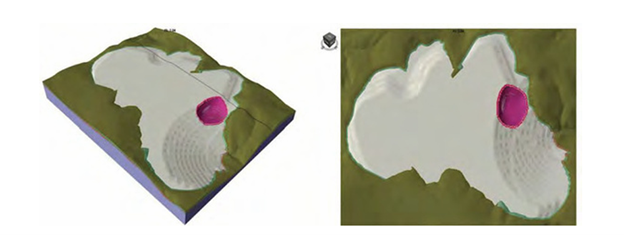
Modelling the “off spec” tailings under residual strength yielded a critical FOS of 1.85. The slip surface interacts strongly with the variable topography and lithological boundaries beneath the stack.

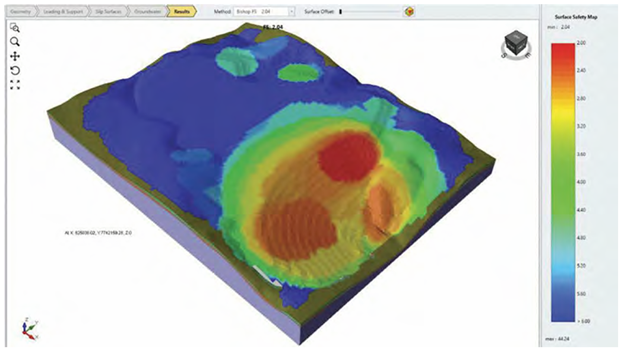
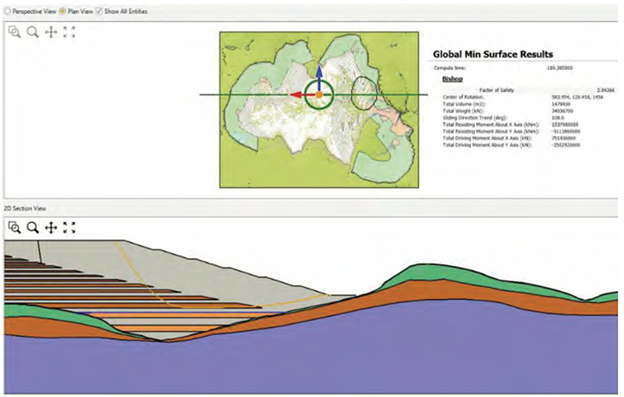
2. Peak Strength Scenario
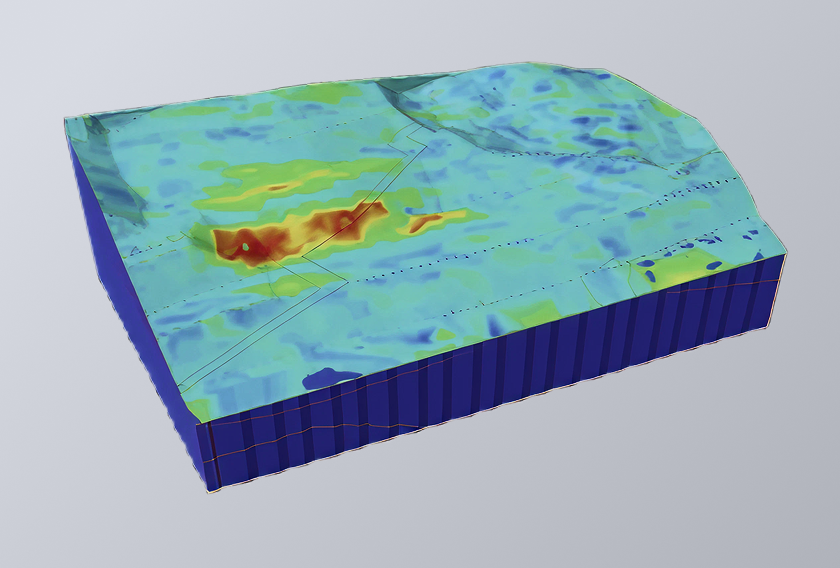
Under peak strength conditions, the critical FOS increases to 2.04. Stability maps show consistently acceptable behaviour across the FTDS footprint.
This dual set of analyses — peak and post-liquefied — validates the structure against both Brazilian and international criteria.
Why 3D Modelling Changes the Story
A central insight from the study is that 3D is not just an enhancement, it is a requirement. The FTDS foundation varies in elevation, stiffness, and geological character across its footprint. Slip surfaces form in response to these variations, producing asymmetrical, spatially complex geometries.
A standalone 2D section cannot anticipate how a slip surface navigates:
- Lithological transitions
- Foundation undulations
- Stacked bench geometry
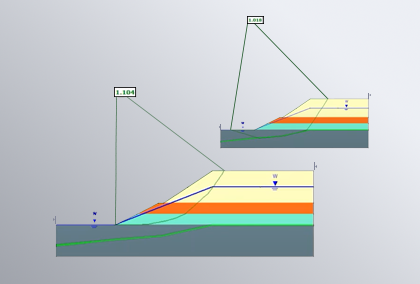
The authors do use 2D sections extracted from the Slide3 model, but only as a diagnostic tool to interpret slip depth and character, not as a design shortcut.
For large, long-life filtered tailings stacks built on irregular terrain, this is the analytic approach that reflects reality.
Conclusion: Designing Stability in a New Regulatory Era
The study concludes decisively:
- The FTDS satisfies all Brazilian and CDA stability requirements under both peak and residual strengths.
- The 3D modelling workflow — built from 3D geological programs into Slide3 and verified with Slide2 — provides a fast, defensible foundation for design.
- Safety maps, slip volumes, and cross-sectional analyses give engineers a multi-angle understanding of risk.
But the deeper value is this: the research shows how filtered tailings stacks can be designed with confidence in a regulatory environment that demands verifiable stability. By using true 3D analysis, the authors model not just the structure, but the terrain and materials that define its real performance.
This is the engineering mindset that geotechnical practice is moving toward: solutions built from the ground up, supported by models that understand the ground as it actually is.
Start modelling your own 3D stability problems.
Try Slide3 and experience the full workflow used in this FTDS study.
Start Your Free Trial