Norsand - Fraser River Sand Tutorial
1.0 - Introduction
In this tutorial, we will be importing the experimental data on Fraser River Sand and visual basic solution from the Norsand material model and comparing these two with the simulation results from RSData.
Topics covered in this tutorial:
- Defining and adding Material Properties
- Defining and adding Test Simulations
- Importing Laboratory Stress Paths
- Editing Graphs
Finished Product:
The finished product of this tutorial can be found in the Norsand-Fraser River Sand.rsdata data file. All tutorial files installed with RSData can be accessed by selecting File > Recent Folders > Tutorials Folder from the RSData main menu.
Want to watch the video version of the tutorial? Check it out here:
2.0 Open the Excel File
This tutorial includes the experimental data and visual basic solution for the Norsand material model.
Go to the Norsand-Fraser River Sand folder located in your Tutorials folder, and open the NorTxlDSS(r8)_FraserRiver_r3.xlsm file in Excel.
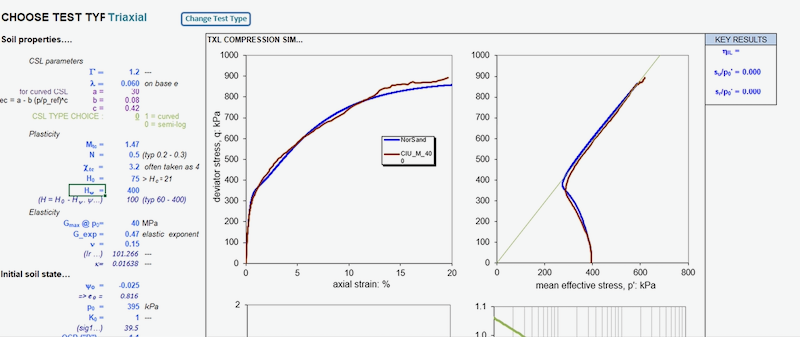
In the Excel spreadsheet, you will see a comparison between experimental data and simulation results using Norsand material model. The material properties and test simulation setup are displayed next to the graphs. The Excel file includes the visual basic code for Norsand material model.
The data shown in this graph shows the undrained triaxial test results for Fraser River sand. The blue line is the results of the simulation and the red line is the results of the experimental data of the Fraser River Norsand.
3.0 Creating the Model
- Launch the RSData program.
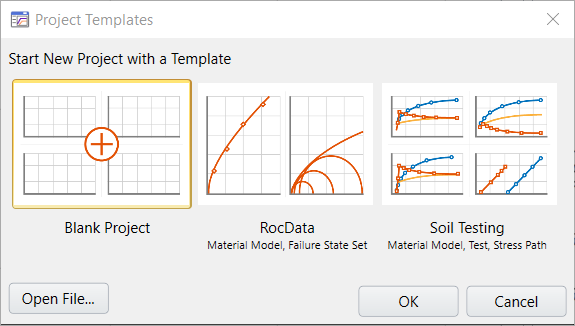
- Select Blank Project for Project template.
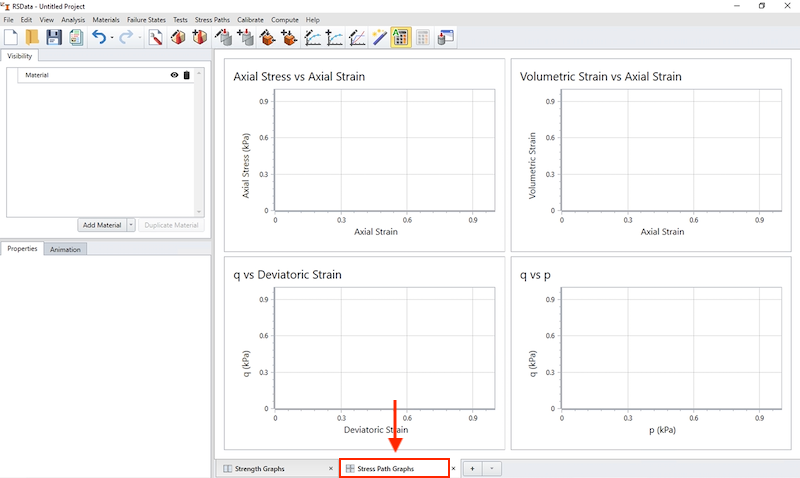
For this tutorial, we will be looking at the stress path graphs. Make sure to select the Stress Path Graphs tab at the bottom of the program.
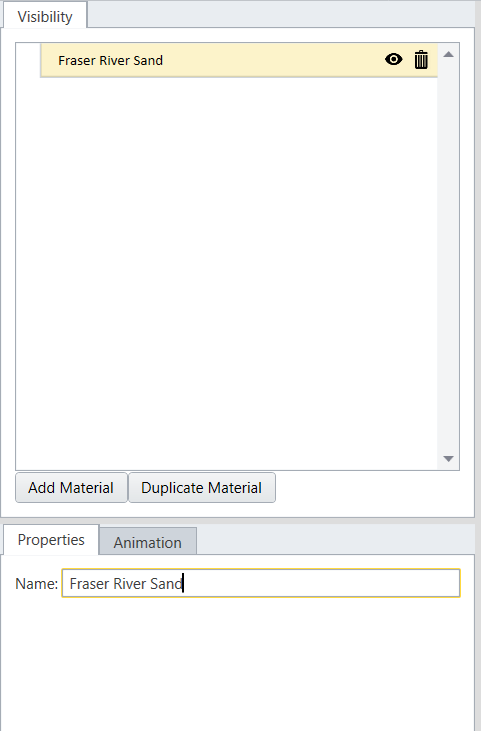
On the left side of the program, you will see the Visibility Tree.
- Select Add Material.
- Name of the material "Fraser River Sand" using the field provided in Properties Pane.
We will then import the experimental and numerical results form the Excel spreadsheet into RSData.
4.0 Stress Paths
4.1 DEFINING THE LABORATORY STRESS PATHS
- Select Stress Path > Define Stress Path in the menu or click on the
 Define Stress Path icon in the toolbar.
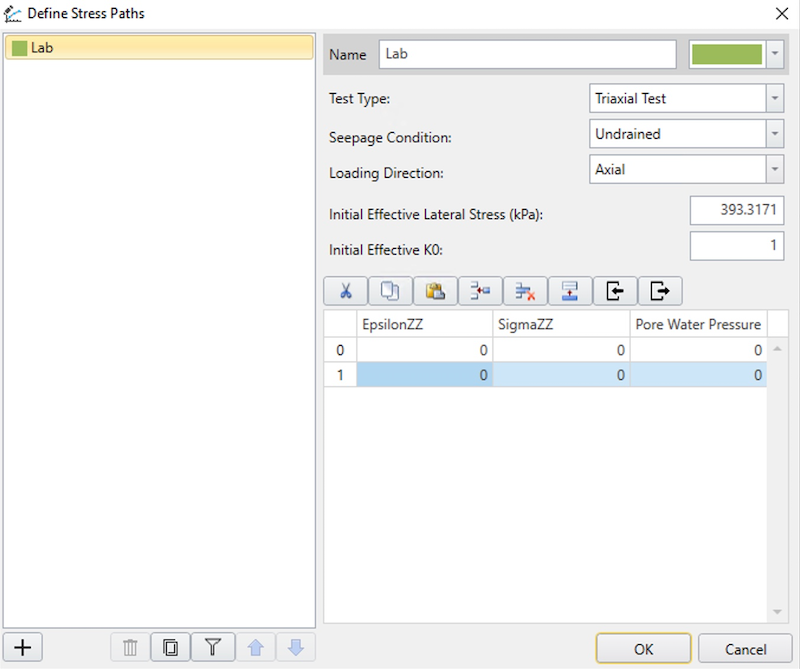
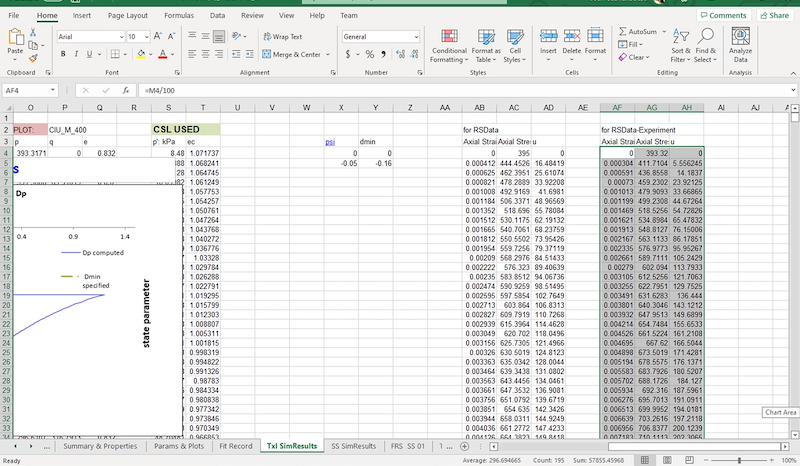
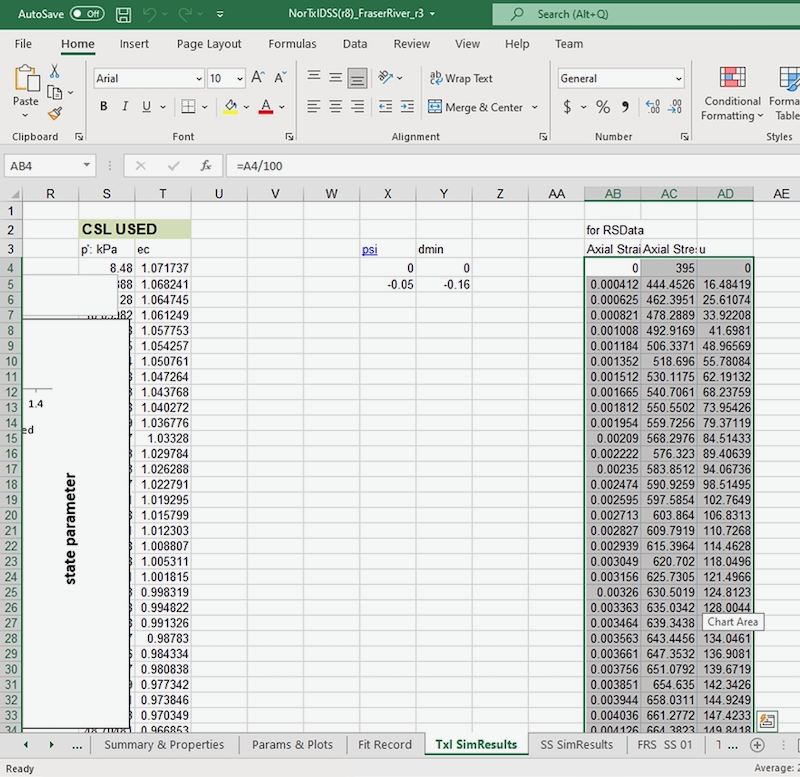
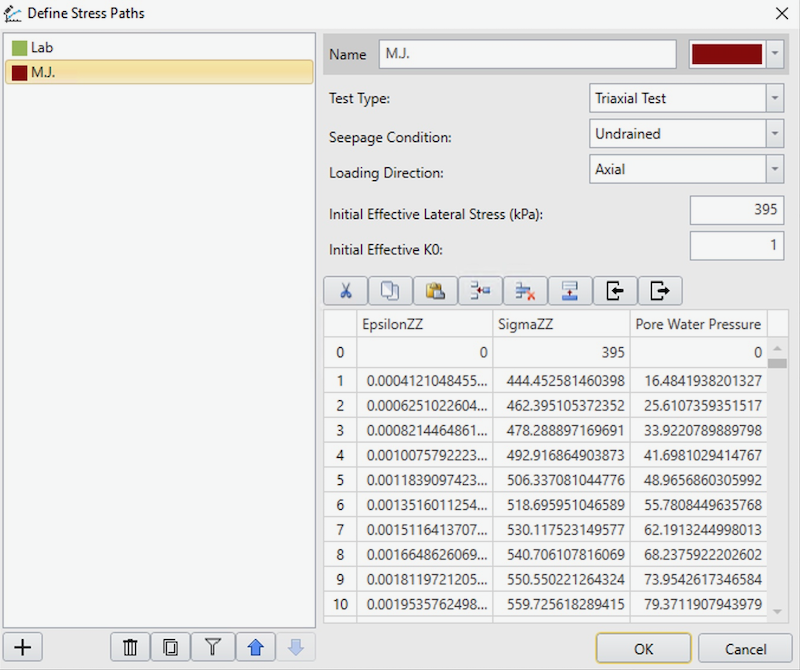
 - The Define Laboratory Stress Paths dialog will appear. Go to Txl SimResults tab in the excel spreadsheet. You will see the axial strain and axial stress for the RSData-experiment tab (AF to AH). Notice that the first initial axial stress is 393.32.
- Go back to RSData and fill in the required data for defining the laboratory stress paths:
- Name = Lab
- Test Type = Triaxial Test.
- Seepage Condition = Undrained.
- Loading Place = Axial
- Initial Effective Lateral Stress = 393.32
- Initial Effective K0 = 1
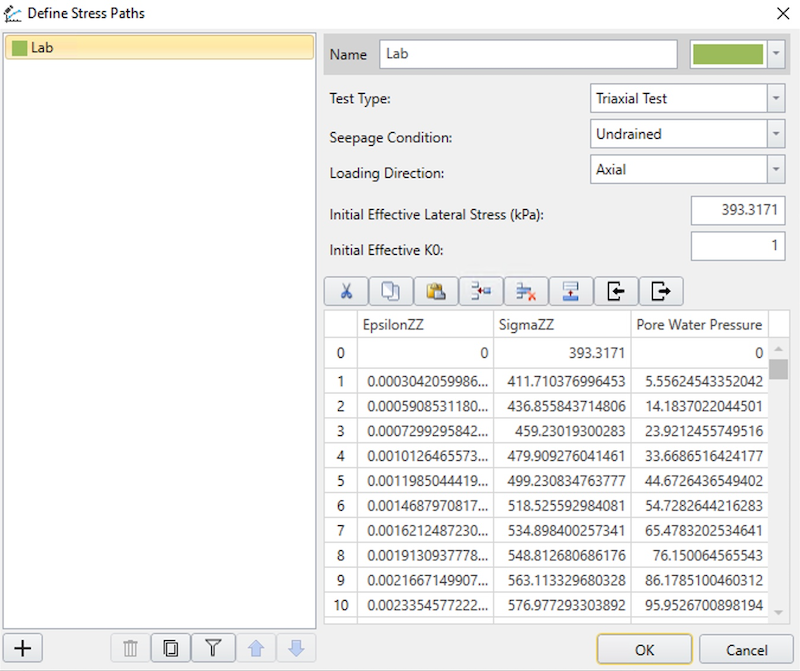
Your dialog should look as shown below:
- Name = MJ
- Test Type = Triaxial Test
- Seepage Condition = Undrained
- Loading Place = Axial
- Initial Effective Lateral Stress = 395
- Initial Effective K0 = 1
4.2 ADDING STRESS PATH TO THE MATERIAL
Now that we have stress paths imported from the spreadsheet, we can assign/add them to the material we have defined in RSData.
- Select
 Add Stress Path.
 - Select both of the stress paths we have defined previously.
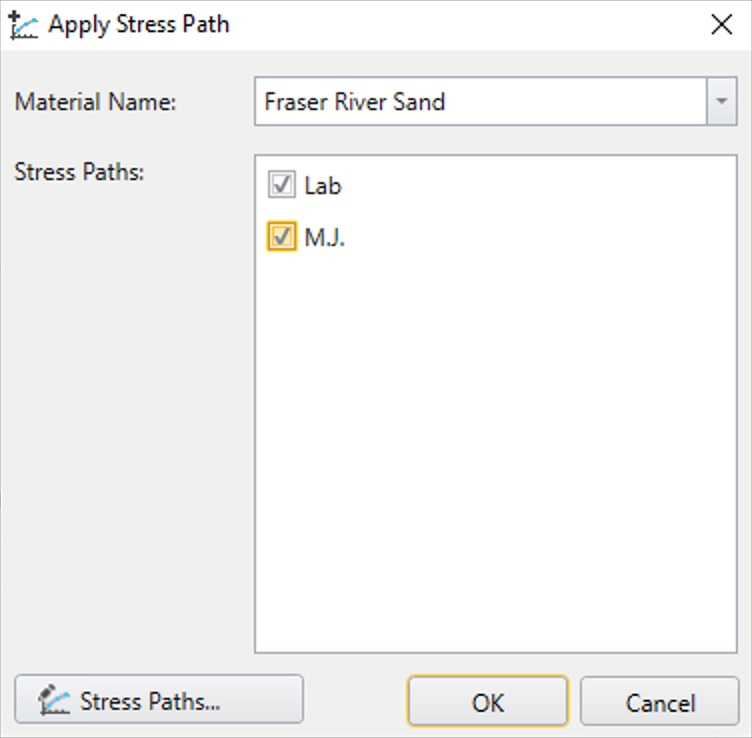
- Click OK.
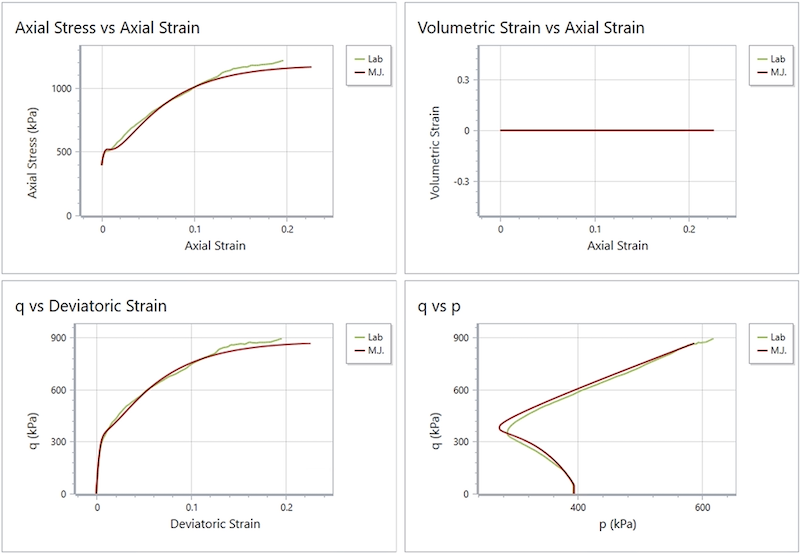
You should now be able to see the two plots (Lab, MJ) as shown below in RSData.
5.0 Material models
5.1 DEFINE THE MATERIAL MODEL
With the stress paths defined for the material, we now define the material constitutive model.
- Select
 Define Material Models.
 - A dialog will appear. Change the name to Norsand.
- Return to the Excel spreadsheet in Params & Plots tab. You will see the soil properties as shown below.
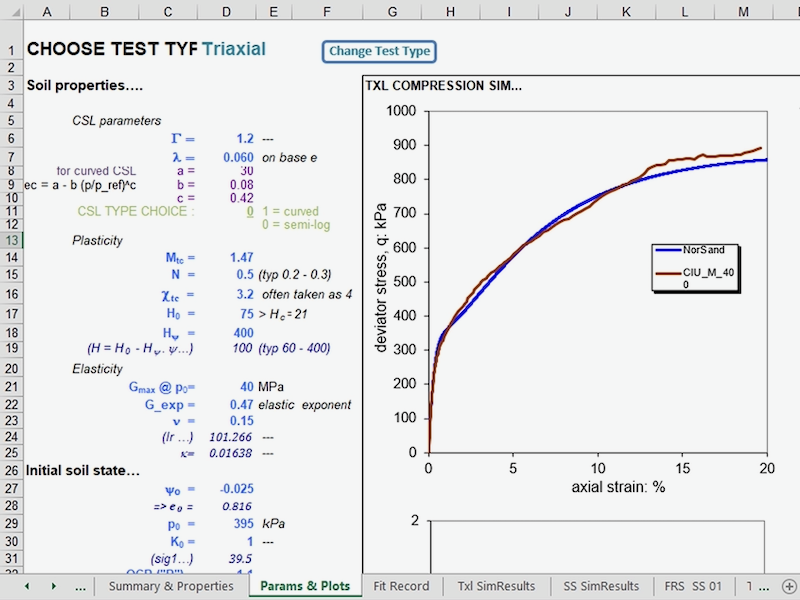
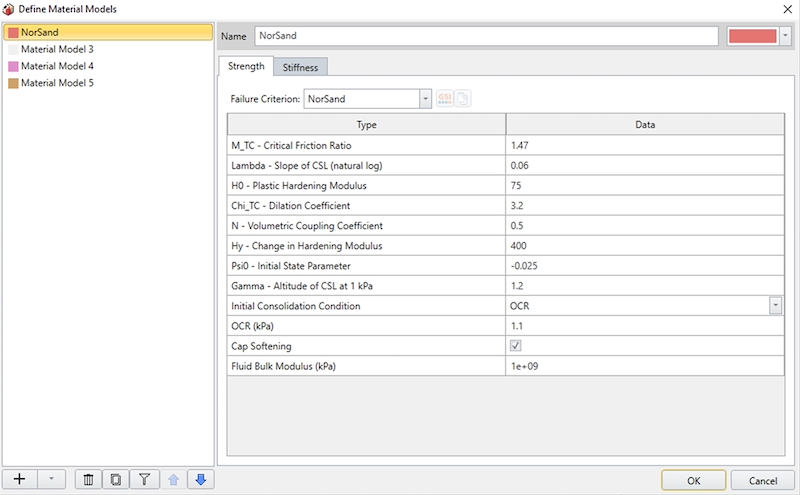
- Return to RSData and enter the following parameters from the excel spreadsheet into the Strength tab:
- Failure Criterion = Norsand
- Critical Friction ratio = 1.47
- Lambda = 0.06
- H0 = 75
- Chi = 3.2
- N = 0.5
- Hy = 400
- Psi0 = -0.025
- Gamma = 1.2
- Initial consolidation condition = OCR
- OCR (kPa) = 1.1
- Select Cap Softening
- Fluid Bulk Modulus (kPa) = 1e+09.
- Shear modulus at reference (kPa) = 40000
- Reference pressure for shear modulus (kPa) = 395
- Modulus exponent = 0.47
- Poisson’s ratio = 0.15
- Minimum Shear Modulus (kPa) = 1
5.2 ADD NORSAND MATERIAL MODEL TO FRASER RIVER SAND MATERIAL
We will now add this material model to the sand material.
- Select
 Add Material Properties.
 - Ensure Fraser River Sand is selected in the drop-down.
- Select NorSand for the material model.
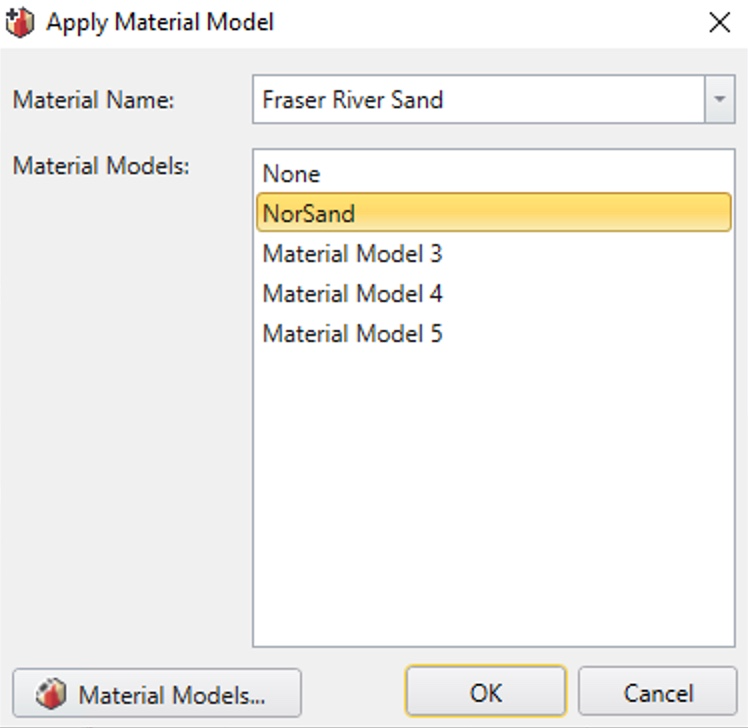
- Click OK.
6.0 Test Simulations
6.1 DEFINE TEST SIMULATION
Now we will make an equivalent triaxial test set up in RSData and add it to our material.
- Select
 Define Test Simulation.
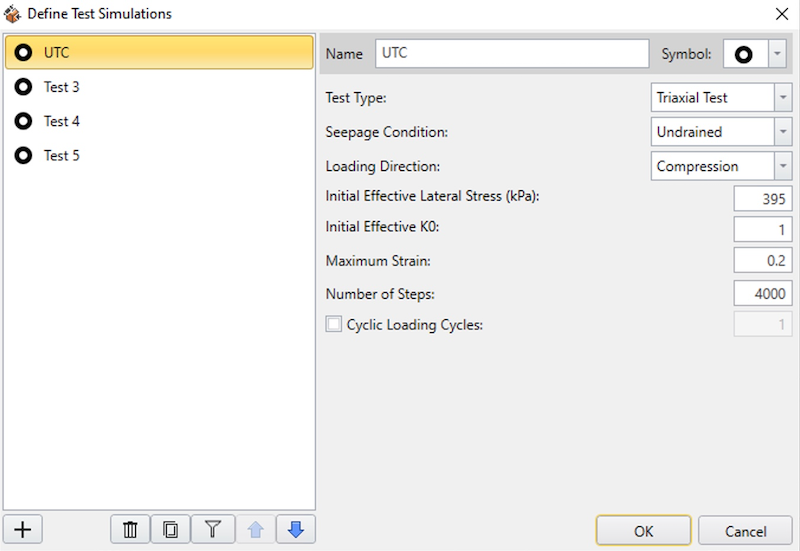
 - Enter the following parameters into the dialog:
- Name = UTC
- Test Type = Triaxial Test
- Seepage condition = Undrained
- Initial effective lateral stress = 395 kPa
- Initial effective K0 = 1
- Maximum strain = 0.2
- Number of steps = 4000.
6.2 ADD TEST SIMULATION
- Select Add Test.
- Make sure Fraser River Sand Material and UTC are selected as shown below.
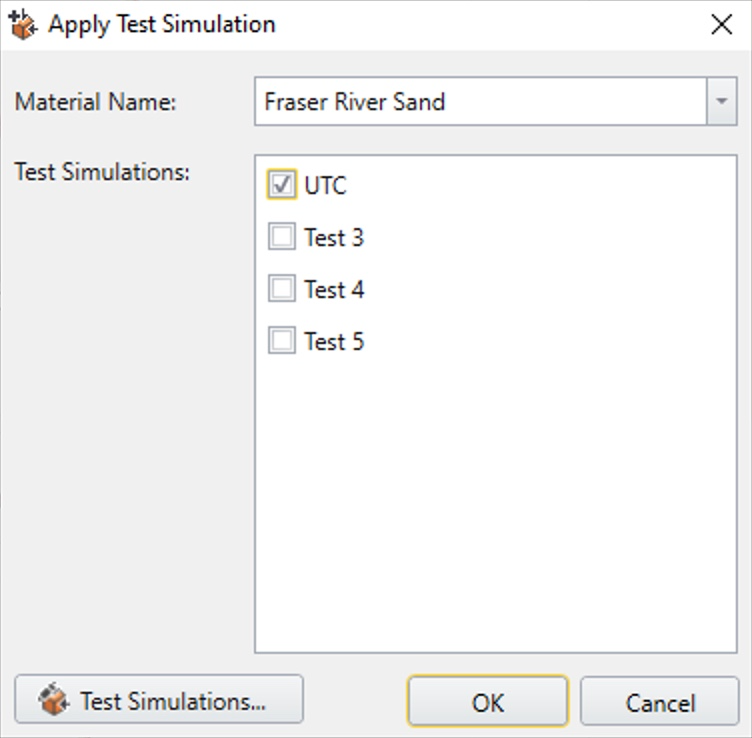
- Click OK.
7.0 Results
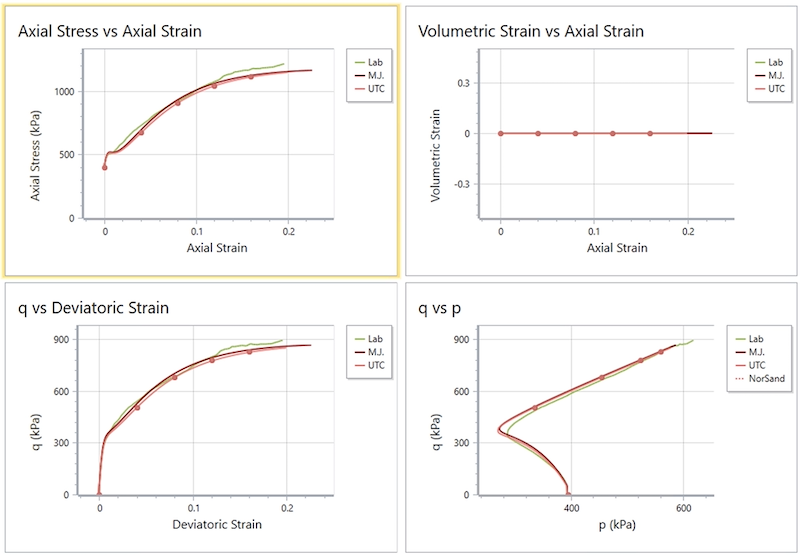
You will see that the UTC line is updated in the graph and it matches well with the experimental and simulation data as shown below.
Now change Volumetric strain of the y axis (top right graph) to Pore water pressure by right clicking on the graph and selecting ‘Edit graph.’
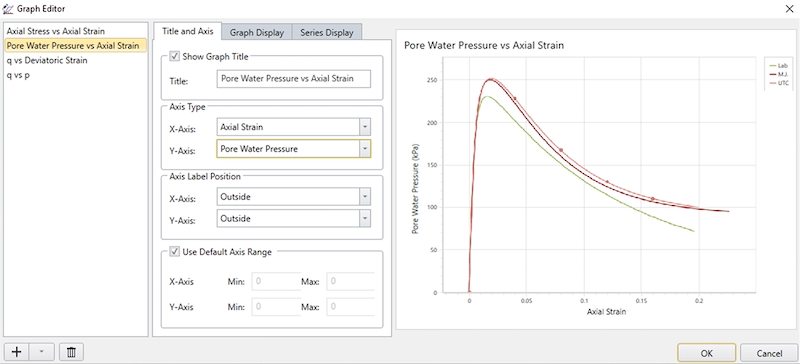
We are making this change because under a triaxial test we don’t need to take a look at volumetric strain, but rather pore water pressure is more important for us to see. You can change the graph axis by changing the Y-axis to Pore Water Pressure as shown above.
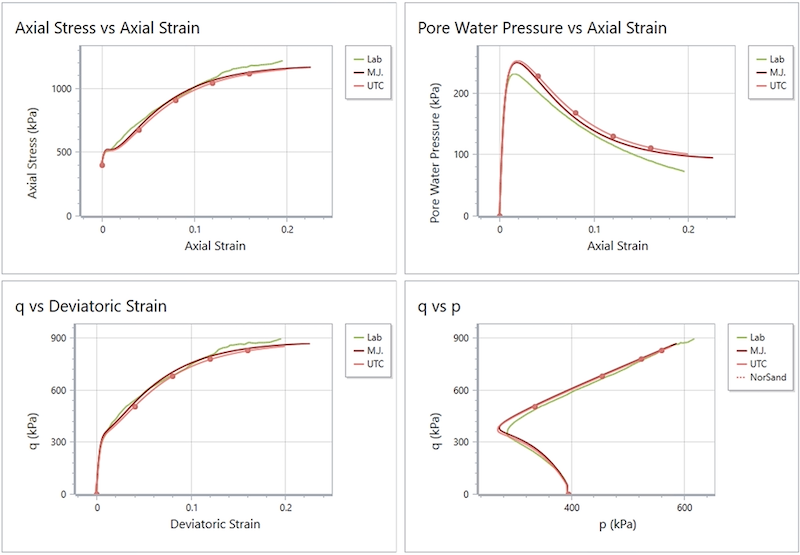
We can see how the results are matching in this graph.
This concludes our tutorial on the Norsand test simulation using RSData.