RS3’s 3D Finite Element Modeling at the Sugar Lake Dam
Since the inception of civilization, water resources have been the highest priority to humans. To prevent water bodies from floods and drought, dams were created and used in several useful ways. Dams have been used for centuries to store drinking water and irrigation, as sources of electricity, as flood control systems, and more. Dams are essential to support advanced infrastructure and it’s extremely important to safeguard them from the risk of overflows or bursts.
This case study is based on a thesis that outlines the unusual fluctuation of groundwater with the reservoir level at the right abutment of Sugar Lake Dam located near Cherryville, British Columbia, Canada. During this research, RS3 was used for creating a finite element seepage model to better understand groundwater flow and facilitate dam safety.
Background of the project area
Sugar Lake Dam is a storage dam that was built upon a cataract of the Shuswap River downstream of Sugar Lake by the Canadian Hydroelectric Corporation back in 1929. Except for the cut-off walls, no special features were incorporated into the dam design to mitigate seepage through the abutments.
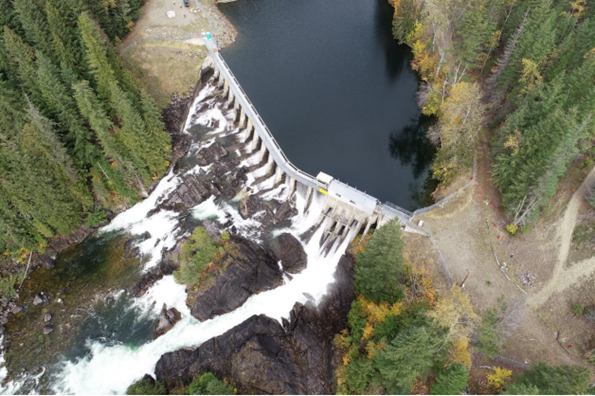
The right abutment of the lake
The right abutment of the dam is located at the top of an old river terrace at an elevation of approximately 605 m, which is almost 20 m above the river level at the dam site. When the dam was being constructed back in 1929, the depth was low and there were some impermeable materials present below the reservoir level.
It wasn’t until 1942 that the water level was elevated, exposing the impermeable material to the reservoir. Seepage was overlooked at the right abutment between 1974-1978 until the running water string was found. At the same time, a sinkhole was also discovered with the sign of enlargement.
Piezometer and reservoir data evaluations
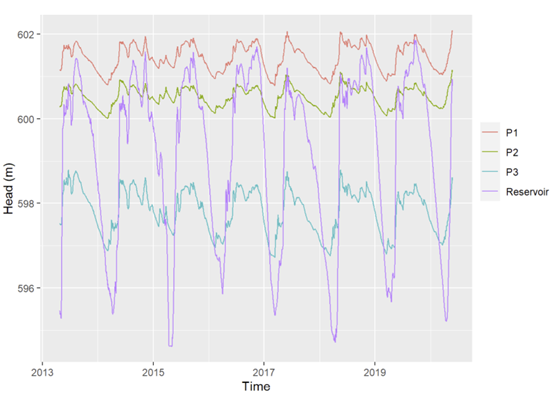
The instrumentation data on the reservoir and piezometric levels were reviewed before being included in the seepage modelling. Instrumentation included the reservoir level gauge, the onsite rain gauge, and the right abutment piezometers. Elevations higher than the reservoir level were spotted in the piezometer readings that were installed in 2013. Further, statistical analyses were conducted based on the piezometer, reservoir, and rain gauge data obtained from the site. The results of these analyses were later used in the seepage modeling.
3D Seepage Modelling with RS3
The numerical seepage model was developed to investigate the interactions between the reservoir level, groundwater, and piezometer levels. With a 2D modelling providing limited insights into the relationship between the reservoir and piezometric heads, a 3D model was created.
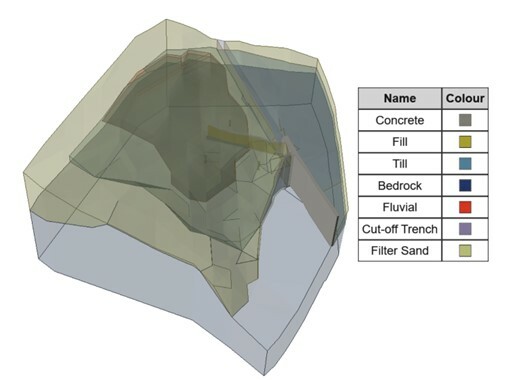
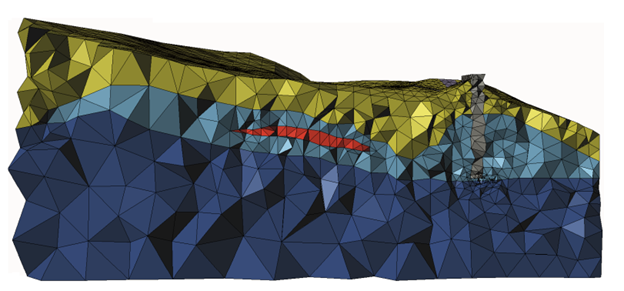
Based on the available background information and the borehole logs from 2013, the soil types were defined as either “till-like” or “fill” and the seepage model geometry was built using available borehole data, historical drawings, drone-captured images, and LiDAR mapping.
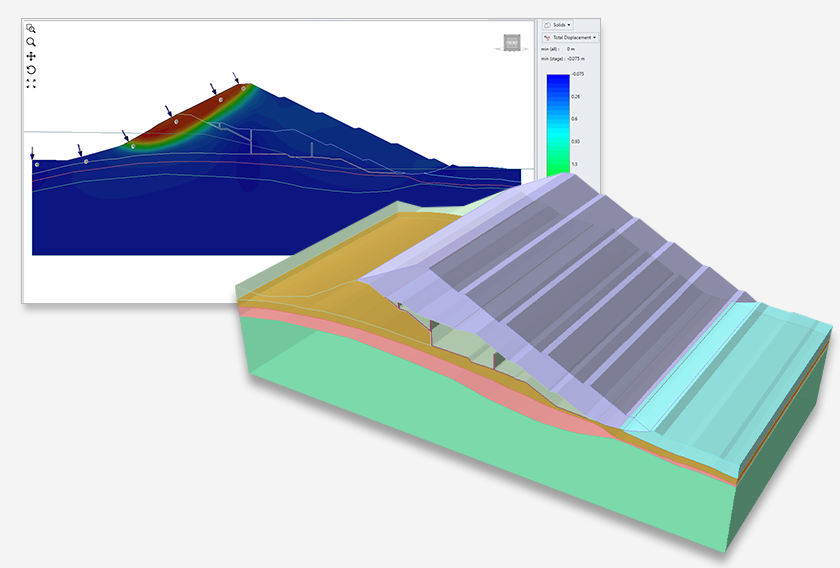
To create the model geometry in RS3, the geology was generated using boreholes and retaining wall structures were added to the external volume. These different volumes were then assigned as materials which can be seen in Figure 3.
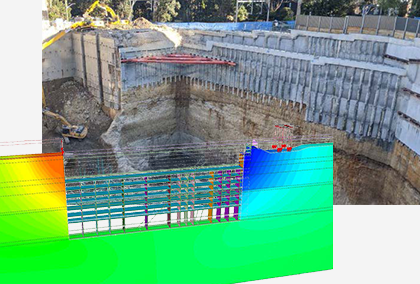
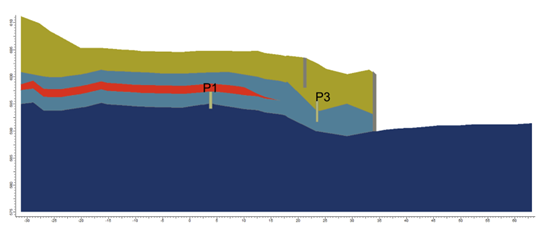
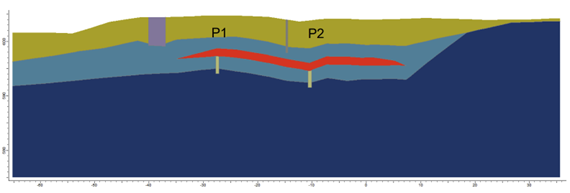
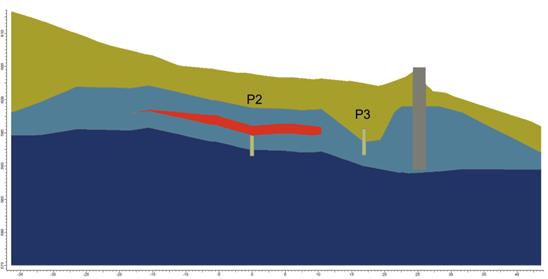
Figures 4, 5, and 6 show the 2D vertical cross-sections across the various piezometer locations. Results for the piezometer head were taken at the coordinate, parallel to the center of the piezometer screen in each piezometer.
Finite element mesh
Using the built-in meshing function, the FEM mesh of the model was generated, and a graded mesh was used based on the complexity of the geometry. The graded mesh in RS3 automatically generated finer mesh around the areas of interest where more geometry pieces are present, e.g. around the dam body.
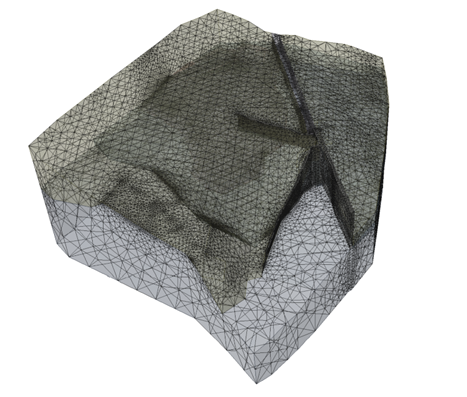
RS3 further helped assess the quality of the finite element mesh of the seepage model using the shape quality metric. Verifying the mesh quality is an important step of model creation as elements with a low mesh quality metric (less than 0.1) can lead to inaccurate results. In this seepage model, 99% of tetrahedrons have a mesh quality metric greater than 0.3 and 94% have it greater than 0.5. thus, the finite element mesh was considered an overall high-quality mesh.
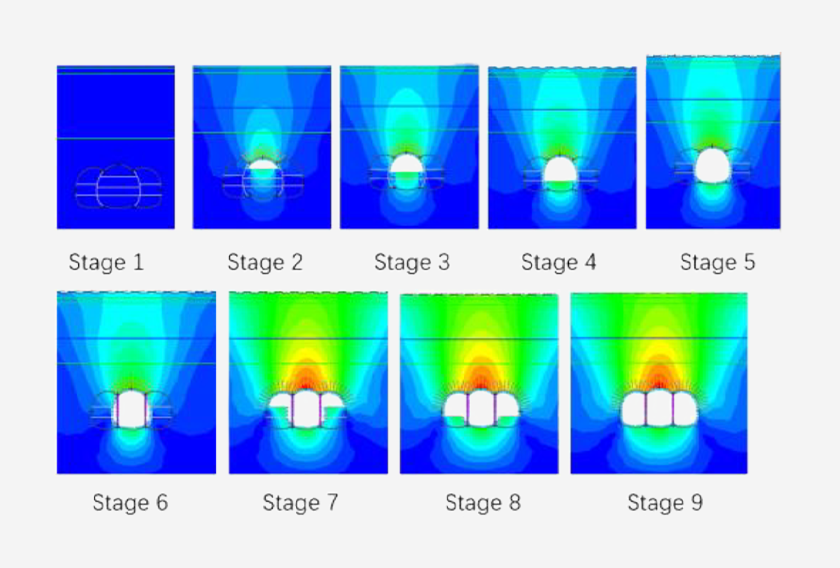
Stages of the finite element seepage modeling
- Calibration of the simulations for estimating the groundwater table and hydraulic conductivity values.
- Sensitivity analysis of the permeability values
- Sensitivity analysis of the model output to the model boundary conditions.
Findings through RS3’s finite element modeling of Sugar Lake Dam
RS3’s 3D finite element modeling in conjunction with the statistical analysis of the piezometer readings helped assess the relationship between piezometer measurements and reservoir levels. This cross-correlation analysis revealed that the water levels recorded in the piezometer are correlated when the reservoir elevates, whereas, when the reservoir is below 597.5m, no correlation was observed.
The sensitivity analysis of the 3D seepage model on the other hand found that at reservoir elevations below 599m, the piezometers are less sensitive to the changes in the reservoir level than when the reservoir is above 599m.
After evaluating all available data, it was also determined that 599m is the approximate interface between the top of the till material and the bottom of the fill material. It was identified that when the reservoir is above this elevation, the hydraulic connection between the piezometers and the reservoir is more efficient due to the higher permeability of the fill material.
Based on the 3D seepage analysis and finite element modeling, it was recommended to evaluate the piezometric data trends regularly as a part of the Sugar Dam Safety program to monitor changes in subsurface conditions.
Read the full paper for an in-depth understanding of the Sugar Lake Dam project.