1 - Quick Start
This tutorial is a simple introductory tutorial that helps you become familiar with the basic modelling and data interpretation features of SWedge.
SWedge is a quick, interactive, and simple-to-use analysis tool for evaluating the geometry and stability of surface wedges in rock slopes. Wedges are defined by two intersecting discontinuity planes, the slope surface, and an optional tension crack. SWedge provides an integrated graphical environment for fast, easy data entry and 3D model visualization.
Topics Covered in this Tutorial:
- Project Settings
- Deterministic Analysis
- Input Data
- Wedge View
- Viewing Options
- Analysis Results
- Info Viewer
- Stereonet View
- Water Pressure
- External Force
- Seismic Force
- Sensitivity Analysis
Finished Product:
The finished product of this tutorial can be found in the Tutorial 01 Quick Start.swd7 file, located in the Examples > Tutorials folder in your SWedge installation folder.
1.0 Introduction
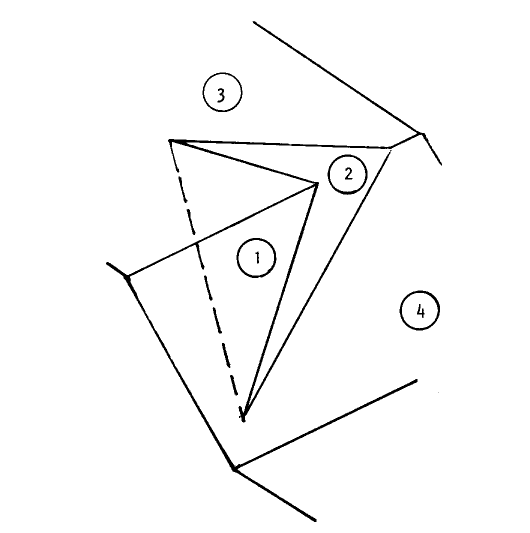
SWedge computes the Factor of Safety for the translational slip of a tetrahedral wedge formed in a rock slope by:
- two intersecting discontinuities (joint sets),
- the slope face,
- the upper ground surface, and
- a tension crack (optional).
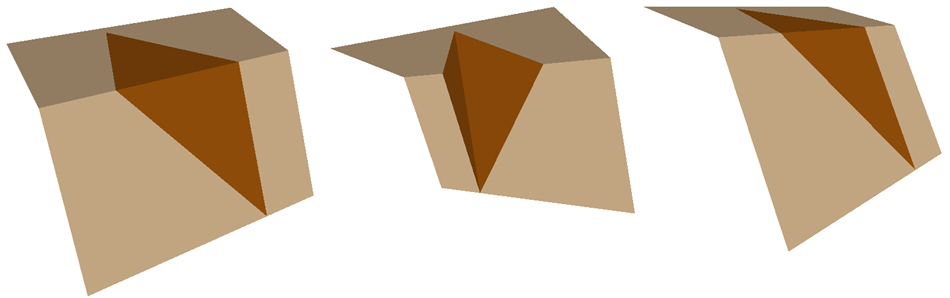
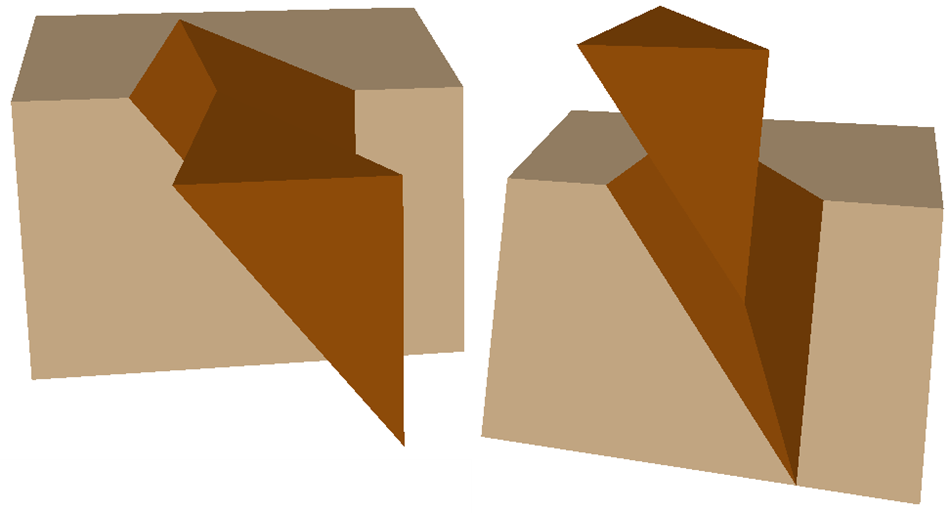
The image below illustrates a typical SWedge problem geometry.

When a pair of discontinuities are selected at random from a set of field data, it is not known whether:
- The planes could form a wedge (the line of intersection may plunge too steeply to daylight in the slope face or it may be too flat to intersect the upper ground surface).
- One of the planes overlies the other (this affects the calculation of the normal reactions on the plane).
- One of the planes lies to the right or the left of the other plane when viewed from the bottom of the slope.
In order to resolve these uncertainties, the solution has been derived using Block Theory, such that:
- Either of the planes may be labelled 1 (or 2).
- Allowance has been made for one of the planes overlying the other (see the figure below).
- The crest can overhang the base of the slope.
- Contact may be lost on either plane (this is dependent on wedge geometry and also on the magnitude of the water pressures acting on the planes).
A check on whether the two planes can form a wedge is included in the solution at an early stage. In addition, SWedge examines how the tension crack intersects the other planes, accepting only those cases where the tension crack truncates the wedge in a kinematically admissible manner.
2.0 Creating a New File
- If you have not already done so, run the SWedge program by double-clicking the SWedge icon in your installation folder or by selecting Programs > Rocscience > SWedge > SWedge in the Windows Start menu.
When the program starts, a default model is automatically created. If you do NOT see a model on your screen:
- Select: File > New

Whenever a new file is created, the default input data forms valid slope geometry, as shown in the image below.
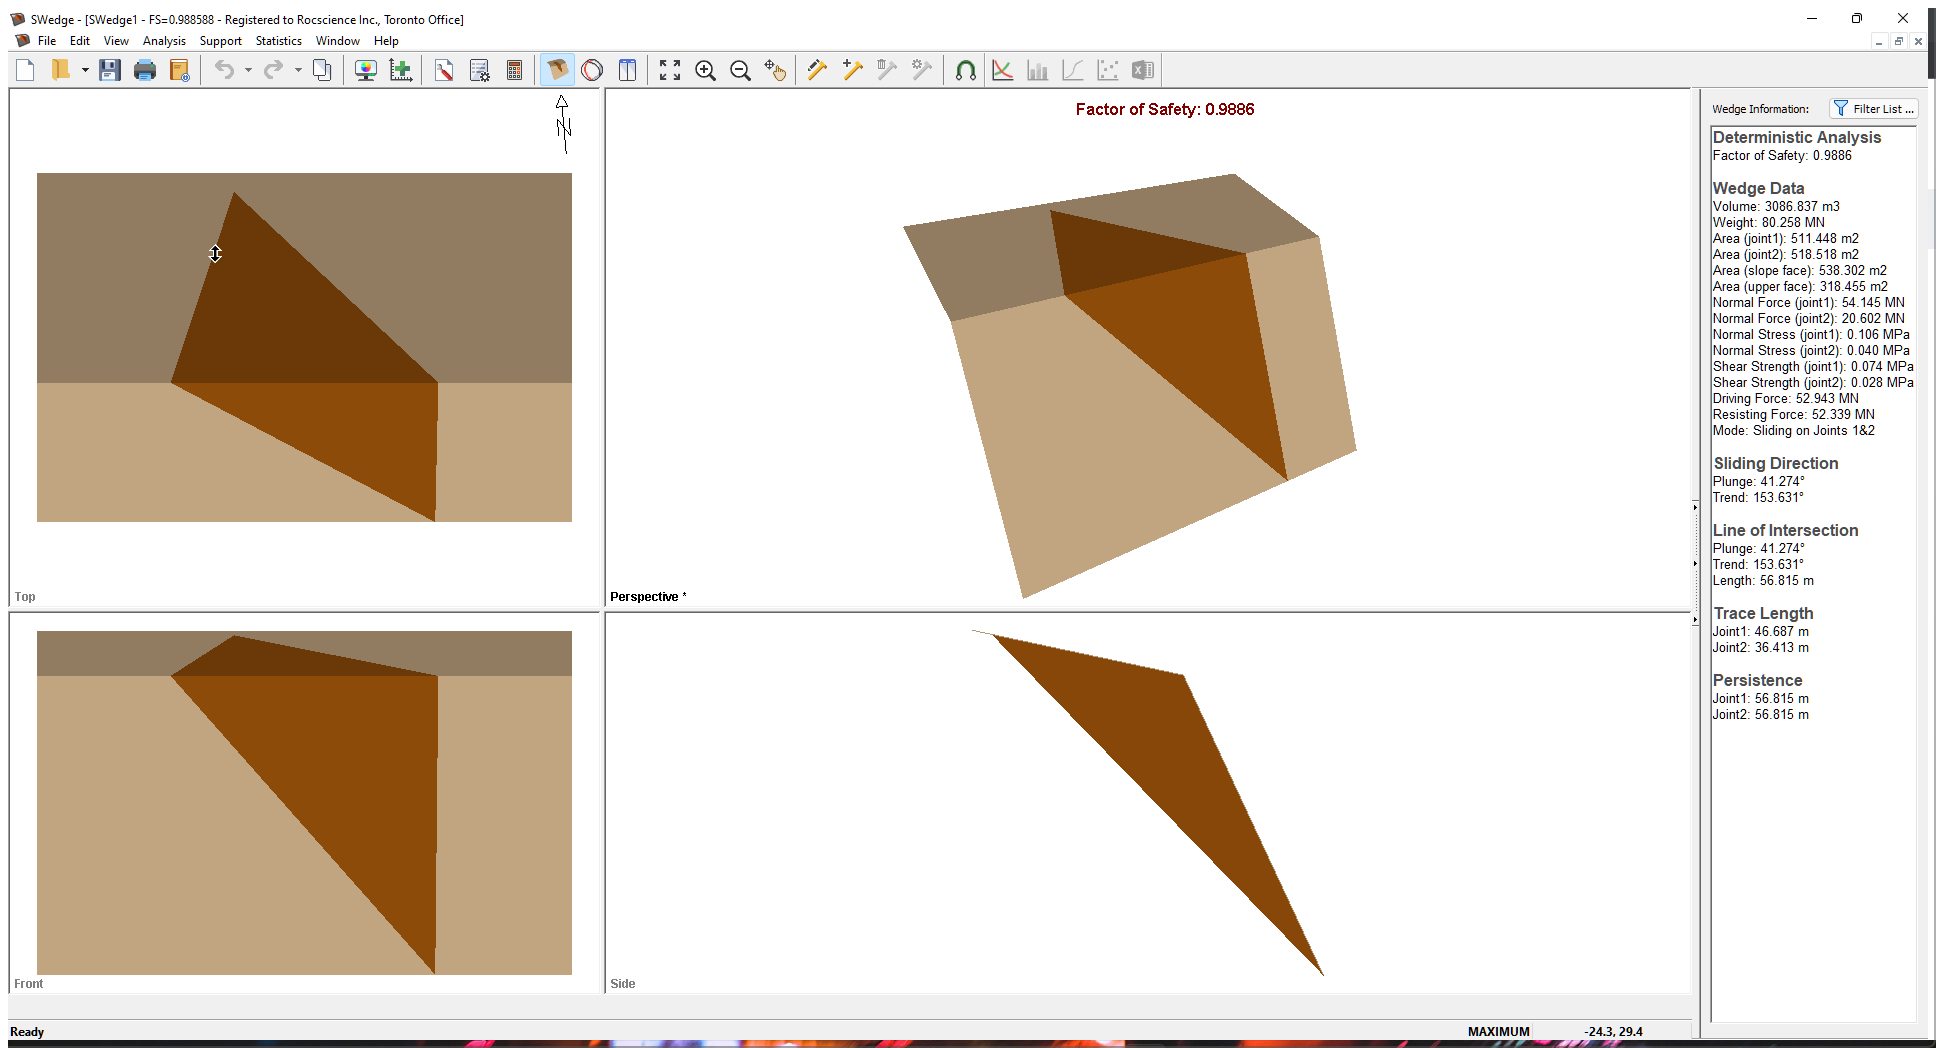
If the SWedge application window is not already maximized, maximize it now so that the full screen is available for viewing the model.
Notice the four-pane, split-screen format of the display, which shows Top, Front, Side and Perspective views of the model. This view is referred to as the Wedge View. The Top, Front and Side views are orthogonal with respect to each other (i.e., viewing angles differ by 90 degrees.)
3.0 Project Settings
The Project Settings dialog allows you to configure the main analysis parameters for your model, such as Analysis Type and Units. To open the dialog:
- Select: Analysis > Project Settings

3.1 ANALYSIS TYPE
There are three main analysis types in SWedge: Deterministic, Probabilistic, and Combinations. The default choice for new files is Deterministic.
- A Deterministic analysis assumes that all input parameters are exactly known. SWedge computes the Factor of Safety for a single wedge. This tutorial demonstrates a Deterministic analysis.
- For a Probabilistic analysis, statistical input data can be entered to account for uncertainty in joint orientation and strength values. The result is a distribution of Factors of Safety, from which a Probability of Failure is calculated. Probabilistic analysis is demonstrated in Tutorial 02 - Probabilistic Analysis in SWedge.
- For a Combinations analysis, any number of discrete joint orientations can be defined, and SWedge will analyze all possible combinations of two joints. Combinations analysis is demonstrated in Tutorial 03 - Combinations Analysis in SWedge.
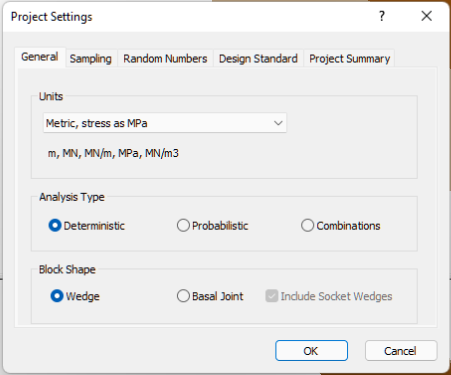
3.2 UNITS
In this tutorial we are using metric (MPa) units, so make sure the Metric, stress as MPa option is selected for Units in the Project Settings General tab (default setting).
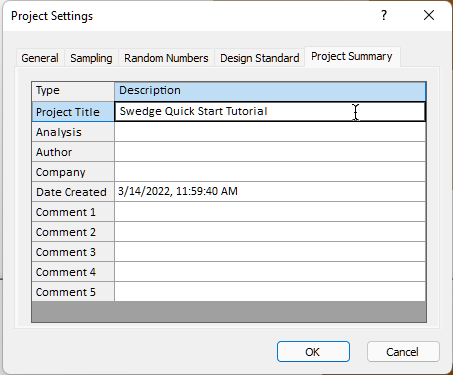
3.3 PROJECT SUMMARY
- Select the Project Summary tab and enter SWedge Quick Start Tutorial as the Project Title.
TIP: To have Author and Company information appear by default in Project Summary for new files, you can set them up in the Preferences dialog through the File menu.
- Leave all other settings as is and click OK to close the Project Settings dialog.
4.0 Input Data
Input Data is the main input data dialog for SWedge. To see the default input data used for a new SWedge model:
- Select: Analysis > Input Data

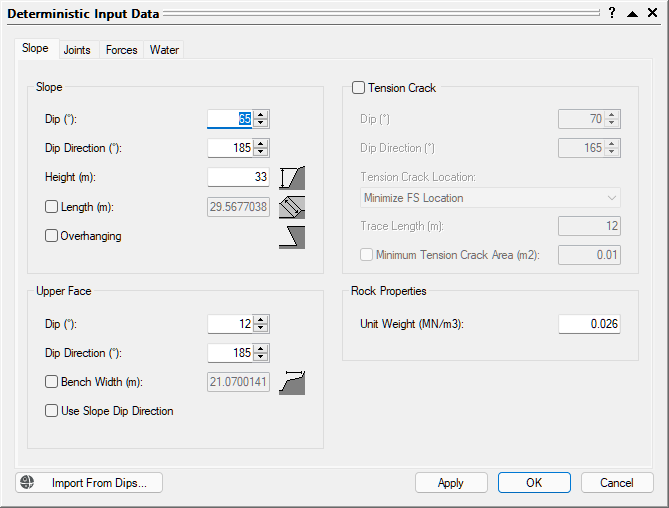
The Input Data dialog for a Deterministic analysis is organized under three tabs: Slope, Joints, and Forces.
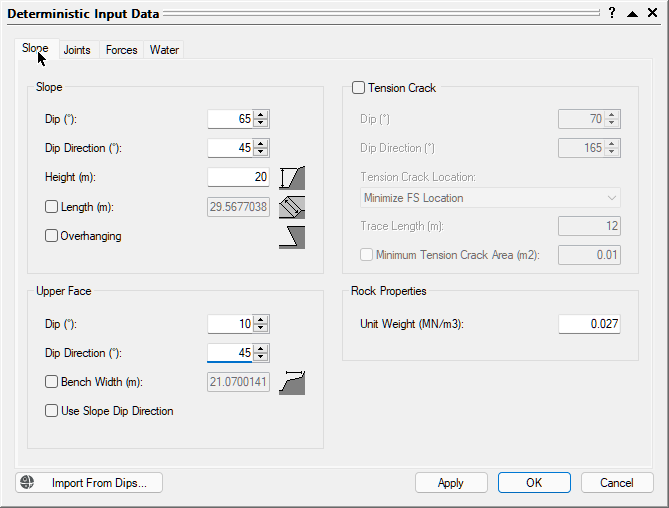
- Examine the Slope input data. The Slope (Dip, Dip Direction), Height, and Rock Properties data is required while all other Slope input data is optional. Do not change any of the values. We will come back to this tab shortly.
- Select the Joints tab and examine the input data. There are three options to define each joint's Shear Strength Model: Mohr-Coulomb, Barton-Bandis, and Power Curve. The default model is Mohr-Coulomb.
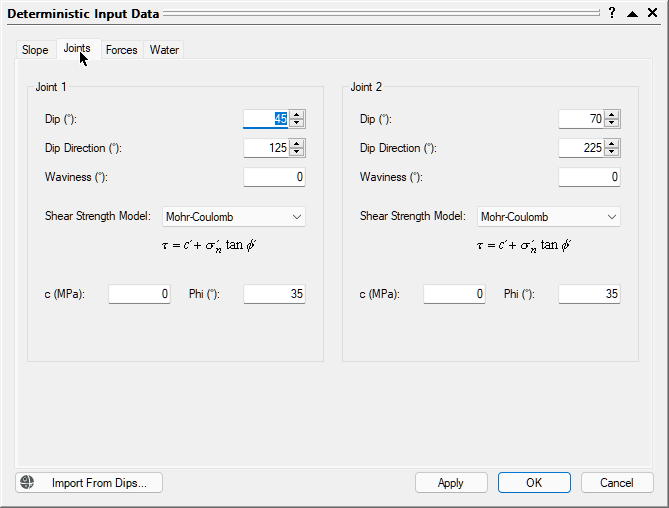
SWedge Input Data Joints tab TIP: To minimize/maximize the Input Data dialog, double-click the title bar or click the up/down arrow in the upper-right corner.
- Select the Forces tab and examine the input data. The Forces tab allows you to define Water Pressure, Seismic, and External Forces properties. You will learn more about these in Section 9 of the tutorial.
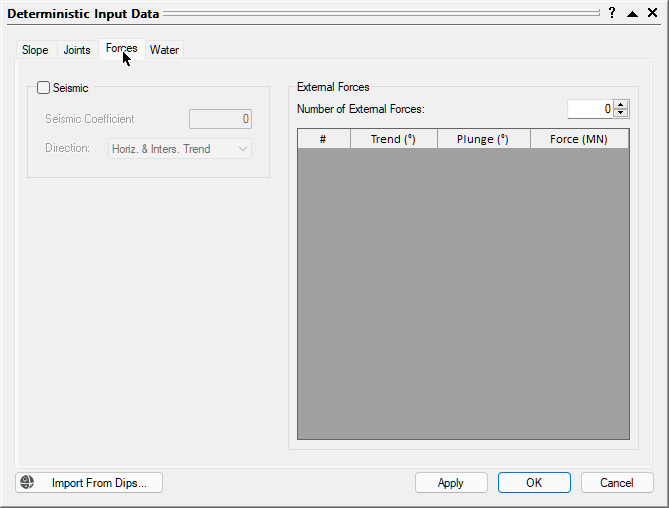
SWedge Input Data Forces tab - Click Cancel to close the Input Data dialog.
5.0 Analysis Results and the Wedge Information Panel
To ensure the latest analysis results are always displayed, SWedge automatically computes an analysis whenever:
- a file is opened, or
- input data is entered or modified in a dialog and Apply or OK is clicked.
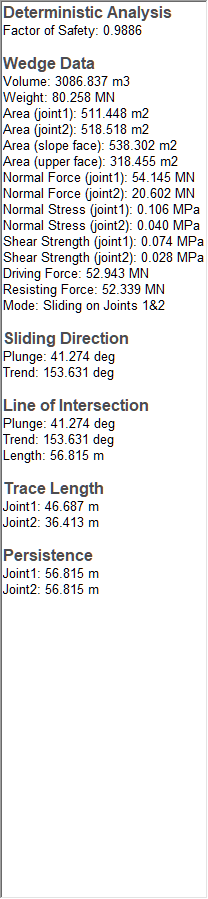
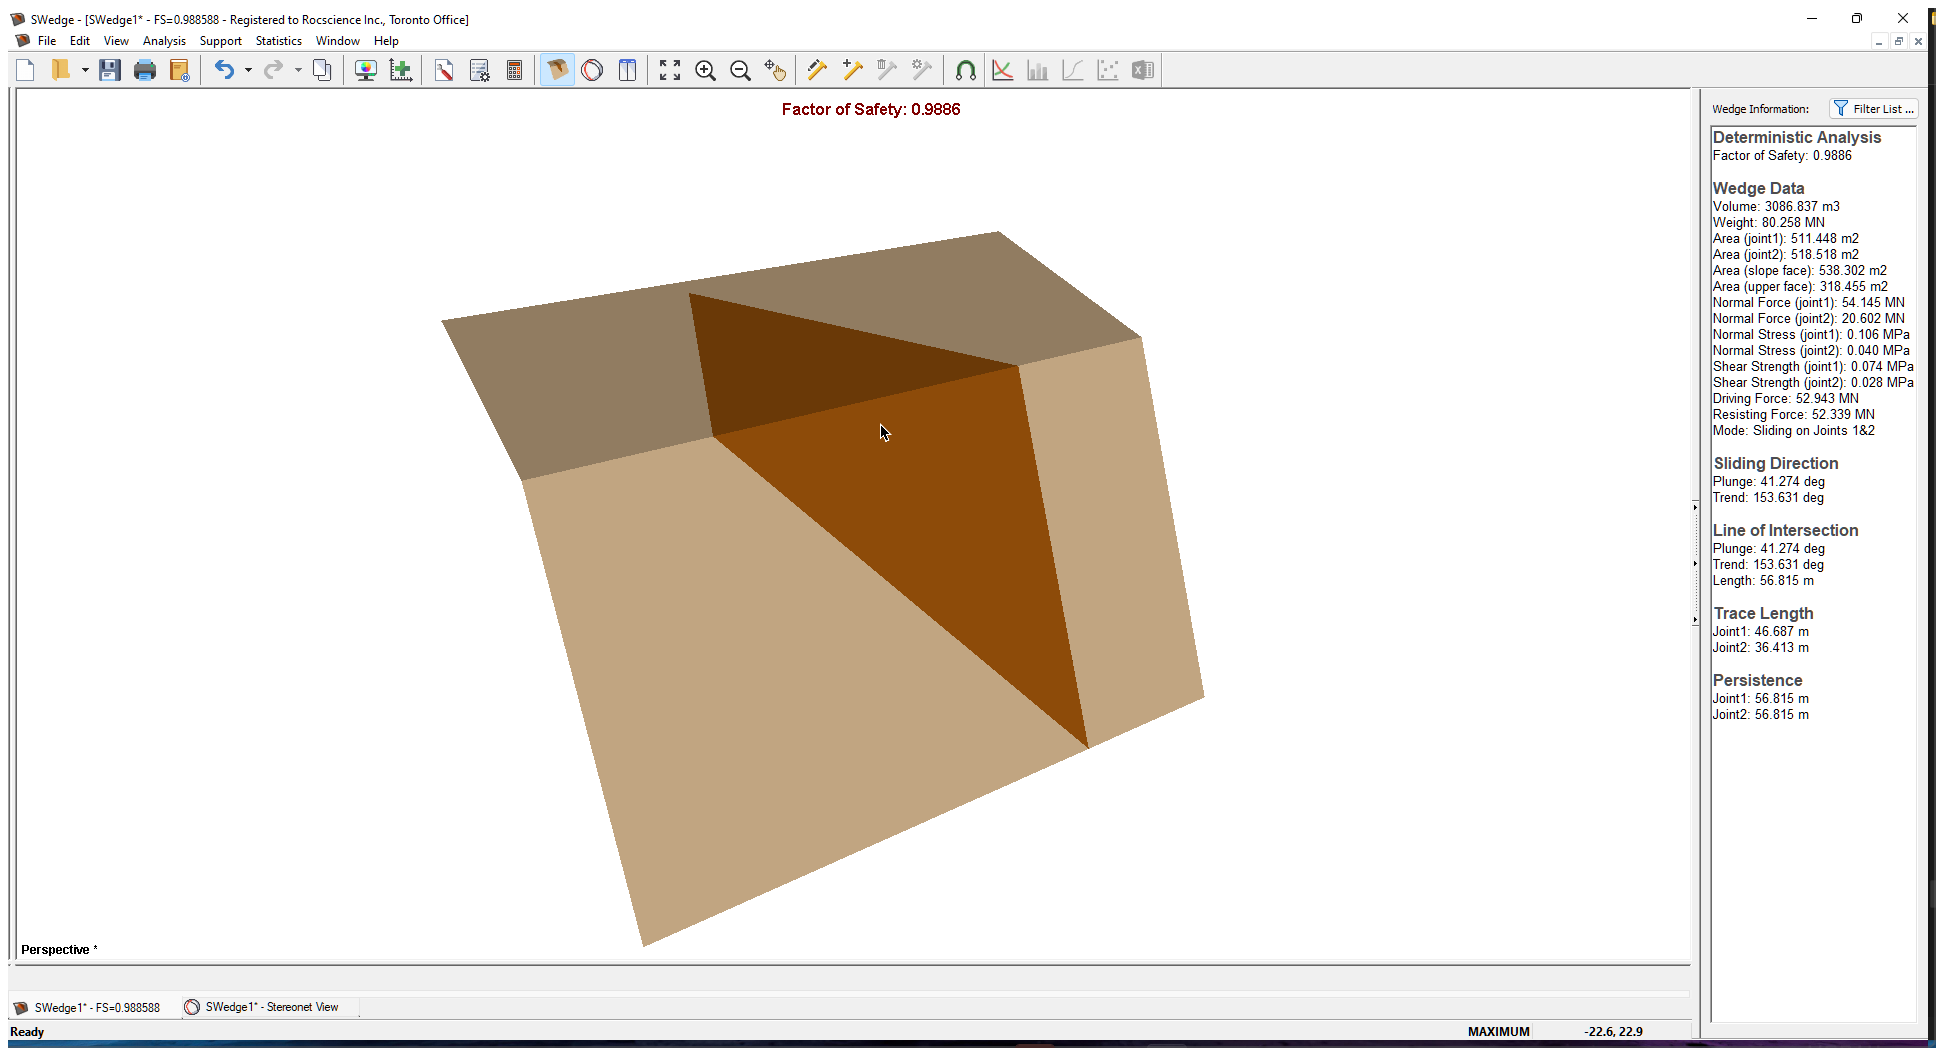
The primary result from an SWedge Deterministic analysis is the wedge Factor of Safety.
The Factor of Safety is displayed in the Wedge Information Panel and at the top of the Perspective View. The Factor of Safety also appears at the top of any view when it is maximized.
The Wedge Information Panel appears in the Sidebar on the right side of the SWedge application window and displays a summary of analysis results.
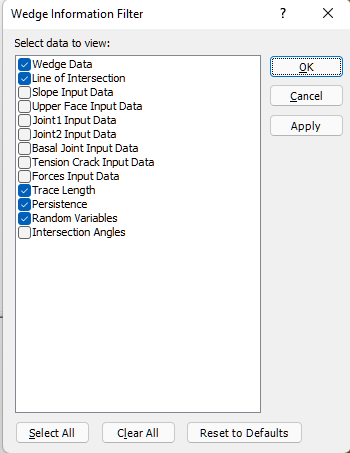
To customize the information displayed in the Wedge Information Panel, click the Filter List button at the top of the Sidebar and indicate the data you want to display by selecting the appropriate checkboxes in the Wedge Information Filter dialog.
TIP: To copy the information in the panel to the Clipboard, right-click in the panel and select Copy.
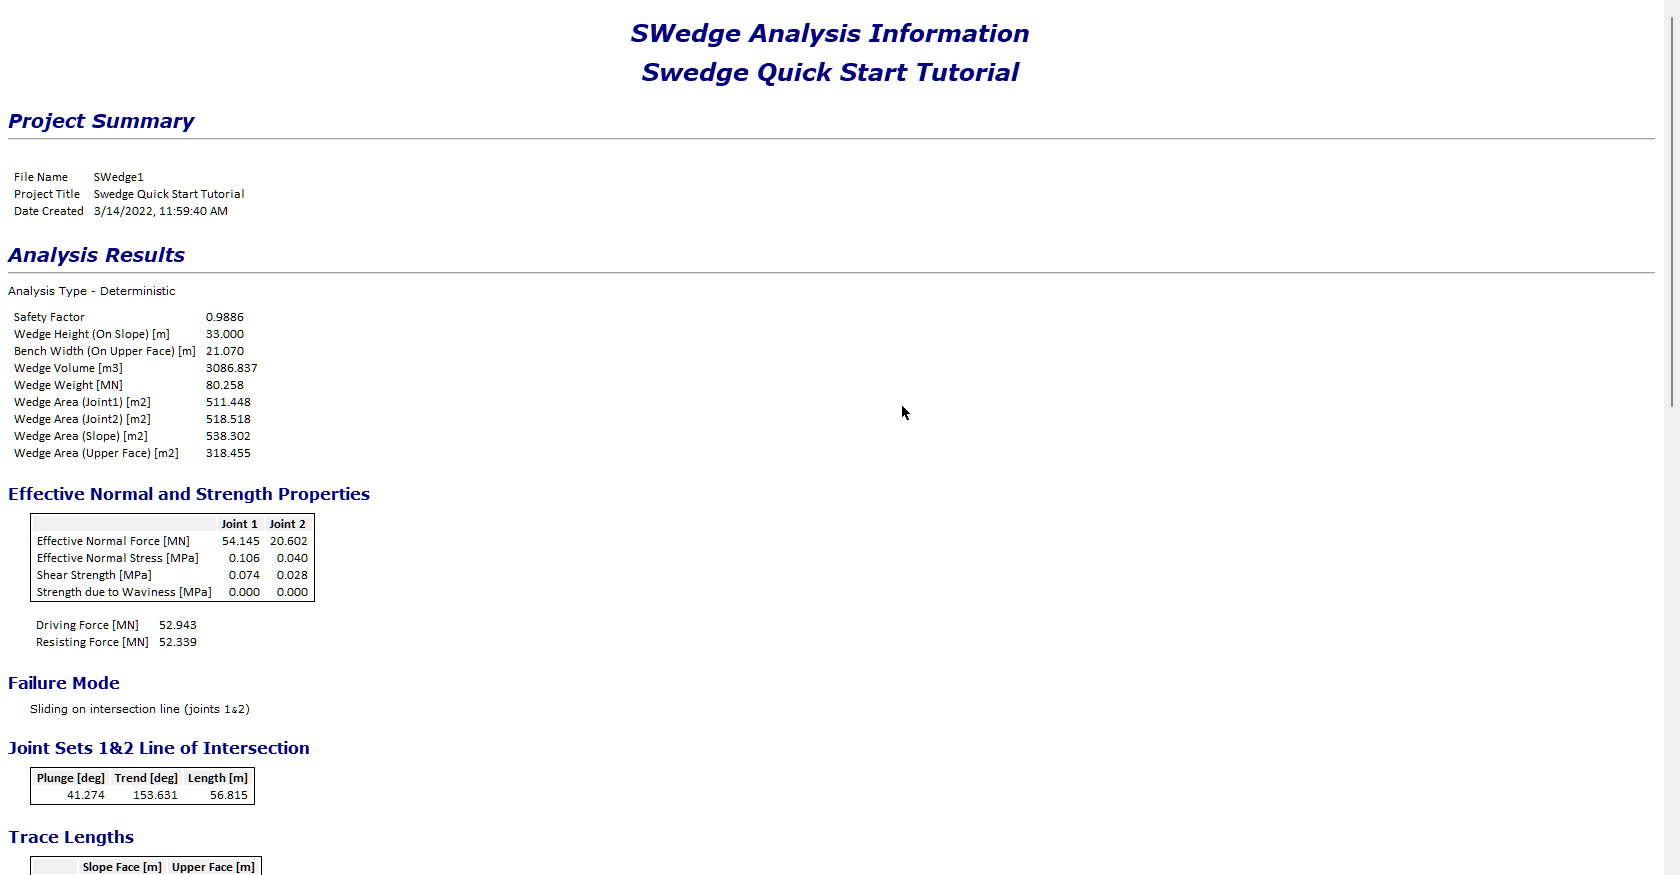
6.0 Info Viewer
The SWedge Info Viewer displays a comprehensive listing of input data and analysis results. To open the viewer:
- Select: Analysis > Info Viewer

- To copy data in the Info Viewer to the Clipboard or save it to a file, right-click in the viewer and access the various options in the pop-up menu.
- To close the Info Viewer, click the Close Window button on the toolbar
 or click the X in the upper right-hand corner of the view.
7.0 Stereonet View
The Stereonet View in SWedge displays a stereographic projection of plane orientations in your model's Input Data (Slope, Upper Face, Tension Crack, Joint 1, and Joint 2).
To open the Stereonet View:
- Select: Analysis > Stereonet

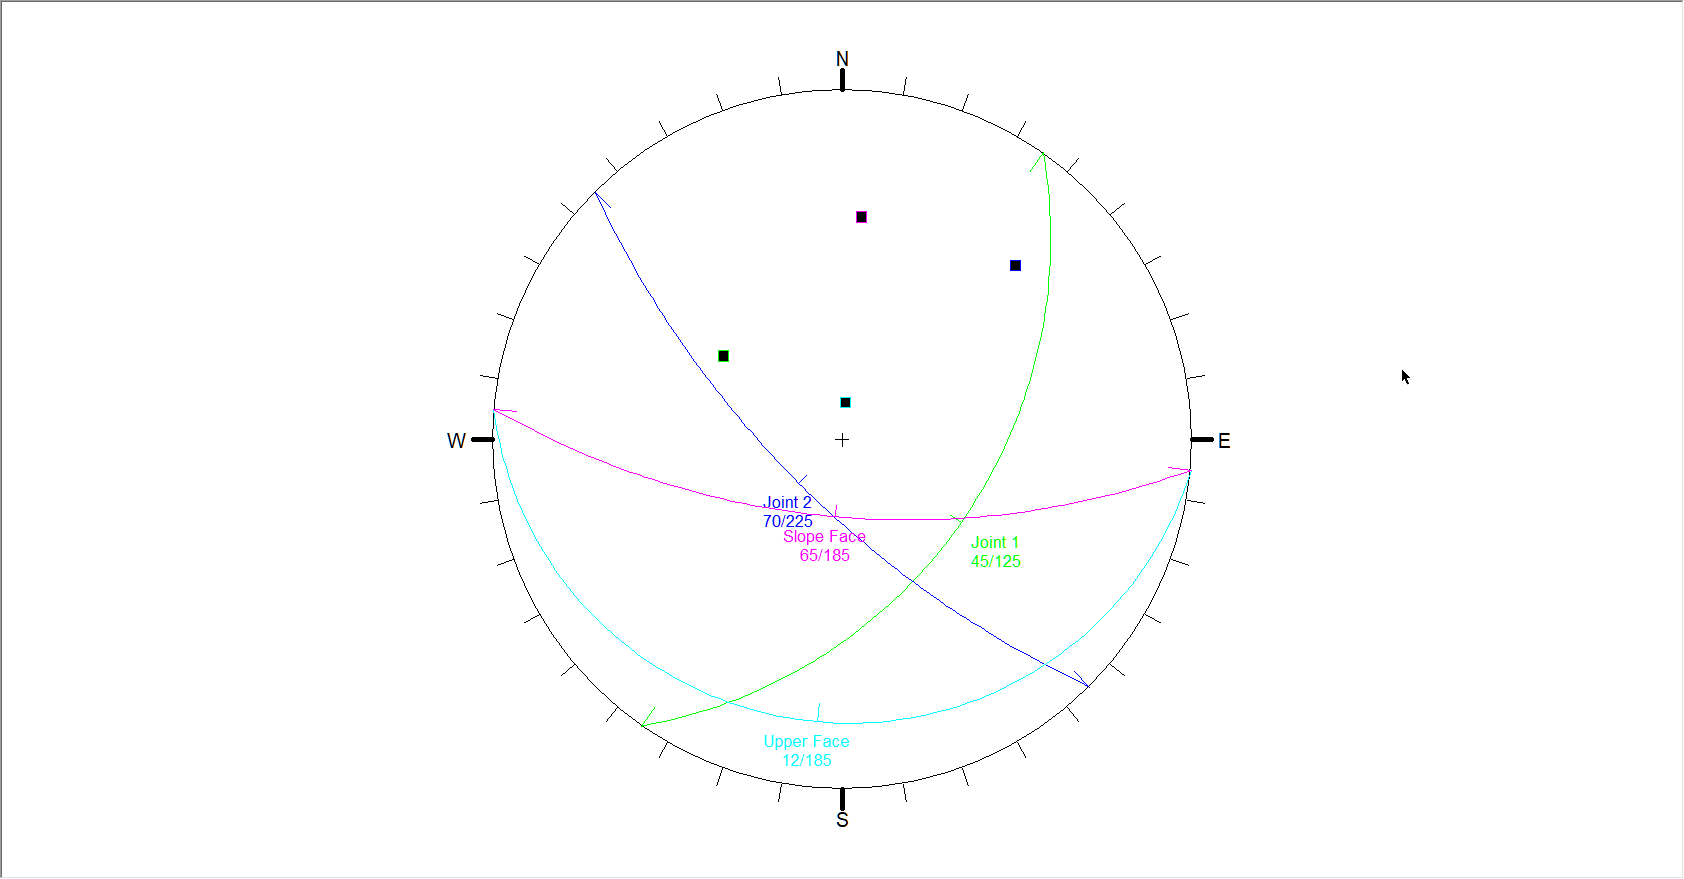
By default, the Stereonet View is displayed using Equal Angle Projection. To change the view to Equal Area Projection or to set other view options (e.g., Show Planes, Show Poles, Show Intersections, Show Failed), right-click in the viewer to display the options pop-up menu. You can also set these options using the Stereonet sub-menu of the View menu or in the Display Options dialog (select View > Display Options).
8.0 Viewing Options
In this section of the tutorial, you'll learn about some of the viewing options and shortcuts available in the Wedge View (the previous view). To switch back to the view:
- Select: Analysis > Wedge View

As mentioned earlier, the Wedge View has a four-pane, split-screen format made up of Top, Front, Side and Perspective views of the model.
8.1 ROTATING THE MODEL
Within the Perspective pane, you can view the SWedge model at any angle by interactively rotating it with the left mouse button as follows:
- Press and hold the left mouse button anywhere in the Perspective pane. Notice that the cursor changes to a circular arrow symbol
 to indicate that you may rotate the model.
 - Keep the left mouse button pressed and move the cursor around to rotate the model according to the direction of movement of the cursor.
- To exit the rotation mode, release the left mouse button. The cursor reverts to the normal arrow symbol.
- To reset the rotation to the default viewing angle, right-click on the view and select Reset View
 or select Reset View on the View menu.
8.2 MOVING THE WEDGE
The wedge can be moved out of the slope by clicking and dragging with the left mouse button or by rotating the mouse wheel, as described below.
To move the wedge with the left mouse button:
- Position the cursor over the wedge in the Perspective, Top, or Front panels of the model. The cursor will change to a vertical, two-way arrow symbol
 .
. - Click and hold the left mouse button and drag the mouse. As you move the cursor up or down, the wedge will slide up or down out of the slope along the direction of sliding.
To move the wedge by rotating the mouse wheel:
- To make the wedge movement larger, rotate the mouse wheel while holding down the SHIFT key.
- To make the wedge movement smaller, rotate the mouse wheel while holding down the CTRL key.
- To move the wedge upwards, rotate the mouse wheel forwards.
To reset the wedge to its default position within the slope, do one of the following:
- Double-click the mouse wheel in any view.
- Right-click the mouse in any view and select Reset Wedge Movement or Reset View.
8.3 RE-SIZING THE VIEWS
Within the Wedge View, you can maximize any of the four panes or change their relative size.
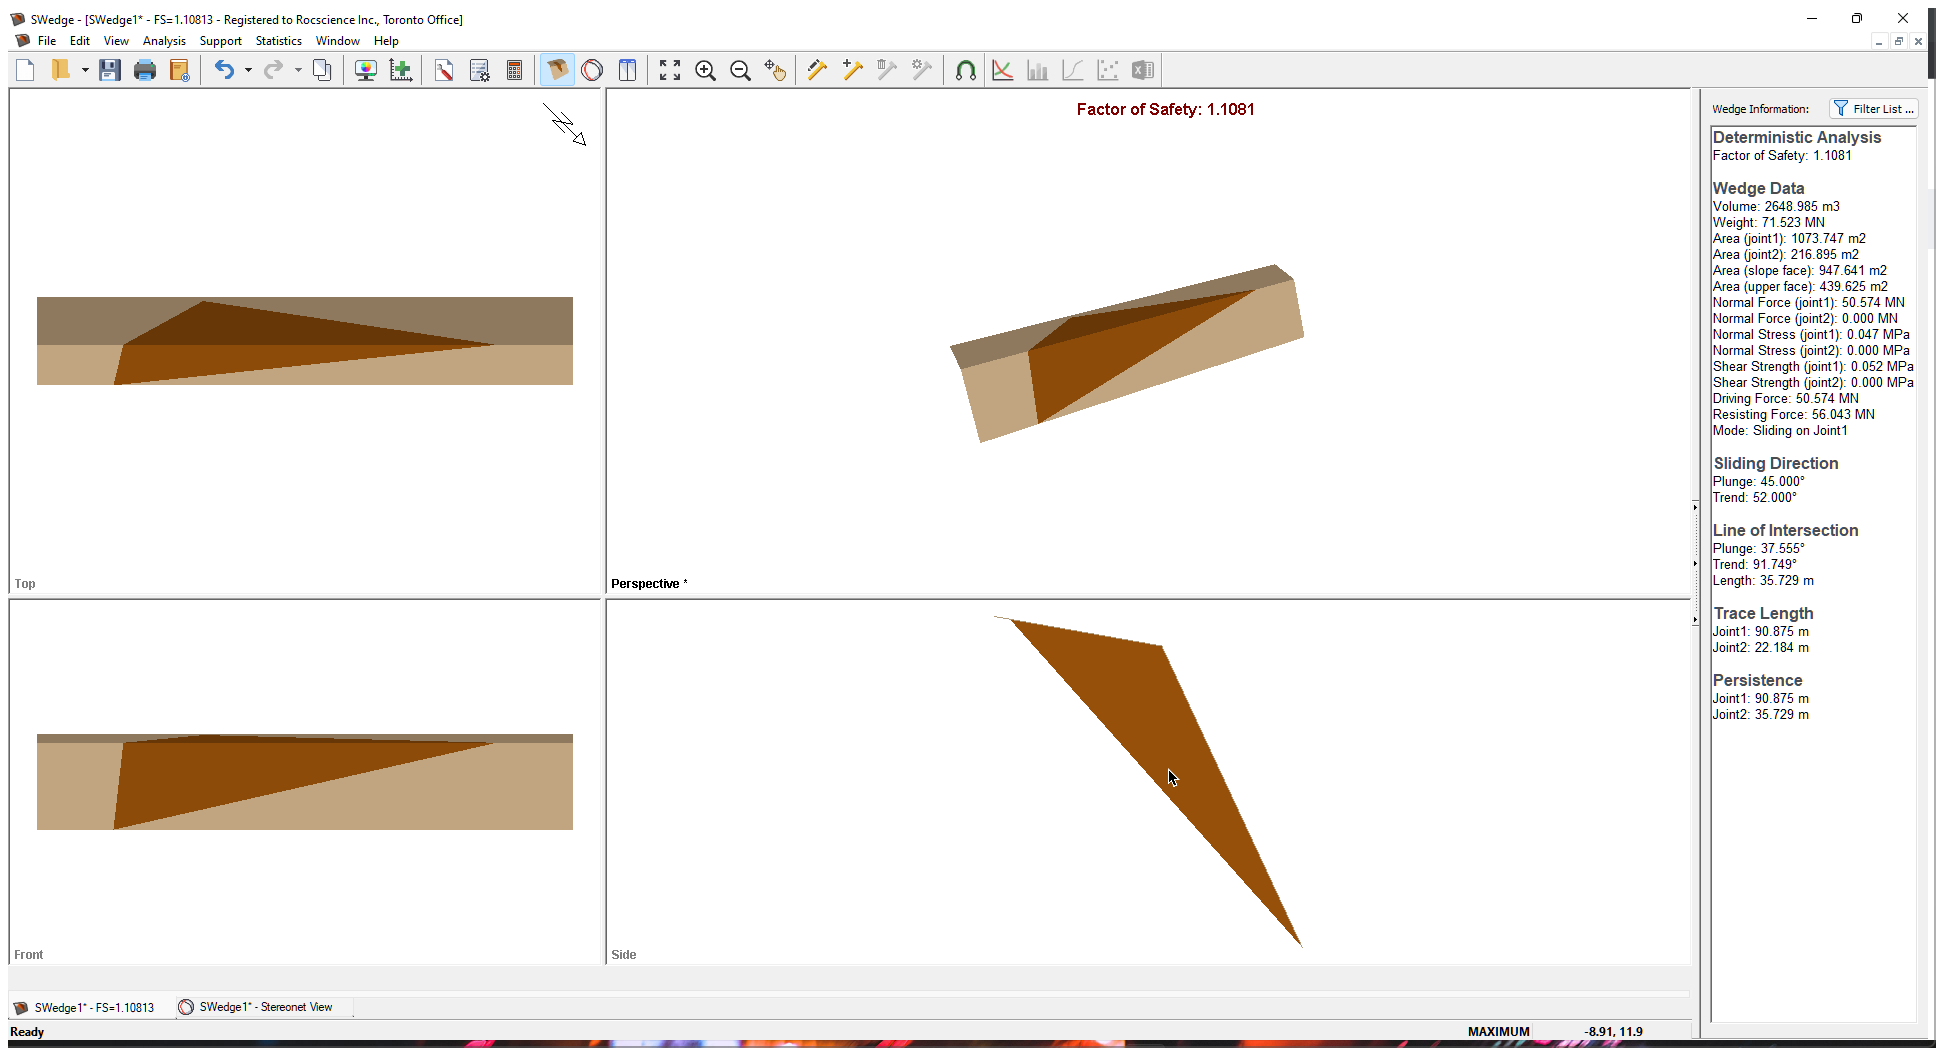
- Double-click inside a pane to maximize it. Double-click again to restore the view to the four panes. The image below displays a maximized Perspective pane.
Maximized Perspective panel in SWedge - To re-size any of the four panes, click and drag the vertical or horizontal dividers.
TIP: If you've re-sized a pane and want to quickly restore it to the default size, double-click in any pane to maximize it, then double-click again to restore the default display.
8.4 ZOOMING AND PANNING
The following zoom and pan options are available in the Wedge View:
- Zoom All
 – Reset the model to its default size and location in the view.
 - Zoom In
 – Zoom in to 90 % of the original area.
 - Zoom Out
 – Zoom out to 111% of the original area.
 - Pan
 – Translate the model left, right, up, or down within the view
You can access the zoom and pan options on the toolbar, on the Zoom sub-menu of the View menu, and through various keyboard and mouse shortcuts as follows:
- Rotate the mouse wheel forward or backward to zoom in or out.
- Use the F2, F4, and F5 function keys to access the Zoom Extents, Zoom Out, and Zoom In functions, respectively.
- To use the Pan function, click and hold the mouse wheel while dragging the mouse to pan the model within the view.
For more detailed help on zooming and panning, see Zoom and Pan.
9.0 Changing Input Data
In this section of the tutorial, you'll learn how to change the data in the model's Input Data dialog. To open the dialog:
- Select: Analysis > Input Data
Select the Slope tab and enter the following data:
Slope Dip (°)
65
Slope Dip Direction (°)
45
Slope Height (m) 20 Upper Face Dip (°)
10
Upper Face Dip Direction (°)
45
Unit Weight (MN/m3)
0.027
SWedge Input Data Slope tab Select the Joints tab and enter the following data:
Joint 1 Dip (°)
45
Joint 1 Dip Direction (°)
52
Joint 1 Cohesion (MPa)
0.025
Joint 1 Friction Angle (°)
30
Joint 2 Dip (°)
70
Joint 2 Dip Direction (°)
18
Joint 2 Cohesion (MPa)
0
Joint 2 Friction Angle (°)
35
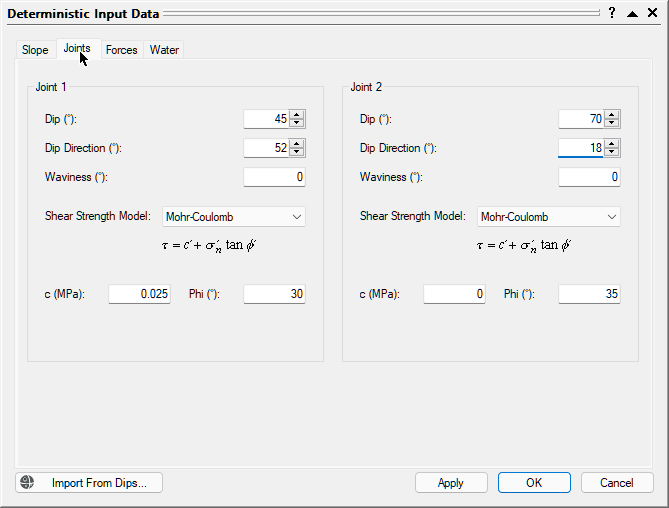
SWedge Input Data Joints tab - Leave the Waviness angle set to 0.The Waviness angle accounts for the waviness (undulations) of a joint surface, observed over distances on the order of 1 m to 10 m. It has the effect of increasing the shear strength of the joint. For more help on this input property, see Joint Waviness Angle.
- Click OK to close the dialog and re-compute the SWedge analysis with the new input data.
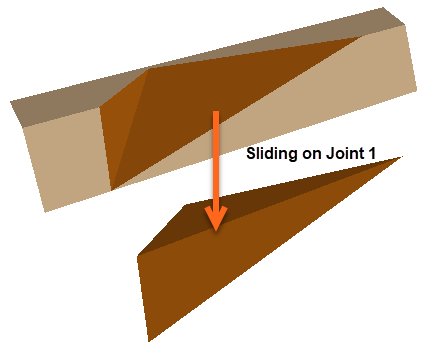
You should see the following wedge, with a Factor of Safety of approximately 1.11.
9.1 SLIDING PLANE
Notice that the analysis data displayed in the Wedge Information Panel indicates the failure mode as Sliding on Joint 1. Due to the geometry of this wedge, the failure mode is sliding on one joint instead of on both joins (i.e., along the line of intersection of Joints 1 and 2). This is consistent with the wedge geometry since Joint 2 dips at 70 degrees and has a cohesion of 0 and, therefore, has little influence on the stability of the wedge.
9.2 WATER PRESSURE
By default, Water Pressure is NOT applied to an SWedge model.
To include Water Pressure in a Deterministic analysis:
- Re-open the Input Data dialog.
- Select the Water tab and select the Joint Water Pressure check box.
- Select Filled Fissures as the Pressure Distribution Model.
- Leave the Unit Weight and Hu values as is.
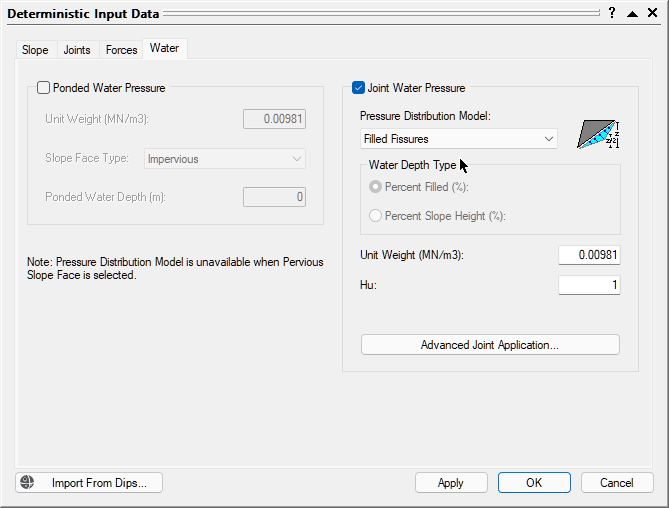
SWedge Input Data Forces tab - Water Pressure properties - Click OK.
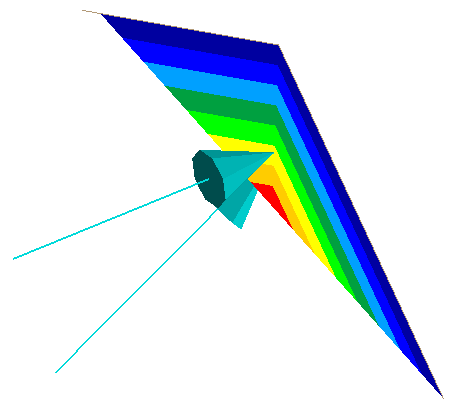
Notice that the Factor of Safety decreases to 0.57, indicating an unstable wedge. The Filled Fissures option assumes extreme conditions of heavy rainfall such that maximum (average) values of water pressure are applied on the failure planes.
Notice also that arrows representing the Water Pressure force are displayed normal to the wedge failure planes, as shown in the image below.
In the Wedge Information Panel, note the (effective) Normal Force, Normal Stress, and Shear Strength values for Joint1. The application of Water Pressure has reduced these values compared to the dry state, resulting in a decreased Factor of Safety.
9.3 EXTERNAL FORCE
Now let’s add a single External Force in a direction such that it will help to stabilize the wedge.
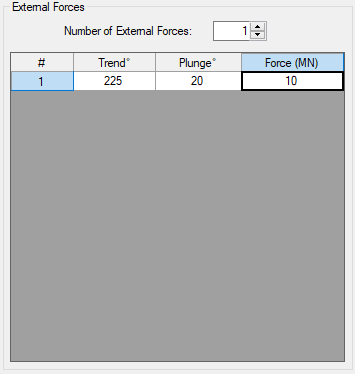
- Re-open the Input Data dialog and select the Forces tab.
- Under External Forces, set Number of External Forces = 1.
- Enter Trend = 225°, Plunge = 20°, and Force = 10 MN.
- Click OK.
Notice that the Factor of Safety (with Water Pressure applied) increases to 0.73, which is still an unstable wedge. Notice also that an arrow representing the External Force is now displayed on the model.
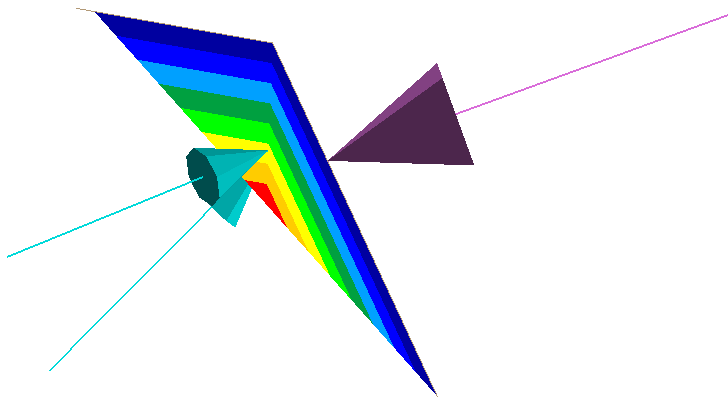
TIP: External Force can also be applied to a model by adding Support. For help, see Tutorial 04 - Support in SWedge.
9.4 SEISMIC FORCE
Now we will include Seismic Force in the analysis.
- Re-open the Input Data dialog and select the Forces tab.
- Select the Seismic check box. Enter a Seismic Coefficient of 0.2. Set Direction = User Defined and enter Plunge = 0° and Trend = 52°.
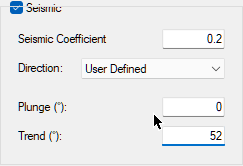
- Click OK. Notice that the Factor of Safety drops to 0.50.
An arrow representing the Seismic Force is now displayed on the model.
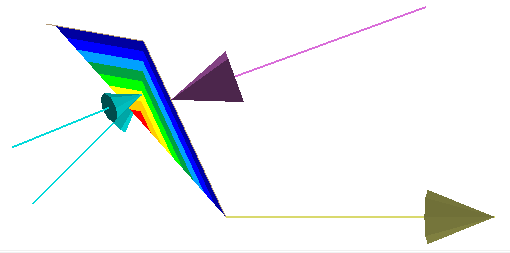
The Seismic Force applied to the wedge is F = 0.2 * g * m, where g = gravitational acceleration and m = mass of the wedge. Note that Trend is equal to the Dip Direction of Joint 1, which is the worst possible direction in this case since the failure mode for this wedge already indicates Sliding on Joint 1.
10.0 Sensitivity Analysis
The final section of the tutorial demonstrates the SWedge Sensitivity analysis feature. In a Sensitivity analysis, individual variables can be varied among user-defined minimum and maximum values while all other input parameters remain constant. This allows you to determine the effect of individual variables on the Factor of Safety.
We will use Sensitivity analysis to show that the worst possible direction to apply a Seismic Force is the sliding direction of the wedge.
- Re-open the Input Data dialog and select the Water tab.
- Turn OFF Water Pressure by unchecking the check box.
- Select the Forces tab. Turn OFF the External Forces by setting Number of External Forces = 0.
- Make sure the Seismic force check box stays selected.
- Click OK.
- Select Sensitivity Analysis
 on the toolbar or on the Analysis menu.
 - In the Sensitivity Input dialog, select the first check box then select Seismic Force Trend from the drop-down list. Enter From = 0 and To = 120
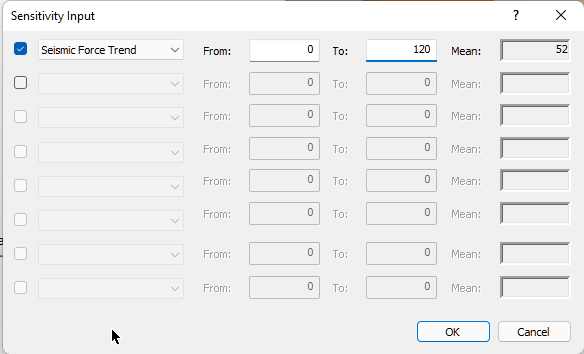
SWedge Sensitivity Input dialog - Click OK.
You should see the following sensitivity plot.
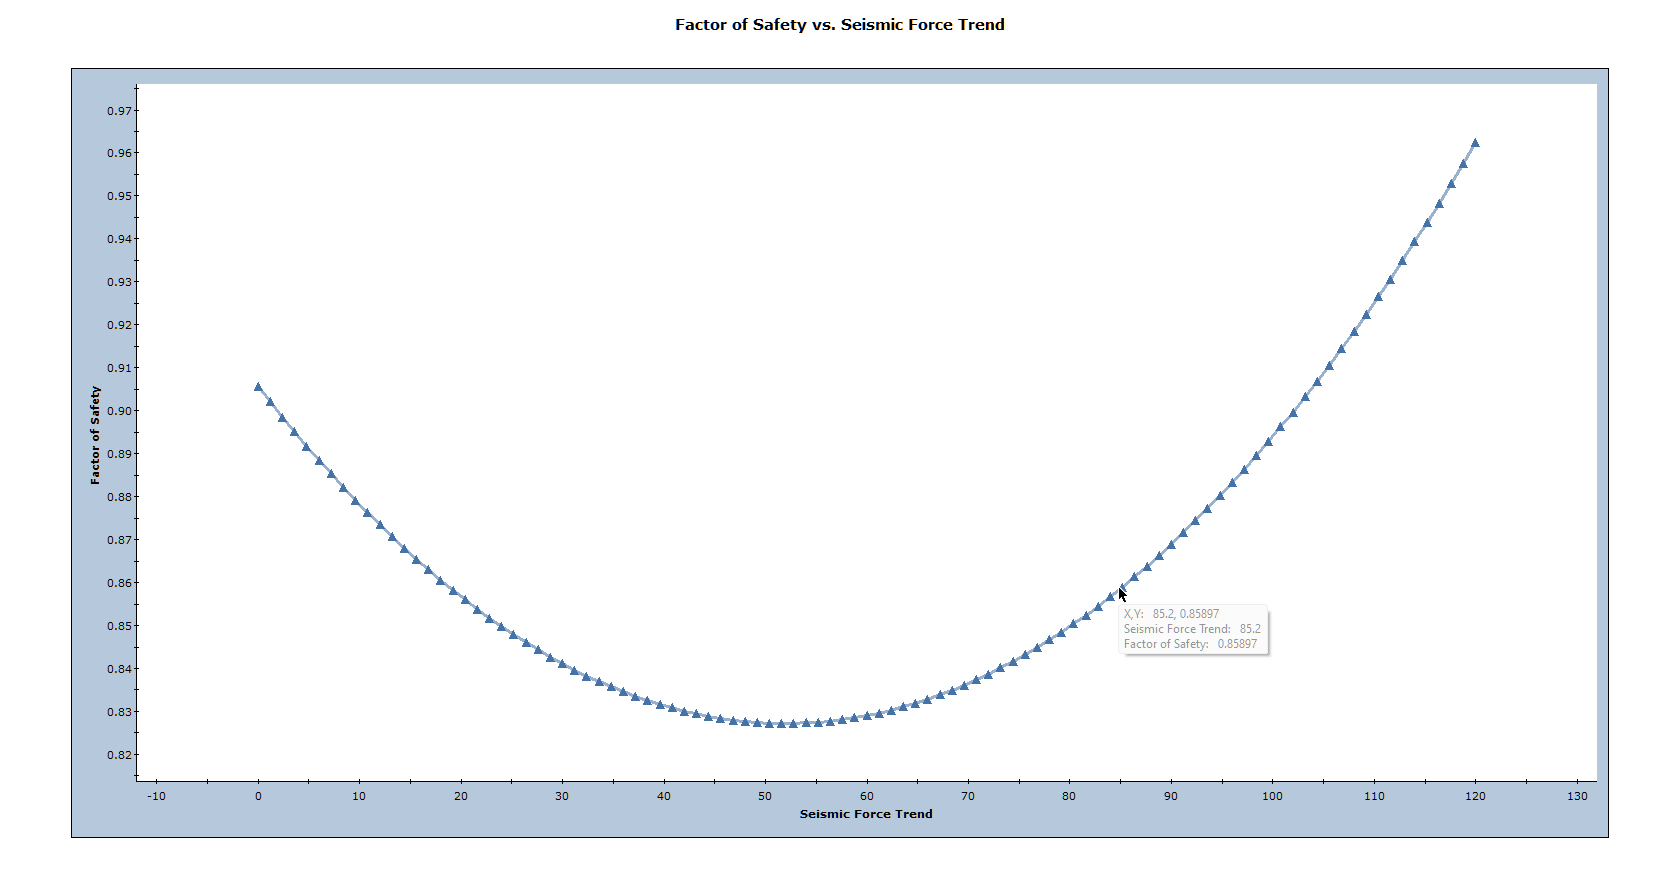
As you can clearly see from the graph, the minimum Factor of Safety occurs when Seismic Force Trend = 52 degrees, which is the wedge failure direction (and the Dip Direction of Joint 1).
Although the wedge failure direction is often the most critical direction in which to apply a seismic force, it may vary depending on the presence of other external forces (e.g., water pressure, support, etc.) and the strength properties of the individual failure planes.
As an optional exercise, you can also use the Sensitivity Analysis feature to explore the effect of Seismic Force Plunge on the Factor of Safety.
This concludes the tutorial.