Undrained Analysis of a Deep Excavation in Clayey Soils Using PLAXIS Hardening Soil Model in RS2
- Kien Dang, Director of Global Technical Development at Rocscience
- Alireza Azami, Director of Business and Research at Rocscience
When analyzing a geotechnical problem, different design parameters are utilized depending on drained or undrained conditions. A drained analysis is typically used for soils with large permeabilities, such as sands or gravel, or soils under long-term loading. On the other hand, undrained soil parameters need to be considered when simulating the short-term loading of a given clay model, as this examines the sample before it has been drained. Since undrained strength is not an intrinsic property of clay, this property changes within different depths of a model, as the applied in-situ stresses change. In summary, the drained or undrained condition depends on soil types and/or rate of loading.
In RS2, undrained analyses can be modeled using three different approaches:
- Using undrained strength and stiffness parameters (using Poisson' ratio close to 0.5 and back calculate the undrained young modulus (E) from the effective shear modulus (G)). Using this approach, no excess pore water pressure will be generated.
- Using undrained strength parameters and effective stiffness parameters, the excess pore pressure can be generated using this approach, but it may not be accurate.
- Using effective strength parameters and stiffness parameters, depending on the constitutive models that was utilized, accurate excess pore pressure can be generated.
In approaches 2 and 3, undrained behavior can be modelled by either activating "Undrained" in Consolidation analysis option or by setting Material behaviors to "Undrained" in RS2. Note that only one of the options should be selected.
A case study of an excavation in clays will be carried out in the following section to demonstrate undrained analysis using the third approach. The Hardening Soil model is selected to simulate the clayey undrained materials. Strength and Stiffness parameters are in terms of “effective stresses,” however, the material is “undrained” during the loading and excavation stages.
The Taipei National Enterprise Center Excavation
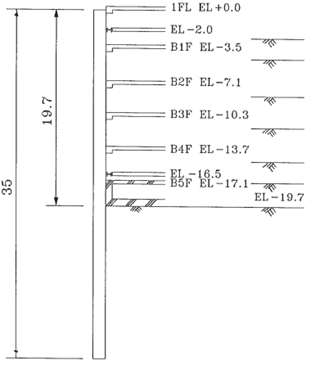
The Taipei National Enterprise Center (TNEC) building is an 18-storey structure with five basement levels constructed in 1991 (Ou, Shiau, & Wang, 2000). The excavation for its site completed with the top-down construction method across seven stages, which took place over the span of approximately three hundred days.
In the first stage, which took place after installing the wall, the soil was excavated down to a depth of 2.8m, under the assumption that the ground surface elevation is zero. In the second stage, temporary H400 x 400 x 13 x 21 steel struts at the depth of 2.0m were installed, followed by the excavation of the soil to a depth of 4.9m. In the third stage, a slab was constructed at the depth of 3.5m, then the temporary struts from the previous stage were demolished, then the ground was further excavated to the depth of 8.6m. In the fourth stage, floor slabs were constructed at the depths of 0m (ground surface) and 7.1m, then the excavation was continued down to the depth of 11.8m. In the fifth stage, a floor slab was constructed at a 10.3m depth, followed by an excavation down to 15.2m. In the sixth stage, another slab was constructed at the depth 13.7m, and the excavation was further continued down to the depth of 17.3m, which was followed by installing temporary H400 × 400 × 13 × 21 steel struts. In the seventh stage, struts of the same dimensions and specifications were installed again, and the soil was excavated down to 19.7m. The purpose of the temporary struts was to reduce wall deformations throughout the excavation process prior to installing the concrete slabs.
Figure 1 shows a cross-section of the excavation site, highlighting the elevations and the concrete slabs constructed at different depths.
RS2 Analyses of the TNEC Excavation
Model Description
This case study covers the analysis of this excavation project, modeled using RS2. The results of this analysis, including the horizontal displacement of the installed wall along its length, and the vertical settlement of the soil on the ground surface, are compared to observed behavior in the field and an equivalent simulation in PLAXIS.
The soil layers in this project consist of different layers of sandy and clayey materials. The sand layers are considered to have high permeability and behave as drained materials. All sand materials are modeled using the Mohr Coulomb model with properties given in Table 1. The clays are low permeable materials and behave as undrained materials. The nonlinear behavior of these materials is modelled with the Hardening Soil constitutive model with properties listed in Table 2.
To establish the initial field of stress and pore pressure, an initial stage is considered in this analysis where all materials are assumed to be drained. The loading process starts form stage 2 with the wall installation, and from this stage forward, the clay materials will change behavior to undrained.
Table 1: Sand Parameters on RS2 Models
Depth |
5.6m - 8.0m |
33.0m - 35.0m |
37.5m - 45.0m |
Type |
Loose Silty Fine Sand |
Medium Dense Silty Fine Sand |
Silty Fine Sand |
Young’s modulus (kPa) |
68351 |
265473 |
300247 |
Poisson’s ratio (ν) (-) |
0.3 |
0.2 |
0.3 |
Friction angle (ϕ) (º) |
30 |
33 |
35 |
Cohesion (c) (kPa) |
0.1 |
0.1 |
0.1 |
Dilation angle (ψ) (º) |
0 |
3 |
5 |
Unit Weight (kN/m3) |
18.93 |
19.62 |
19.62 |
Failure Criterion |
Mohr-Coulomb |
Mohr-Coulomb |
Mohr-Coulomb |
In this model, the clay layer starting at 11.8m was split at the depths of 17.3m, 25.0m, and 33.0m, resulting in four different layers within that depth range with each having slightly different parameters. All the clay layers utilized the Hardening Soil constitutive model with parameters that were obtained from the article “Evaluation of Soil Constitutive Models for Analysis of Deep Excavation under Undrained Condition journal article” (Lim, Ou, & Hsieh, 2010).
Table 2: Clay Parameters for the Refined Model of the Third Approach
Depth |
0m - 5.6m |
8.0m - 11.8m |
11.8m - 17.3m |
17.3m -25.0m |
25.0m - 33.0m |
35.0m - 37.5m |
|
Type |
Soft Silty Clay |
Medium Soft Clay |
|||||
Young’s modulus (kPa) |
E50 |
4574 |
9375.01 |
15952 |
19220.3 |
20750 |
21227 |
Eoed |
3202 |
6562 |
11167 |
13454 |
20750 |
6562 |
|
Eur |
13723 |
28125 |
74858.4 |
57660 |
14525 |
28125 |
|
Poisson’s ratio (ν) (-) |
0.2 |
0.2 |
0.2 |
0.2 |
0.2 |
0.2 |
|
Friction angle (ϕ) (º) |
30 |
29.08 |
29.08 |
29.08 |
29.08 |
30 |
|
Cohesion (c) (kPa) |
1 |
1 |
1 |
1 |
1 |
1 |
|
Dilation angle (ψ) (º) |
0 |
0 |
0 |
0 |
0 |
0 |
|
Unit Weight (kN/m3) |
18.25 |
18.15 |
18.15 |
18.15 |
18.15 |
19.13 |
|
OCR |
4 |
1.8 |
1.5 |
1.2 |
1.1 |
1 |
|
K0-nc |
0.5 |
0.5 |
0.5 |
0.5 |
0.5 |
0.5 |
|
The diaphragm wall is wished-in-place at stage 2 and modelled with a structural interface in RS2. The wall is 90cm thick and 35m long. Interface elements are placed on both sides of the wall between the wall and surrounding soil. The interface properties are material dependent with a 70% reduction factor due to disturbance.
The lateral supports from the temporary steel struts and concrete floor slabs are modelled using Springs in RS2, properties of which are listed in table 3. The detain of the lateral supports are also given in this table, however the final spring stiffness values that are used in the simulation were calculated based on a 20% reduction, applied to each support based on the recommendation by Lim, Ou, & Hsieh, 2010.
Table 3: Properties of lateral supports
Depth |
2.3m |
3.5m |
7.1m |
10.3m |
13.7m |
16.5m |
Type |
Steel Struts |
Concrete Slab |
Concrete Slab |
Concrete Slab |
Concrete Slab |
Steel Struts |
Spring Stiffness (kN/m/m) |
11720.93 |
117209.3 |
117209.3 |
117209.3 |
117209.3 |
50331.05 |
E (kPa) |
2.1e8 |
2.1e7 |
2.1e7 |
2.1e7 |
2.1e7 |
2.1e8 |
A (m2) |
0.012 |
- |
- |
- |
- |
0.0219 |
Spacing (m) |
8 |
- |
- |
- |
- |
3.4 |
Thickness (m) |
- |
0.15 |
1.5 |
0.15 |
0.15 |
- |
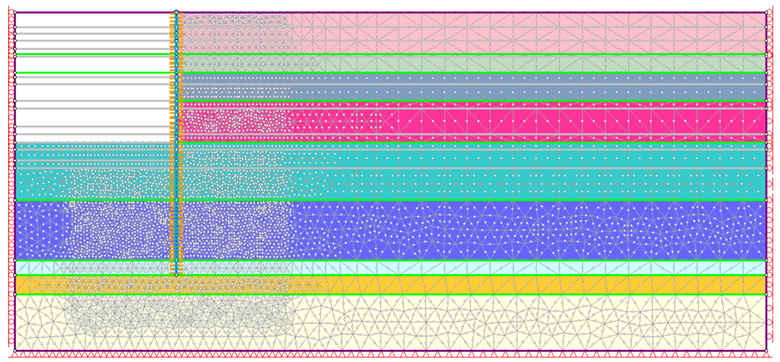
During the excavation, the water table is kept at 1m below the base of excavation by dewatering at each stage of the excavation. The geometry, soil layers, and the finite element mesh of this simulation are presented in Figure 2. This figure shows the geometry at the last stage of excavation. The mesh is refined around the excavation area for better accuracy of the calculation results.
Results
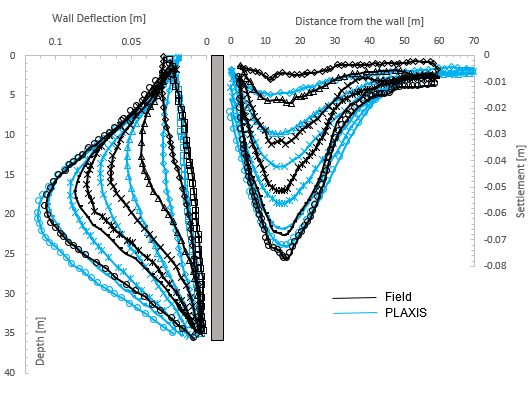
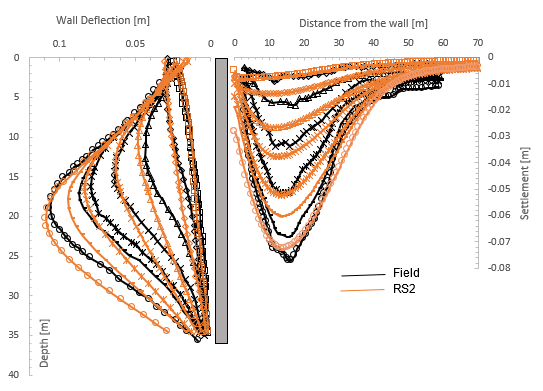
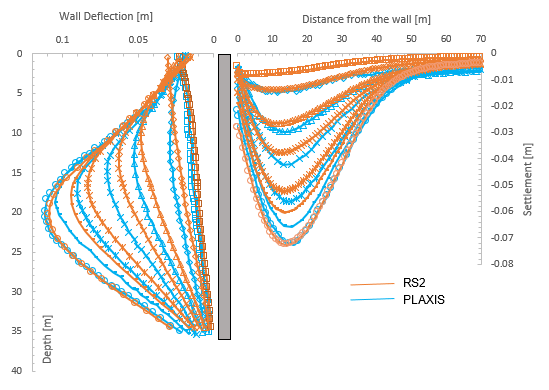
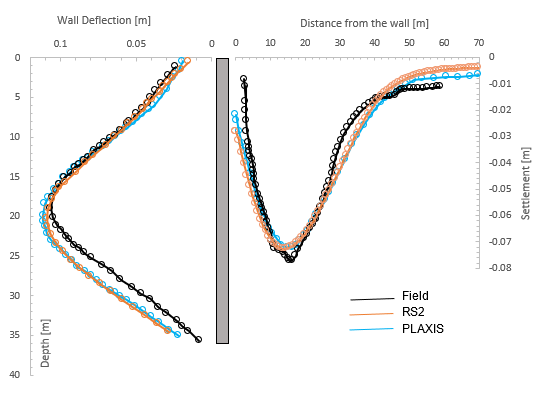
The observed and computed wall deflection are compared in Figure 3 to Figure 6. Figure 3 shows the comparison between the field observation and the results obtained form the simulation done by Lim, Ou, & Hsieh, 2010 using PLAXIS. Figure 4 shows a comparison between the field observation and simulation results from RS2. For a better comparison between the numerical simulation, the results from PLAXIS and RS2 are shown in Figure 5. Finally, the wall deflection and ground settlement at the final stage of the excavation is presented in Figure 6 where the field observation, PLAXIS results and RS2 results are all compared with each other.
Conclusions
A case study on a deep excavation in clayey soils was presented. The numerical simulation was carried out with RS2 and PLAXIS both using Hardening Soil model to simulate the clay materials. To simulate the undrained behavior of the clays, the “undrained” option was selected in the hydraulic properties of the materials. From the results, it can be shown that both tools can successfully predict wall deflection and soil settlement during the excavation. In a direct comparison of the finite elements tools, it was shown that the simulated results are very close to each other in this complex multistage simulation.
References
Lim, A., Ou, C.-Y., & Hsieh, P.-G. (2010, April). Evaluation of Soil Constitutive Models for Analysis of Deep Excavation under Undrained Condition. Journal of GeoEngineering, 5, 9-20. doi:10.6310/jog.2010.5(1).2
Ou, C.-Y., Liao, J.-T., & Cheng, W.-L. (2000, January). Building response and ground movements induced by a deep excavation. Geotechnique, 50, 209-220. doi:10.1680/geot.2000.50.3.209
Ou, C.-Y., Shiau, B.-Y., & Wang, I.-W. (2000). Three-dimensional deformation behavior of the Taipei National Enterprise Center (TNEC) excavation case history. Canadian Geotechnical Journal, 37(2), 438-448. doi:10.1139/t00-018