Seamless Integration of Borehole Data and Slope Stability Analysis in Rocscience Ecosystem
- Alireza Afkhami, Senior Director of Web Applications at Rocscience
- Sina Javankhoshdel, Senior Manager - LEM at Rocscience
Modern geotechnical projects demand efficiency, accuracy, and seamless data integration. With the increasing complexity of site investigations and the vast amount of borehole data collected over the years, engineers need tools that can streamline the entire workflow - from data import to slope stability analysis.
RSLog is a powerful borehole data management tool that offers multiple ways to enter data. You can choose from manual data entry, use the OnSite tablet app, or easily import data from popular third-party formats such as gINT, DIGGS, AGS, and Wincore. If your project involves data from these sources and needs an efficient way to create your slope stability model, you've found the right guide. This article outlines an example workflow that starts with a gINT file and ends with Slide2 analysis results.
Step 1: Import Your gINT Boreholes into RSLog
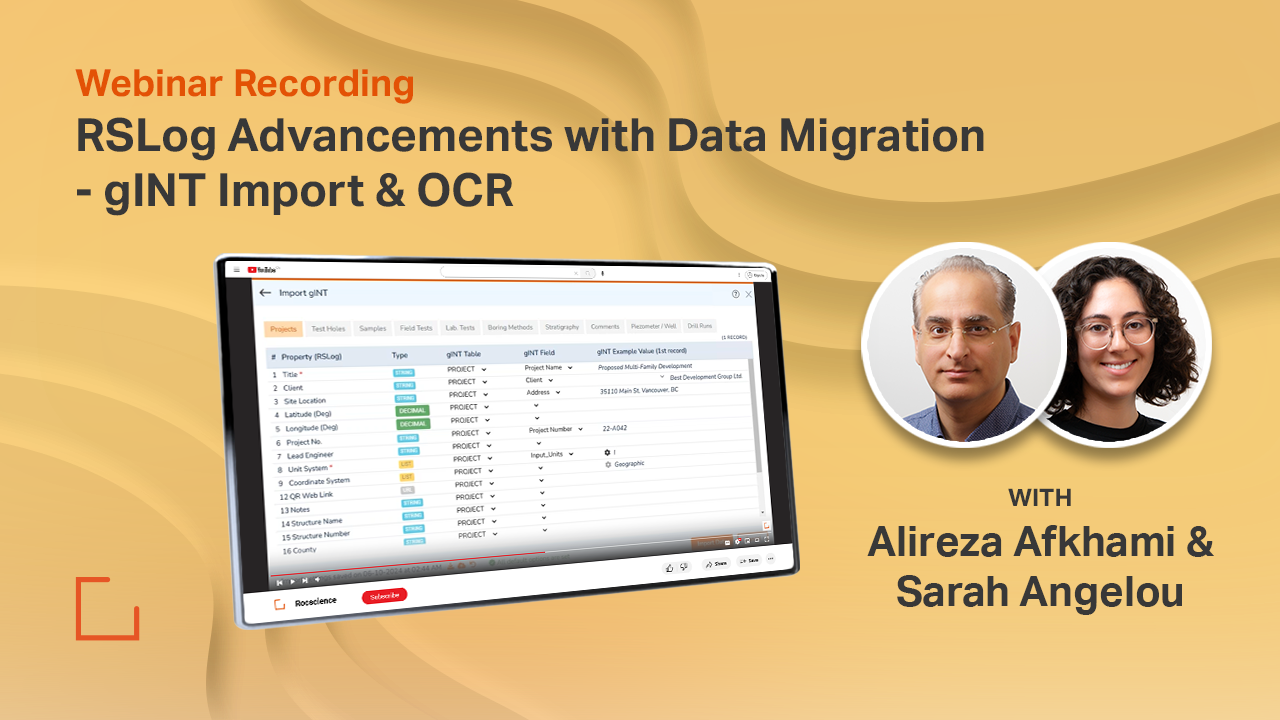
The gINT import feature in RSLog allows you to map your gINT data template to RSLog’s data structure, bringing your historical data to life in your RSLog account. Begin by uploading your gINT file and review the mapping for every data entity (e.g. project, borehole, sample etc.) as depicted below:
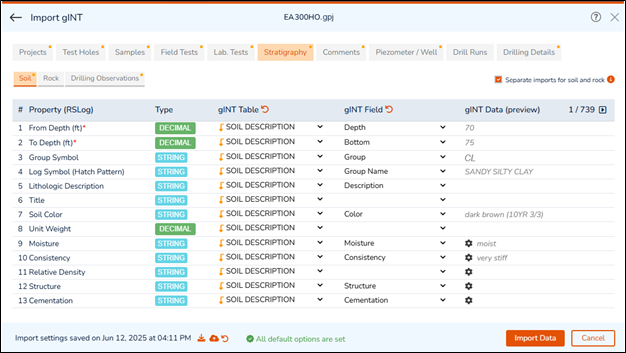
Thanks to our analysis of hundreds of gINT files, this feature is designed to streamline the data mapping by incorporating:
- Separation of data entities by tabs, allows users to focus on the parts of the data that needs to be imported to RSLog. For example, drill runs and drilling details may not be of particular interest if you would like to use your gINT data to establish a slope stability model.
- Clear communication about the data type for each parameter.
- Handling the mapping between list options in gINT and RSLog. For example, if your gINT file uses SS for SPT sample type, you can map this to SPT sample type in RSLog. These types of mapping guarantee proper import of sample and strata details.
Once the data mapping is completed, you are one click away from importing all the boreholes directly to your RSLog account. To save time, RSLog saves your data mapping in your account so you don’t have to go through the mapping next time you upload a gINT file.
Step 2: Creating Cross-Sections In RSLog!
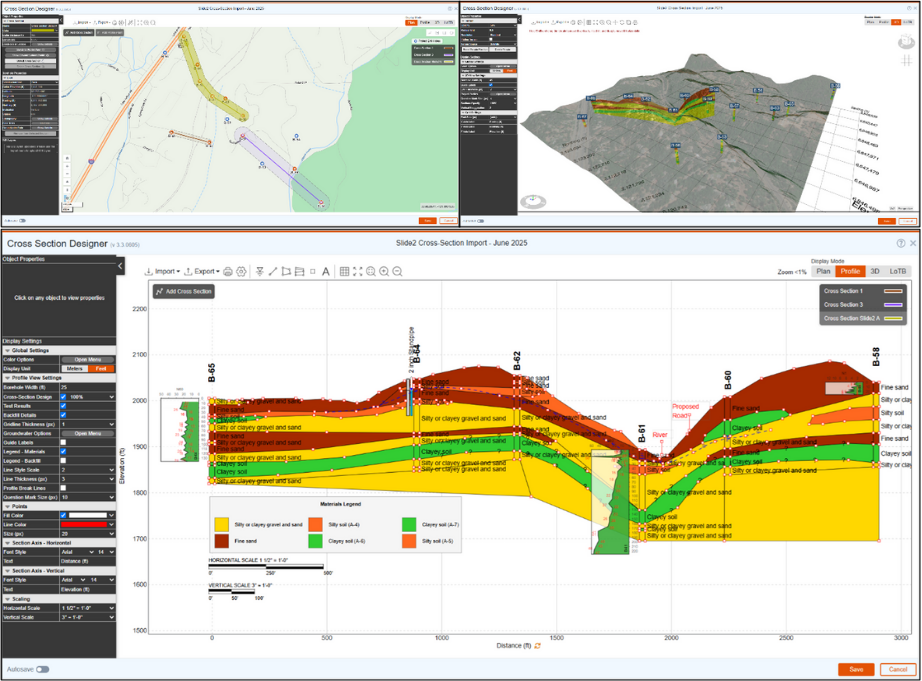
Creating cross-sections in RSLog is a semi-automated procedure that substantially reduces the time required for coordination between the drafting and engineering teams. In this instance, as the borehole coordinates, stratigraphy, SPT blow counts, and groundwater data are imported directly from the gINT file, we can proceed with the creation of cross-sections by following these steps:
- Initiate RSLog’s cross-section designer and establish a section at the desired location for conducting the slope stability analysis.
- RSLog will automatically project the surrounding boreholes onto the centerline of the section, calculating the distances between the boreholes as well as their respective offsets from the section.
- Enable field and laboratory test data for any boreholes with a simple click; RSLog will present this information in the form of a graph or table alongside the boreholes.
- Utilize your engineering judgment and knowledge of the local geology to connect the layers, create lenses, and add the groundwater table as required.
- If you wish to see the cross-sections of this project in a 3D viewer in conjunction with the terrain model, please navigate to the 3D view.
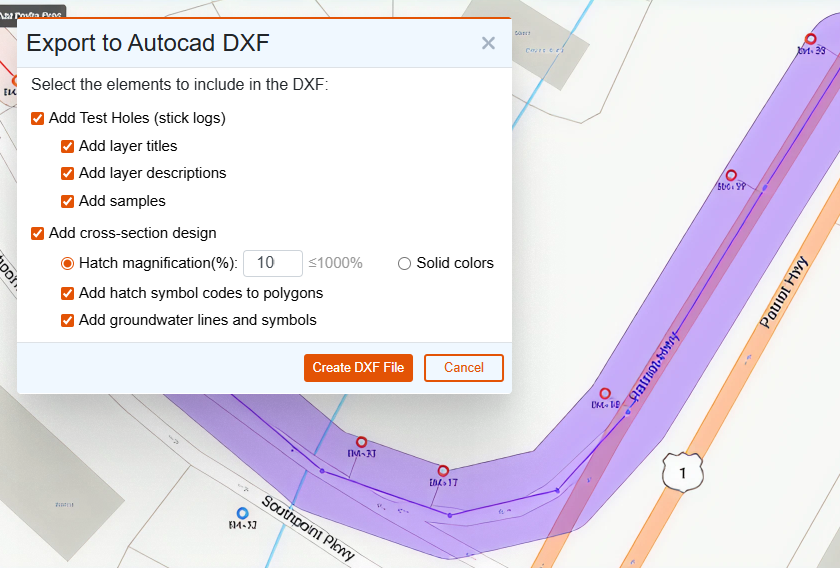
- Save the cross-sections and/or export them to DXF format as necessary. You are ready to import them to Slide2.
The screenshots below demonstrate the process of creating a cross-section that incorporates six boreholes. The objective is to perform a slope stability analysis for a cut on the east bank to facilitate the construction of a new road. The entire gINT import and design of this cross-section can be achieved in less than one hour in RSLog.
Step 3: Importing Cross-Section into Slide2
To perform slope stability analysis in Slide2, cross-sections developed in RSLog can be seamlessly imported and used as soil profiles.
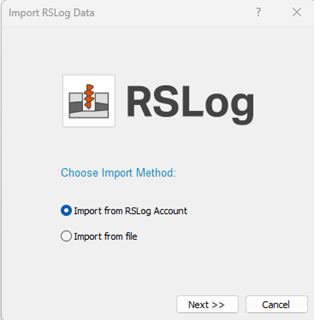
There are two ways to import RSLog cross-sections into Slide2:
- JSON File Export:
Export the cross-section from RSLog as a .json file and import it into Slide2 manually. - Direct RSLog Link:
Use RSLog login credentials within Slide2 to directly access and open cross-sections created in RSLog.
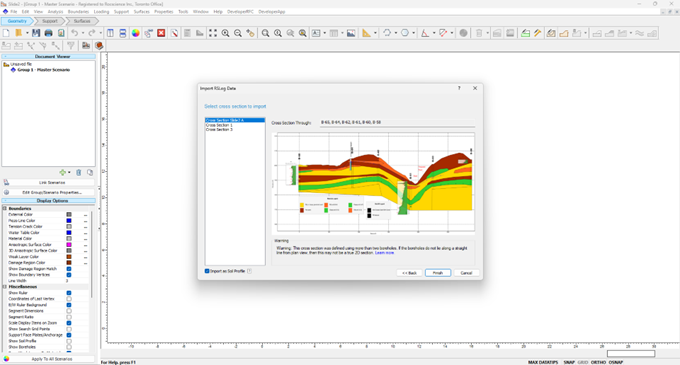
Upon import (via either method), Slide2 will automatically:
- Activate the Soil Profile Mode
- Display the RSLog cross-section as a soil profile in the model
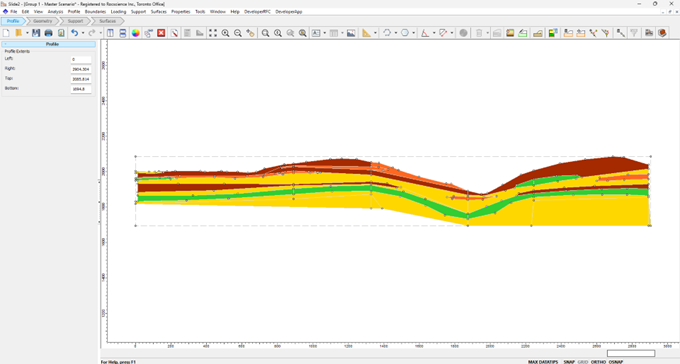
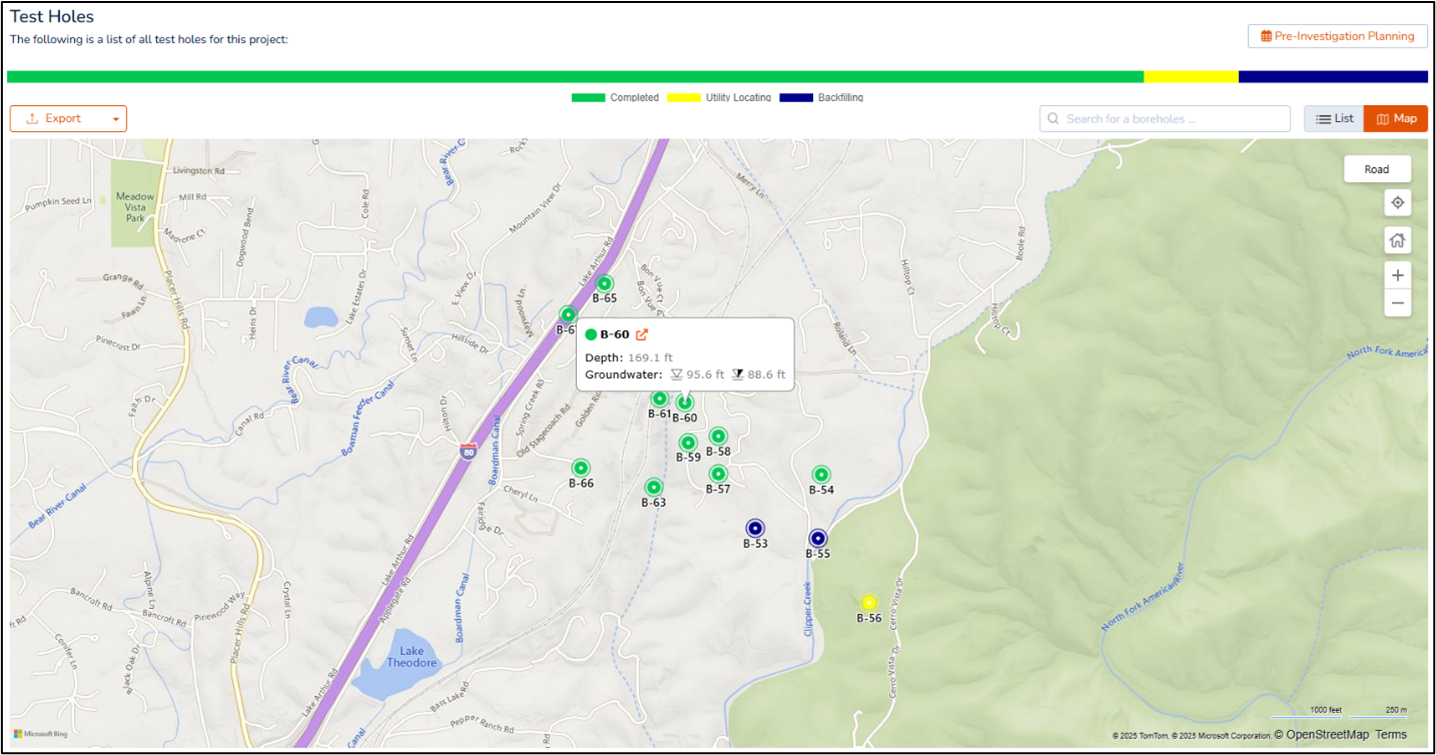
In many geotechnical projects, analysis is limited to a specific portion of the cross-section.
Example: In the current project, the focus is only on the right side of the river.
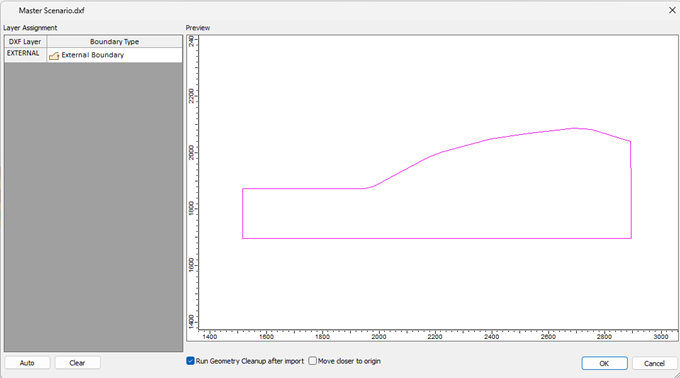
To proceed with the analysis in Slide2, users must define an external geometry over the soil profile.
External Geometry Options:
- Draw Polyline – Manually sketch external boundaries
- Draw Window – Use a rectangular selection
- Import DXF – Load an existing CAD file as external geometry
For this project, a DXF file was available, and it was directly imported to define the external boundary.
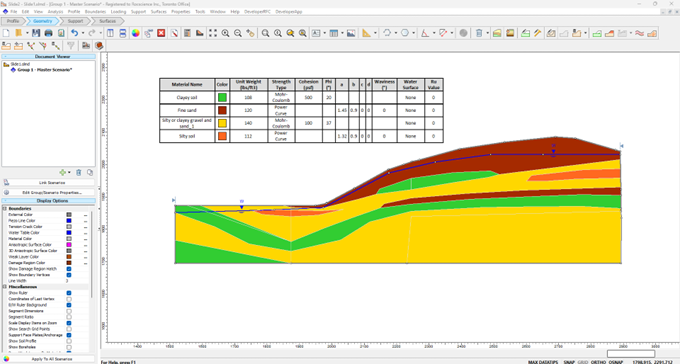
The resulting model combines:
- RSLog-derived soil profile
- Imported external geometry
- Assigned materials (see material properties table)
Step 4: Running Slide2 and Reviewing Results
Selected Analysis Settings to compute slope stability:
- Search Method: Multi-Modal Optimization (MMO) using Particle Swarm Optimization (PSO)
- Analysis Methods: Janbu and Spencer (Limit Equilibrium Methods)
MMO identifies multiple local and global minimum slip surfaces, offering better insight into failure mechanisms.
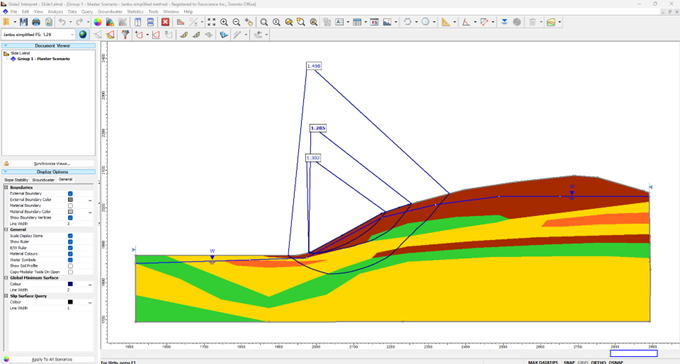
Results Overview:
- Global Minimum FS: 1.28
- Alternative Shallow Surface FS: 1.30
Although FS values are close, the corresponding slip surfaces are geometrically different, highlighting the value of MMO in capturing multiple failure modes.
The Power of the Rocscience Ecosystem
Integrating RSLog with Slide2 streamlines the entire geotechnical modelling process, from the initial import of borehole data to the final slope stability analysis. By leveraging RSLog’s flexible data import tools and intuitive cross-section designer, you can efficiently manage complex site data and quickly prepare robust models for analysis in Slide2. This workflow not only saves valuable time but also reduces errors and enhances collaboration between engineering and drafting teams.
Ready to Streamline Your Geotechnical Workflow?
Getting started with RSLog is simple. Just bring your example borehole logs, and our team will help you add them to your RSLog account. Reach out to us today to schedule a meeting with one of our RSLog experts and see firsthand how easy it is to move from borehole data management to advanced analysis.