Cut Hours From Your Drafting Time With RSLog
Cross-section drafting can be a bottleneck in geotechnical workflows. Between borehole data entry, stratigraphy interpretation, CAD work, and stakeholder review, a single section can take hours of coordination — especially if you're handing data off to a separate drafting team.
In a past webinar, Alireza Afkhami (Rocscience Senior Director of Web Applications) shared how RSLog offers a streamlined approach for cross-section design. With integrated tools for borehole data management, cross-section creation, and 3D visualization — all within a centralized, cloud-based platform — you can manage the entire process without ever leaving the software. The result: fewer handoffs, faster turnaround, and greater control.
Here are five strategies you can use to cut hours from your cross-section workflow with RSLog:
1. Streamline Your Borehole Data to Eliminate Duplication
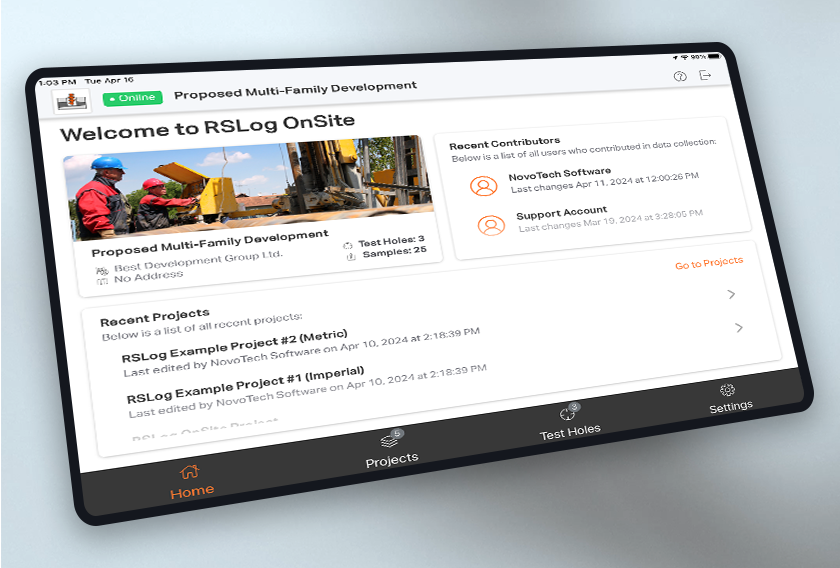
When borehole data is stored in separate spreadsheets or static PDFs, preparing a cross-section often means manually collating stick logs, entering coordinates, and formatting stratigraphy before design can begin. RSLog eliminates this setup time by storing all borehole data in a centralized cloud database that’s instantly accessible to the cross-section designer.
The system supports over 7,500 coordinate systems and performs georeferencing automatically. “We already know the coordinates and elevations of boreholes,” Afkhami explained, “so we can calculate their location behind the scenes and place them correctly on the map to save you time.” Boreholes appear in the correct position on the plan view, with elevations and identifiers already populated — ready to be added to a section with a single click.
By keeping data structured, synced, and GIS-ready from the start, RSLog removes the need to reformat logs or transfer files. This speeds up the drafting process and ensures cross-sections are always built on the most current and complete dataset.
2. Design Cross-Sections Without Relying on CAD
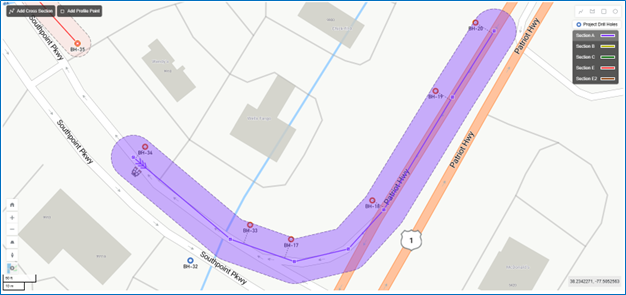
RSLog gives engineers the ability to draw cross-section lines directly on a GIS map and immediately generate projected boreholes along the section. From there, you can manually connect layers using your engineering judgment and the knowledge of local geology of the site — no CAD drafting required.
“You draw the cross-section line, and RSLog automatically projects all nearby participating boreholes onto the center line and even calculates their offsets,” Afkhami noted. This eliminates manual distance measurement and borehole placement. Engineers can then connect stratigraphic layers using point-and-click tools, applying their own geological interpretation.
3. Automate Repetitive Tasks, Without Replacing Judgement
RSLog doesn’t try to interpret your geology for you. “We don’t want the program to connect the layers together for us,” Afkhami says, “We should combine engineering judgment with local geology knowledge and experience.”
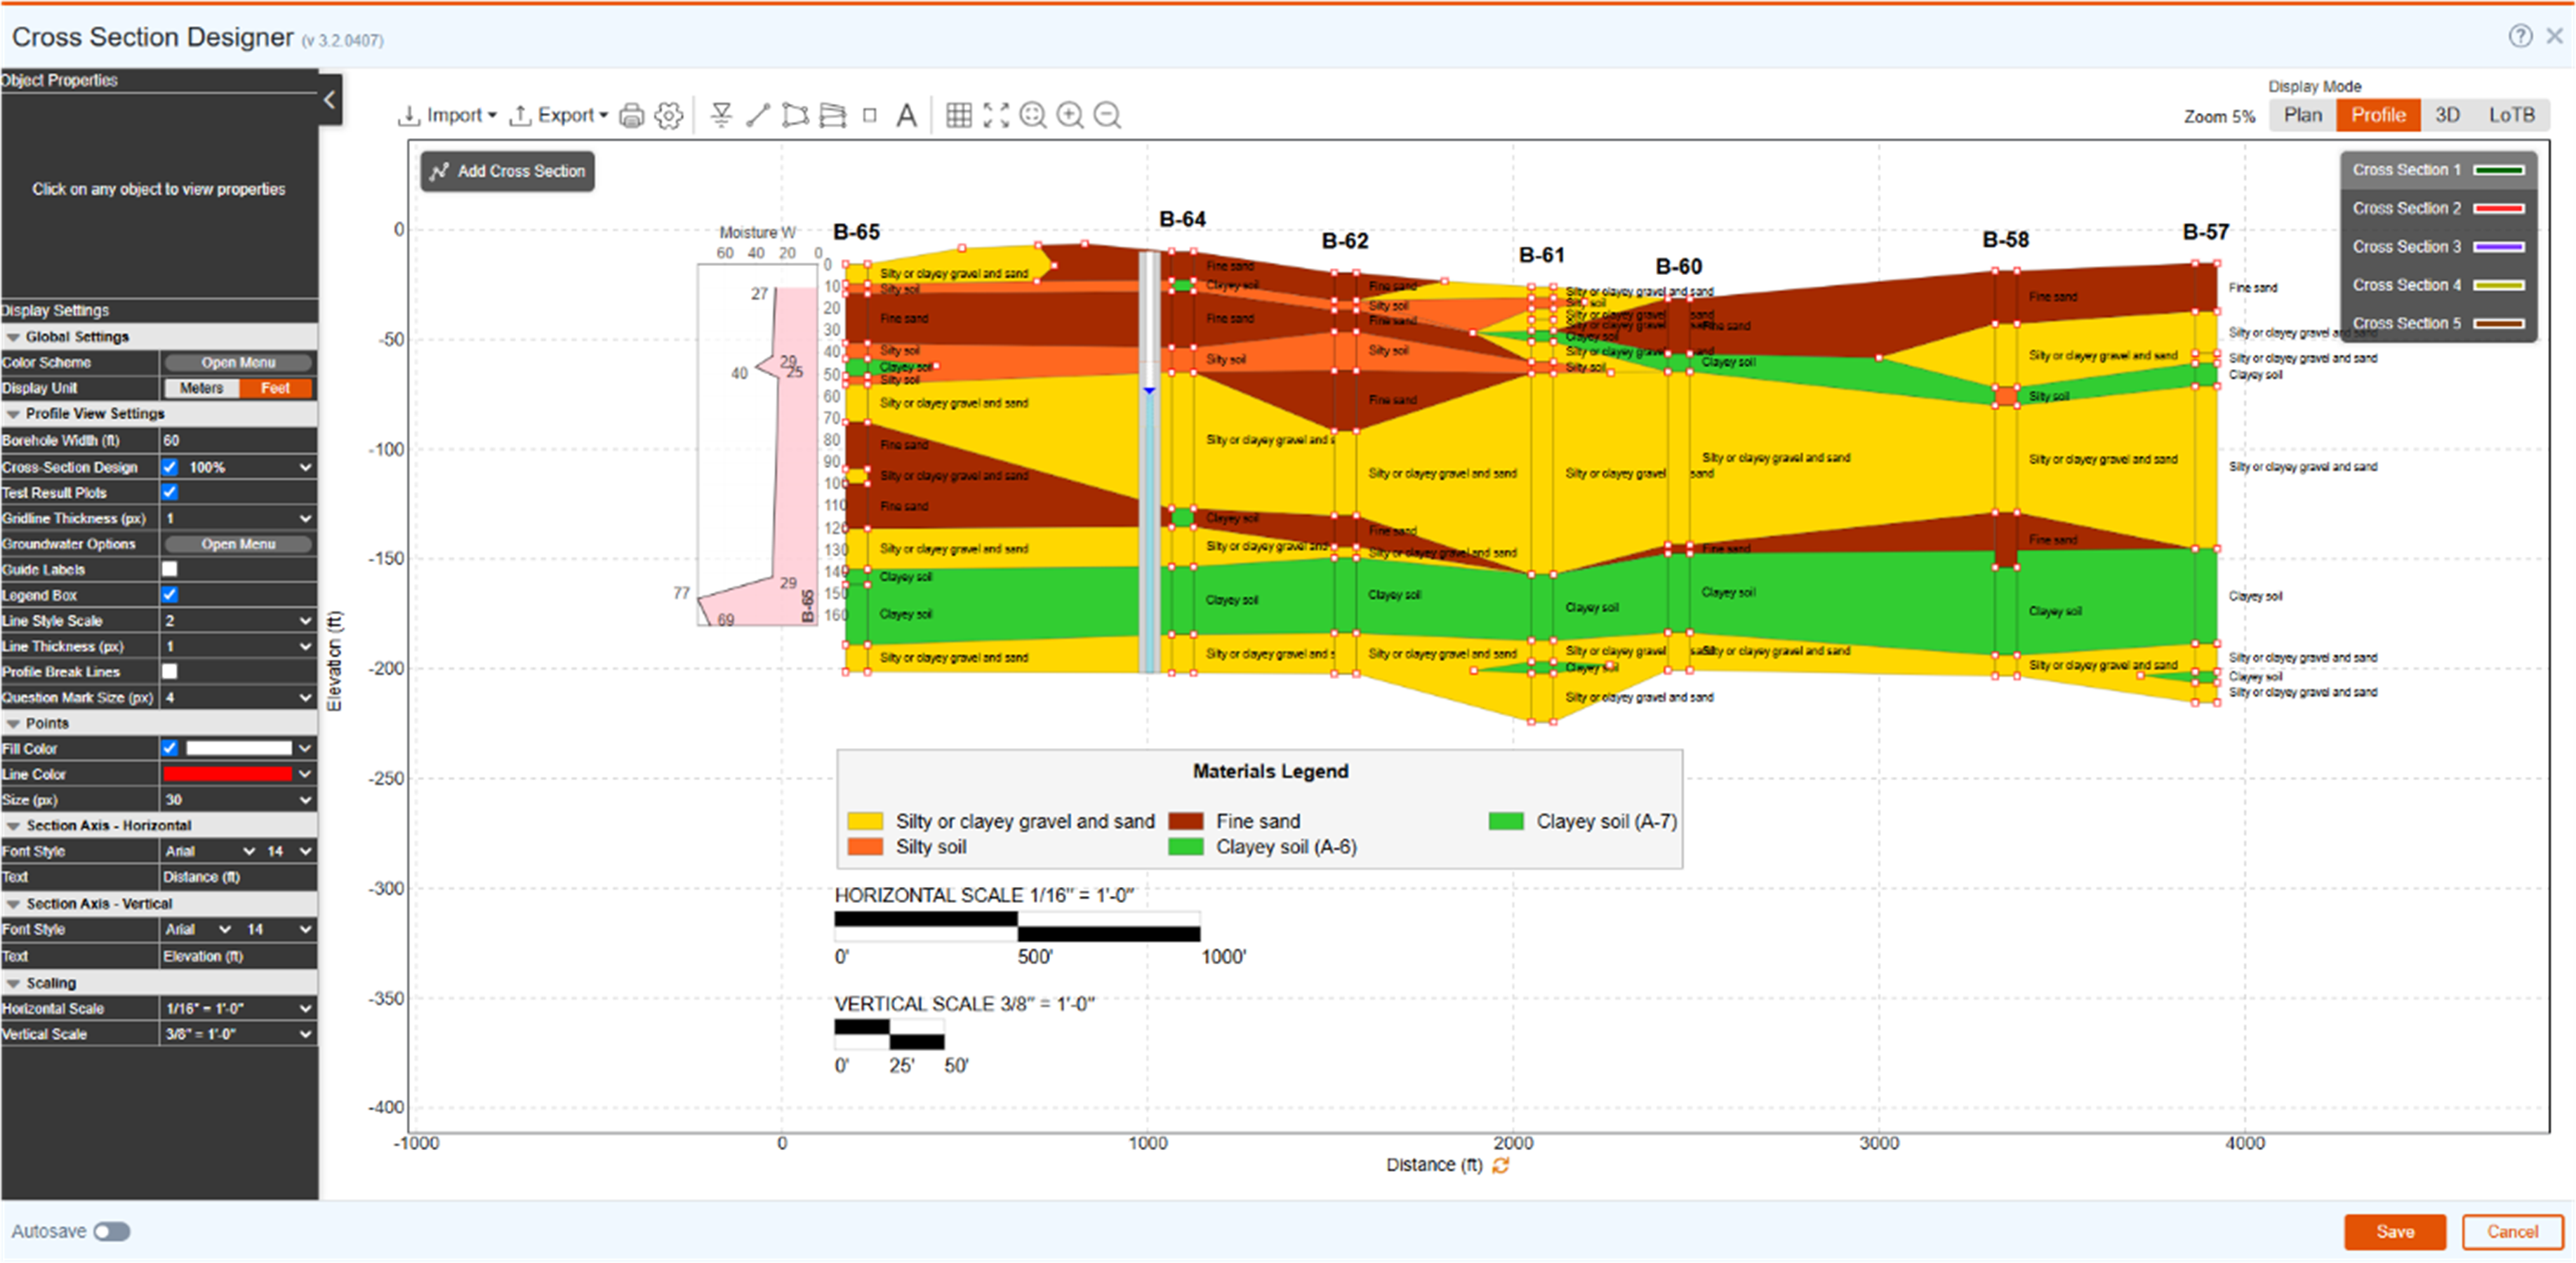
Instead, it automates the mechanical aspects of design so you can focus on the subsurface conditions themselves. Borehole alignment, offset calculations, test data plotting, and piezometer markers are handled programmatically.
Engineers can overlay field or lab test data such as SPT, CPT, or Atterberg limits using customizable graphs or tables. Display settings are fully adjustable, and hatch patterns can be assigned using established classification systems like USCS, AASHTO, and AGS. The combination of automation and customization allows teams to move efficiently through cross-section creation.
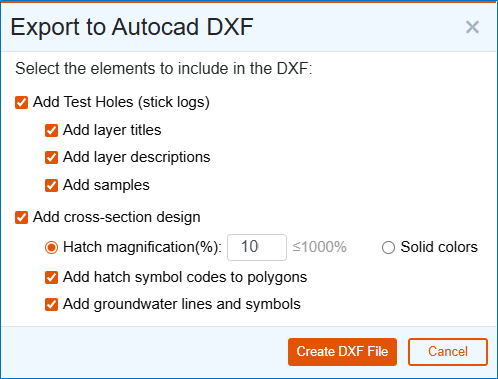
4. Exporting to DXF, Google Earth, or Civil 3D, Instantly
Once your cross-section is complete, you can export it directly to DXF with proper scaling and layering. You can also export all cross-sections and boreholes to Google Earth using KML or KMZ files — ideal for quick reviews or overlaying with other spatial data. Everything from layer boundaries to hatch patterns, borehole labels, and test data is included in the export.
Afkhami highlighted recent performance improvements: “We’ve improved DXF export performance in the past few months — it now takes just a few seconds to generate a scaled, layered file.” He added that “Typically, maybe 20% of the time that the drafting department spends on cross-section design — that’s all they need now, as they’re just finalizing.” In other words, RSLog completes the bulk of the drafting work, allowing CAD teams to focus on fine-tuning and formatting rather than starting from scratch. Turnaround can be much faster — especially on projects with frequent revisions or tight deadlines.
5. Collaborating in Real Time Across Teams and Locations
Because RSLog is cloud-based, all data and cross-section designs are synced in real time. If your colleague in the field updates borehole logs using the OnSite mobile app, you’ll see the changes instantly reflected in your section — even if you’re working remotely.
“If your colleague updates the borehole data… next time you load the cross-section, the design is updated to reflect your borehole data,” Afkhami explained. For example, updates to stratigraphy, water levels, or test results are automatically pulled into existing cross-sections, so there’s no need to reload or recreate designs — you’re seeing the most current version.
This real-time syncing enhances collaboration across disciplines and locations, making RSLog especially well-suited for distributed teams or high-volume workflows.
Less Time on Formatting, More Time for Engineering
With RSLog, you no longer have to rely on a separate drafting team to visualize your borehole data. You can manage your own cross-section designs backed by automated geospatial tools and real-time collaboration.
By reducing manual drafting time and eliminating redundant data entry, RSLog streamlines your workflow — so you can spend more time analyzing, interpreting, and delivering results.