6 - Leshchinsky Method and Tension Map Analysis
1.0 Introduction
This tutorial demonstrates the application of the Leshchinsky Method and Tension Map Analysis feature option in RSWall in conjunction with Slide2.
The analysis follows the procedure developed by Leshchinsky (2016; 2017) and adopted in AASHTO (2020; 2024) for determining the maximum tensile forces experienced in geosynthetic supports using a Limit Equilibrium Analysis (LEA).
The results of this tension map can be imported into RSWall for internal stability analysis, enabling the design and optimization of reinforcement layouts.
Before starting, it is recommended to complete RSWall Tutorial 1 – MSE Wall to become familiar with the basic wall modeling process.
Topics Covered:
- MSE Wall Design and Analysis
- Geosynthetic Supports
- Overall and Compound Stability analysis
- Leshchinsky Method and Tension Map Analysis
Finished Product:
The final model for this tutorial is located in the Tutorial 6 folder. All tutorial files installed with RSWall can be accessed by selecting File > Recent Folders > Tutorials Folder from the RSWall main menu.
1.1 Background
According to AASHTO 2020/2024 Article 11.10.5.6, Limit equilibrium analyses (LEA) shall be used to evaluate compound stability for MSE walls, particularly those with complex geometry. Three analysis steps are to be conducted once an initial wall design is completed:
- Estimate nominal load in each reinforcement layer T_max using a load and resistance factor combination of 1.0.
- Adjust reinforcement design accordingly to meet limit states requirements with specified load factors.
- Check factored design using LEA with factored load and resistance values.
The procedure is based on the work of Leshchinsky et al. (2016, 2017) and implemented here using the Tension Map feature in Slide2.
The example in this tutorial is adapted from Example 1 in the 2016 FHWA report FHWA-HIF-17-004, Section 10.2, though results may differ due to variations in geometry, search methods, and calculation methods.
2.0 Getting Started
- Select File > Recent Folders > Tutorials Folders to open the tutorials folder.
- Select Tutorial 6 Tension Map – starting file.rswall and click Open.
3.0 Project Settings
- Select Home > Project > Project Settings
 from the toolbar.
 - Select the Design Standard tab and ensure the design standard is AASHTO (2020) and Extreme and Serviceability are deselected.
- Go to the Failure modes tab and, from the Internal Stability tab, deselect Crest toppling . We are mainly interested in reinforcement capacity.
- Select the Methodology tab and ensure the Active pressure method is Coulomb method and Tension in reinforcement is the Simplified method.
- Click OK to close the dialog.
4.0 Soil properties
- Select Soil > Soil Conditions > Define Soil Properties
 in the toolbar.
 In the Define Soil Properties dialog, ensure the following soil properties are defined in the table below:
Name Unit Weight (lbs/ft3) Friction Angle (o) Soil-Structure friction Angle (o) Long Term Cohesion (psf) Backfill 120 30 15 0 Reinforced Soil 125 34 17 0 Foundation 110 28 14 0 - Click OK to close the dialog.
5.0 Reinforcement Properties
- Go to the Loading and Support ribbon.
- Select Loading and Support > Reinforcement > Define Properties and ensure the reinforcement has the following properties in different tabs:
Strength | |
| Allowable Tensile Strength (static) | 2016.33 lbs/ft |
| Coverage | 100% |
| Creep Factor | 2.0086 |
| Secant Stiffness | 2016.33 (lbs/ft) |
Soil Interaction | |
| Interface sliding friction angle | 28 degrees |
| Pullout Method | Coefficient of Interaction |
| Coefficient of Interaction | 0.64 |
| Alpha Coefficient | 1.0 |
Connection | |
| Connection function | Constant |
| Connection strength | 3000 lbs/ft |
The layout has already been added for convenience.
6.0 Compute and Export to Slide
- In the Results ribbon, select Results > Compute > Compute
 in the toolbar.

When viewing results, we notice the governing CDR is the tensile strength of the bottom reinforcement, yielding a CDR of 1.22.
At this point, the RSWall model can be exported to Slide2 to check overall and compound stability, and then brought back into RSWall once computations are complete. Alternatively, the completed version of the Slide model can be found in File > Recent Folders > Tutorials Folder but it must be opened directly in Slide2.
Section 11.0 Slide2 Tension Map analysis (below) provides a step-by-step guide for modeling and analyzing the Slide2 file. However, a completed model file is also available for immediate use. In either case, ensure that the Slide2 model to be used for this tutorial has been fully completed and computed (Analysis > Compute). Results can be viewed in Analysis > Interpret. For this tutorial, it is only necessary to confirm that the computation has been successfully completed.
7.0 Import Tension Map Results into RSWall
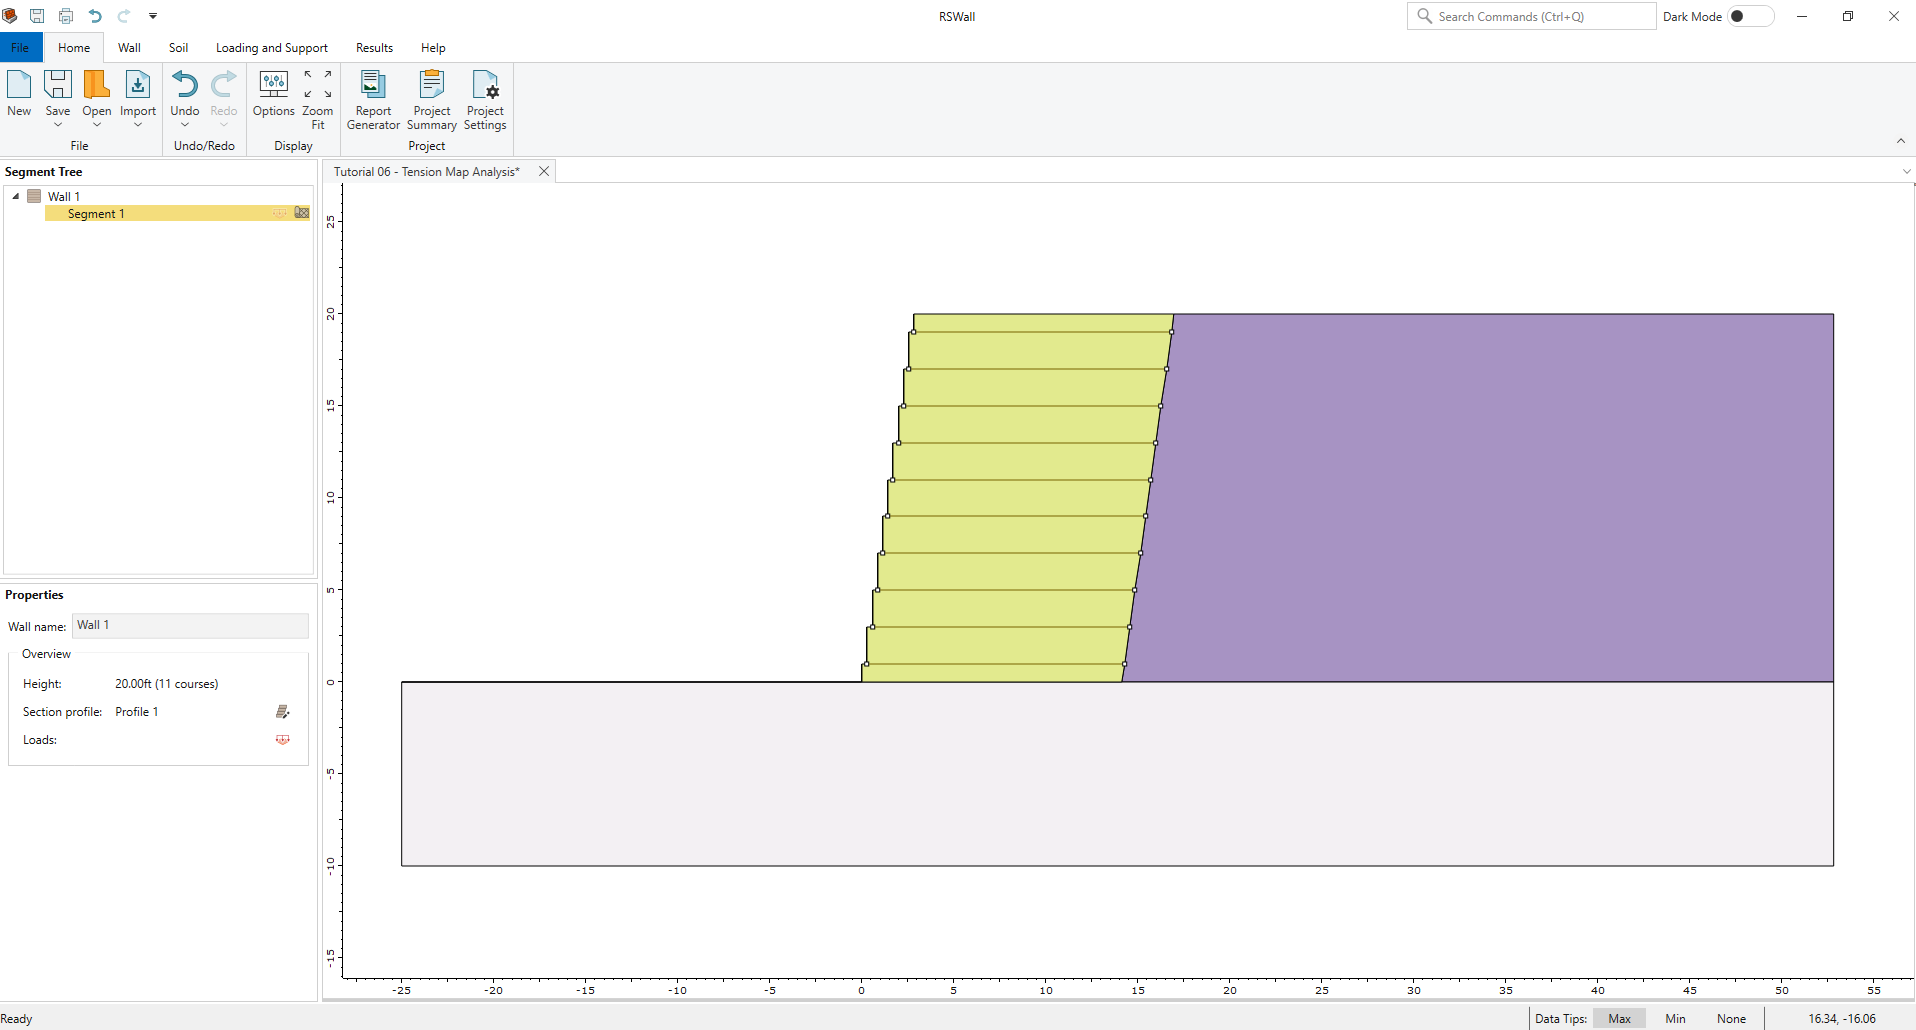
Returning to the original RSWall file, we now import the completed slide model.
- In the Results ribbon, select Tension Map > Import from Slide2
- In the dialog, click Import and select the computed Slide2 file (if using the one provided, select Tension Map Analysis.slmd in the Tutorial 6 folder). Click Open.
- For Segment 1, select Segment 1 - Master Scenario - bishop simplified as the analysis.
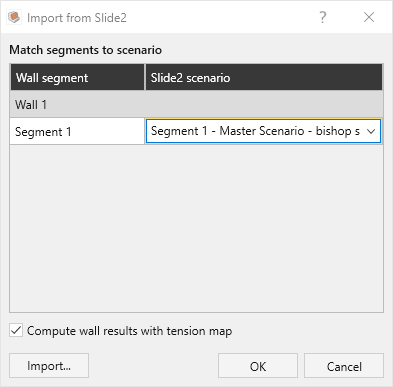
The dialog allows you to assign a variety of results to any segment you wish. However, be aware that if at any point there are any import issues, such as missing data or a mismatch of support geometry, warnings will appear notifying you which segments could not find a match.
- Once assigned, ensure the checkbox for Compute results with tension map is selected and click OK. The segment(s) have now been assigned results from Slide2 and we can now recompute with this new data.
8.0 Recomputing with LEA results
- In the Results ribbon, select Compute > Compute in the toolbar.

The tensile forces imported from Slide2’s Tension Map Analysis fall between the higher demands observed near the bottom of the wall and the lower forces at the very top. Notably, the top reinforcement now shows a capacity–demand ratio (CDR) below 1.0 for pullout, indicating insufficient pullout resistance for the force required by the compound stability analysis to maintain a factor of safety of 1.0. Although tensile failure often governs the design, in this case the required tensile force exceeds the available pullout capacity. As a result, a redesign of the reinforcement configuration, such as increasing reinforcement length, reducing spacing, or selecting stronger materials, may be necessary.
9.0 Summary
This tutorial demonstrated the use of Tension Map analysis tool from Slide2 to perform both overall and compound stability checks, helping verify whether the internal reinforcement design is adequate. While this example focused on adjusting the tensile strength of the supports, it is important to recognize that this is only one of several possible redesign strategies. Other approaches may include increasing the reinforcement length, reducing spacing, or adding additional layers, depending on the model conditions and engineering constraints.
Lastly, the information provided by the tension map is used in a compound stability analysis as outlined in AASHTO for RSWall. In this scenario, the unfactored tensile forces determined using the tension map results are imported into RSWall and factored as the new maximum tensions to ensure internal stability design continues to be sufficient provided the new results from an overall stability analysis. A final overall stability analysis with applied factors may also be required to verify overall stability.
10.0 References
Leshchinsky, D., Kang, B., Han, J., Ling, H., Framework for Limit State Design of Geosynthetic-Reinforced Walls and Slopes, Transportation Infrastructure Geotechnology, March 2014, pp 129-164.
Leshchinsky, D., Leshchinsky, B., Leshchinsky, O., Limit state design framework for geosynthetic-reinforced soil structures, Geotextiles and Geomembrances, August 2017, pp 642-652.
Leshchinsky, D.,Leshchinsky, O., Zelenko, B., Horne, J., Limit Equilibrium Design Framework for MSE Structures with Extensible Reinforcement, Federal Highway Administration, October 2016.
11.0 Slide2 Tension Map Analysis
As mentioned above, this section outlines the steps for creating and analyzing tension map results in Slide2. For more information, see the Slide2 Tension Map help topic.
11.1 Slide2 Model
- In RSWall, select Results > Export > Export to Slide2
- Select Segment 1.
- Click Open in Slide2. The Slide2 program will launch.
- Select the location to save the Slide2 file, enter the name Tutorial 6 - Tension Map Analysis and click Save.
11.1.1 Project Settings
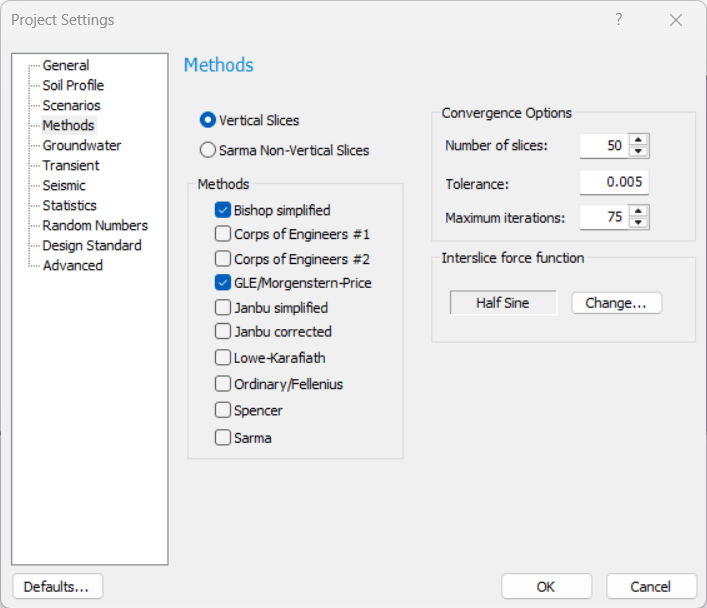
- Select Analysis > Project Settings

- Go to the Methods tab and ensure Bishop and GLE are selected and Janbu is deselected.
- Click OK to close the dialog.
11.1.2 Material Properties
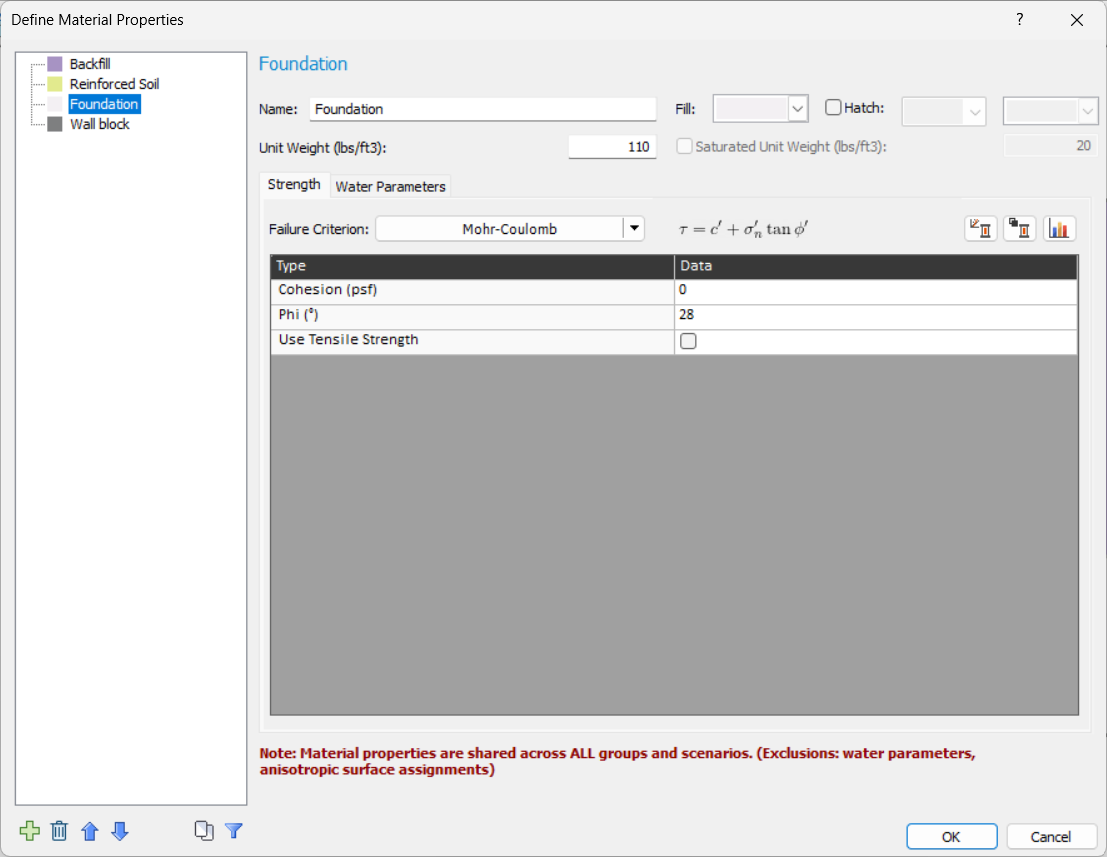
- In the Segment 1 scenario, select Properties > Define Materials and ensure the below materials have the following properties:
| Name | Cohesion (psf) | Phi (degrees) | Unit Weight (lbs/ft3) |
| Backfill | 0 | 30 | 120 |
| Reinforced Soil | 0 | 34 | 125 |
| Foundation | 0 | 28 | 110 |
11.1.3 Slope Limits
- Right-click on the existing slope limit and select Define Limits (or select Surfaces > Slope Limits > Define Limits).
- Check the box for Second set of Limits and ensure the coordinates are set to the following:
Limits | |
| Left x coordinate | -25 |
| Right x coordinate | 2.833 |
Second set of limits | |
| Left x coordinate | 2.833 |
| Right x coordinate | 52.833 |
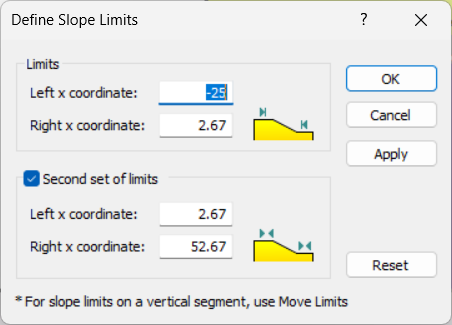
- Alternatively, move the second slope limits such that they are at the top-left corner of the reinforce soil material such that they look like the following:

11.2 Define Support Properties
- Select Properties > Define Support
- Select the Reinforcement 1 support and ensure the support type is a geosynthetic with the following properties:
General | |
| Force Application | Active (Method A) |
| Force Orientation | Parallel to reinforcement |
| Strip Coverage | 100% |
| Allowable Tensile Strength | 100 lbs/ft |
Pullout and Stripping | |
| Anchorage | Slope Face |
| Connection Strength Input | Constant |
| Connection Strength | 3000 lbs/ft |
| Input Type | Coefficient of Interaction |
| Coefficient of Interaction | 0.64 |
| Material Dependent | No |
| Use external loads in strength computation | Yes |
Design Factors (Applied) | |
| Design factors applied to this support | AASHTO 2020 – STR. 1 User Defined from RSW |
The high connection strength and anchorage at both ends is meant to ensure that failure will not occur with stripping or pullout for the purposes of this example. It is important to note that the allowable tensile strength does not affect the tension map results but will continue to run a separate LEM analysis. We can use this to our advantage when we redesign the support.
11.3 Setting up the analysis
11.3.1 Surface Options
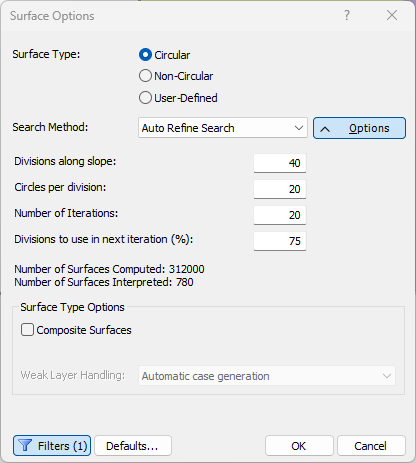
Although the original example uses Bishop’s method with log-spiral shaped surfaces, we will use a circular surface type and the Auto Refine Search method.
- Select Surfaces > Surface Options.
- To achieve a thorough search, we change the Search Method options by clicking Options and changing the settings to the following:
| Divisions Along Slope | 40 |
| Circles per Division | 20 |
| Number of Iteration | 20 |
| Divisions to use in next iteration | 75 |
- In the Filters option, set a minimum area of 20 ft2 in order to eliminate small, irregular surfaces due to the cohesionless material. Ensure the checkbox is selected.
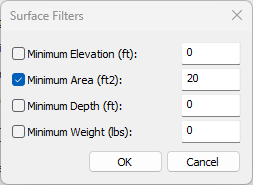
- Click OK twice to close both dialogs.
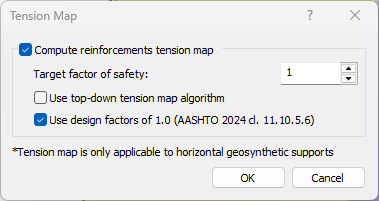
11.3.2 Tension Map Settings
- Go to Support > Tension Map
- Select the Compute reinforcements tension map checkbox and ensure the Target factor of safety is 1.0 and click OK.
11.4 Computation and Interpretation
- Run the analysis by selecting Analysis > Compute

- When computations are done, open the Interpreter by selecting Analysis > Interpret

When viewing the results, we can see that a failure is occurring within the reinforced zone, indicating the reinforcement strength is insufficient. Furthermore, when we select Data > Show Support Force Diagram we notice that the tensile strength is still the governing failure mode for the global minimum surface.
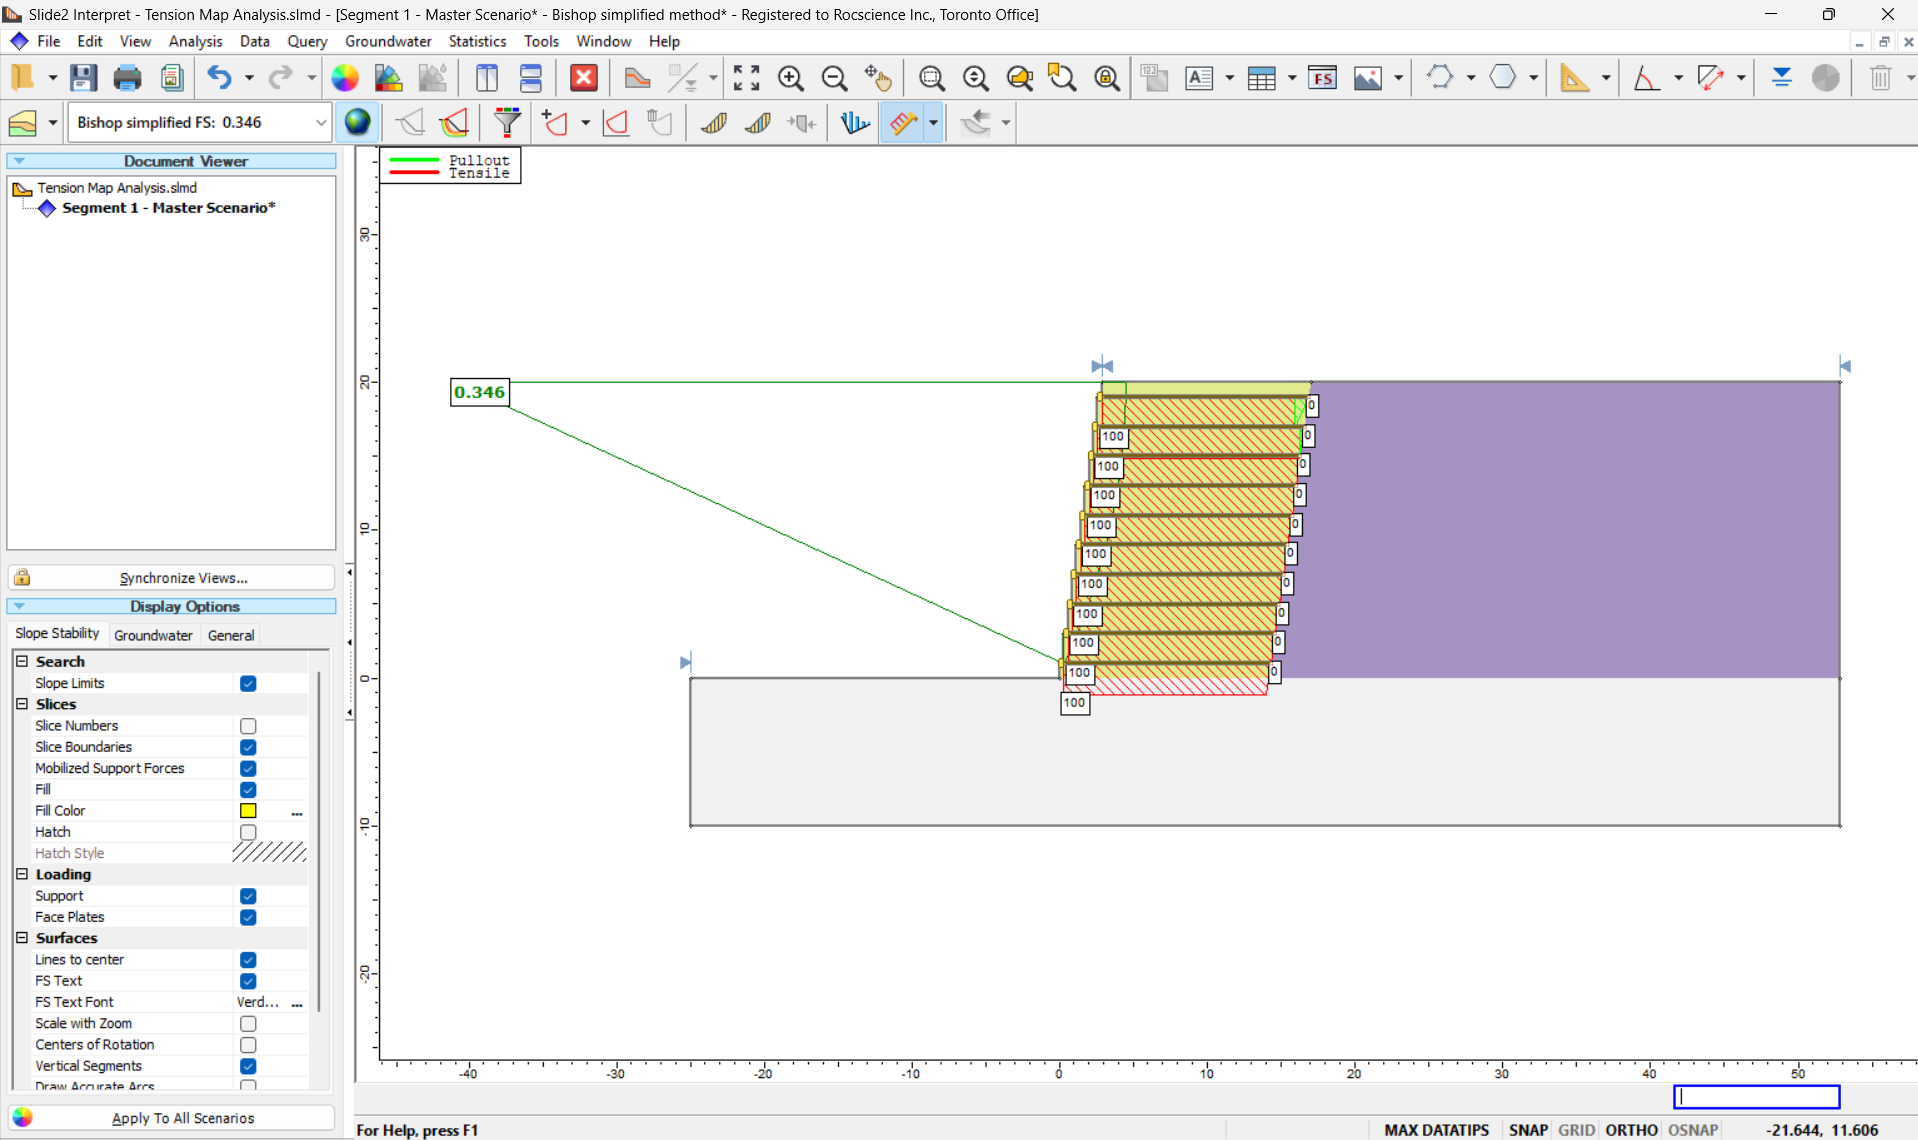
While iteration can be used, the tension map results can provide insight into how one might redesign support tensile strength to ensure a sufficient factor of safety.
When we select Data > Show Support Tension Map, we notice that the maximum tension experienced by the supports is approximately 715 lb/ft for Bishop and approximately 575 lb/ft for GLE.
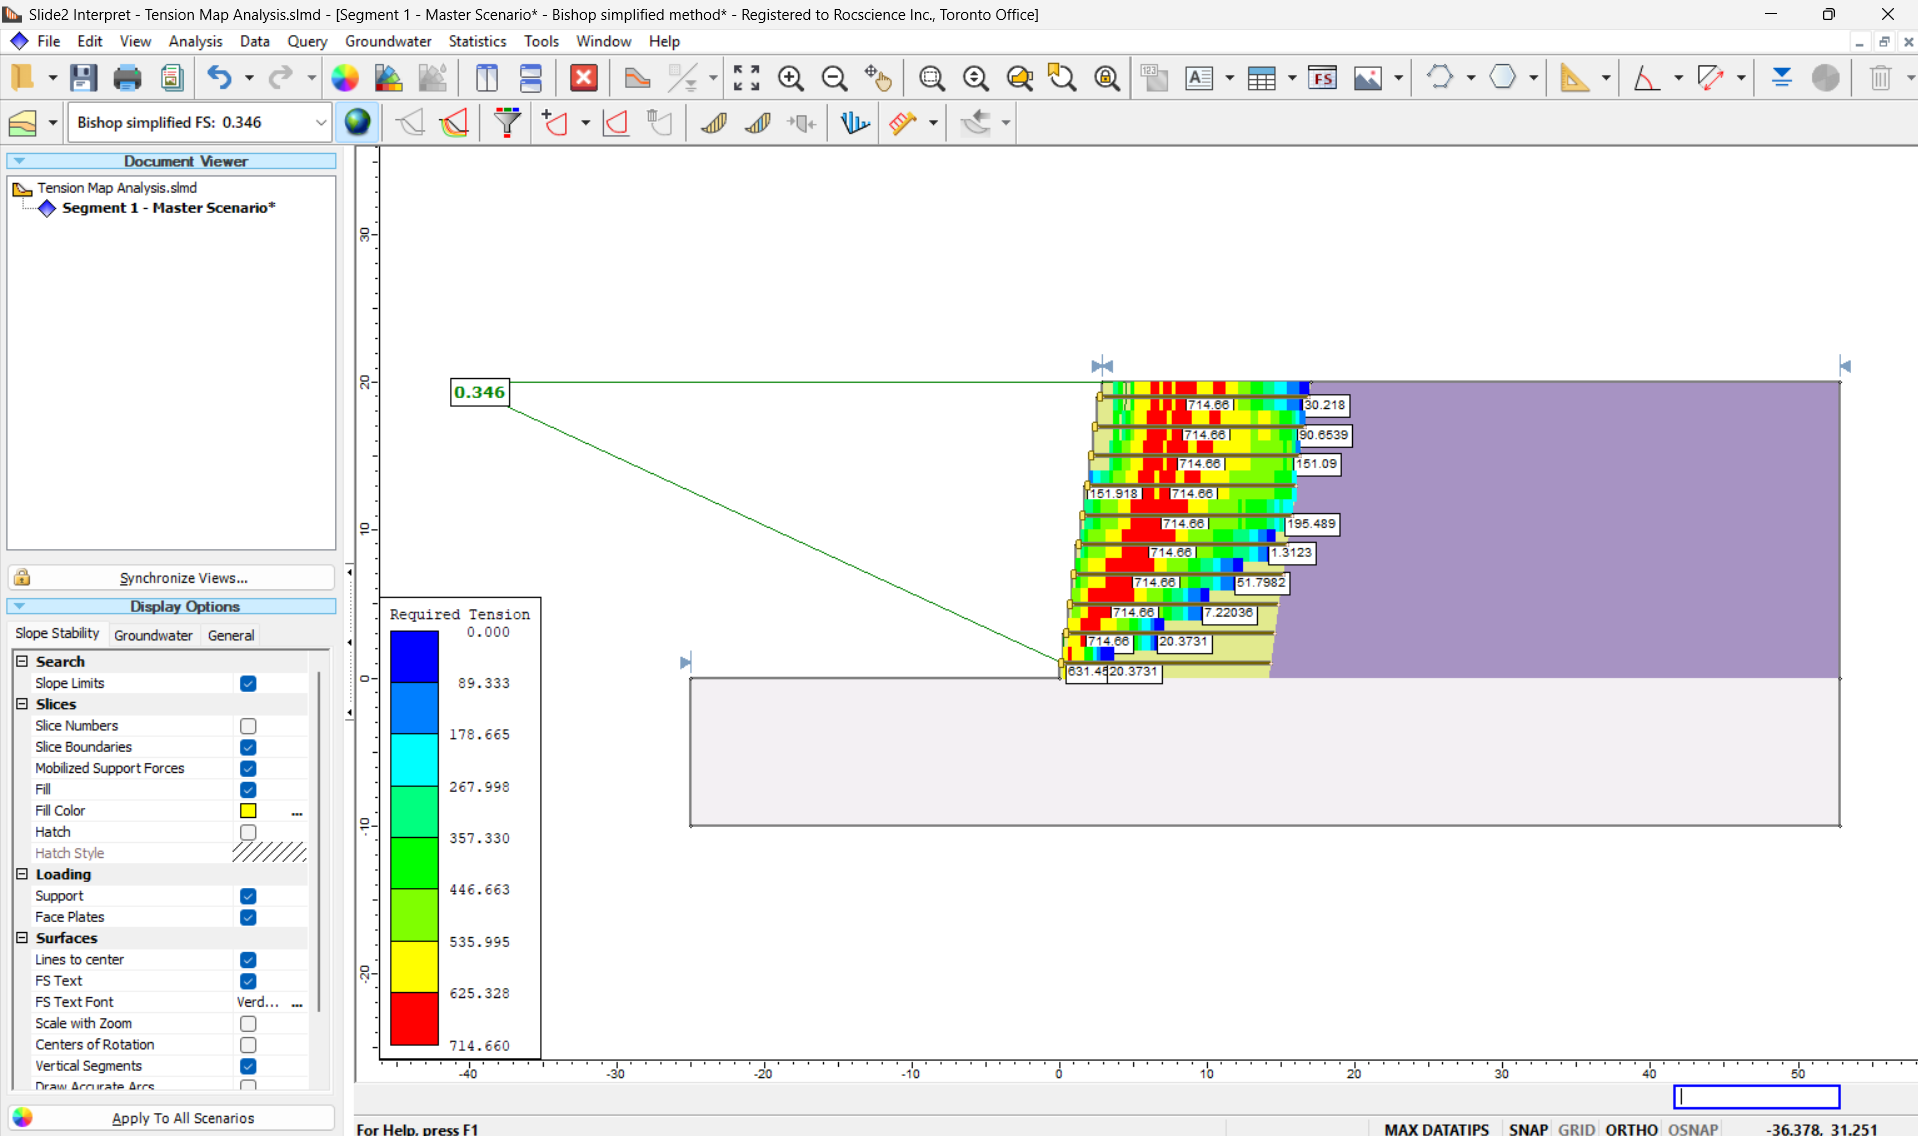
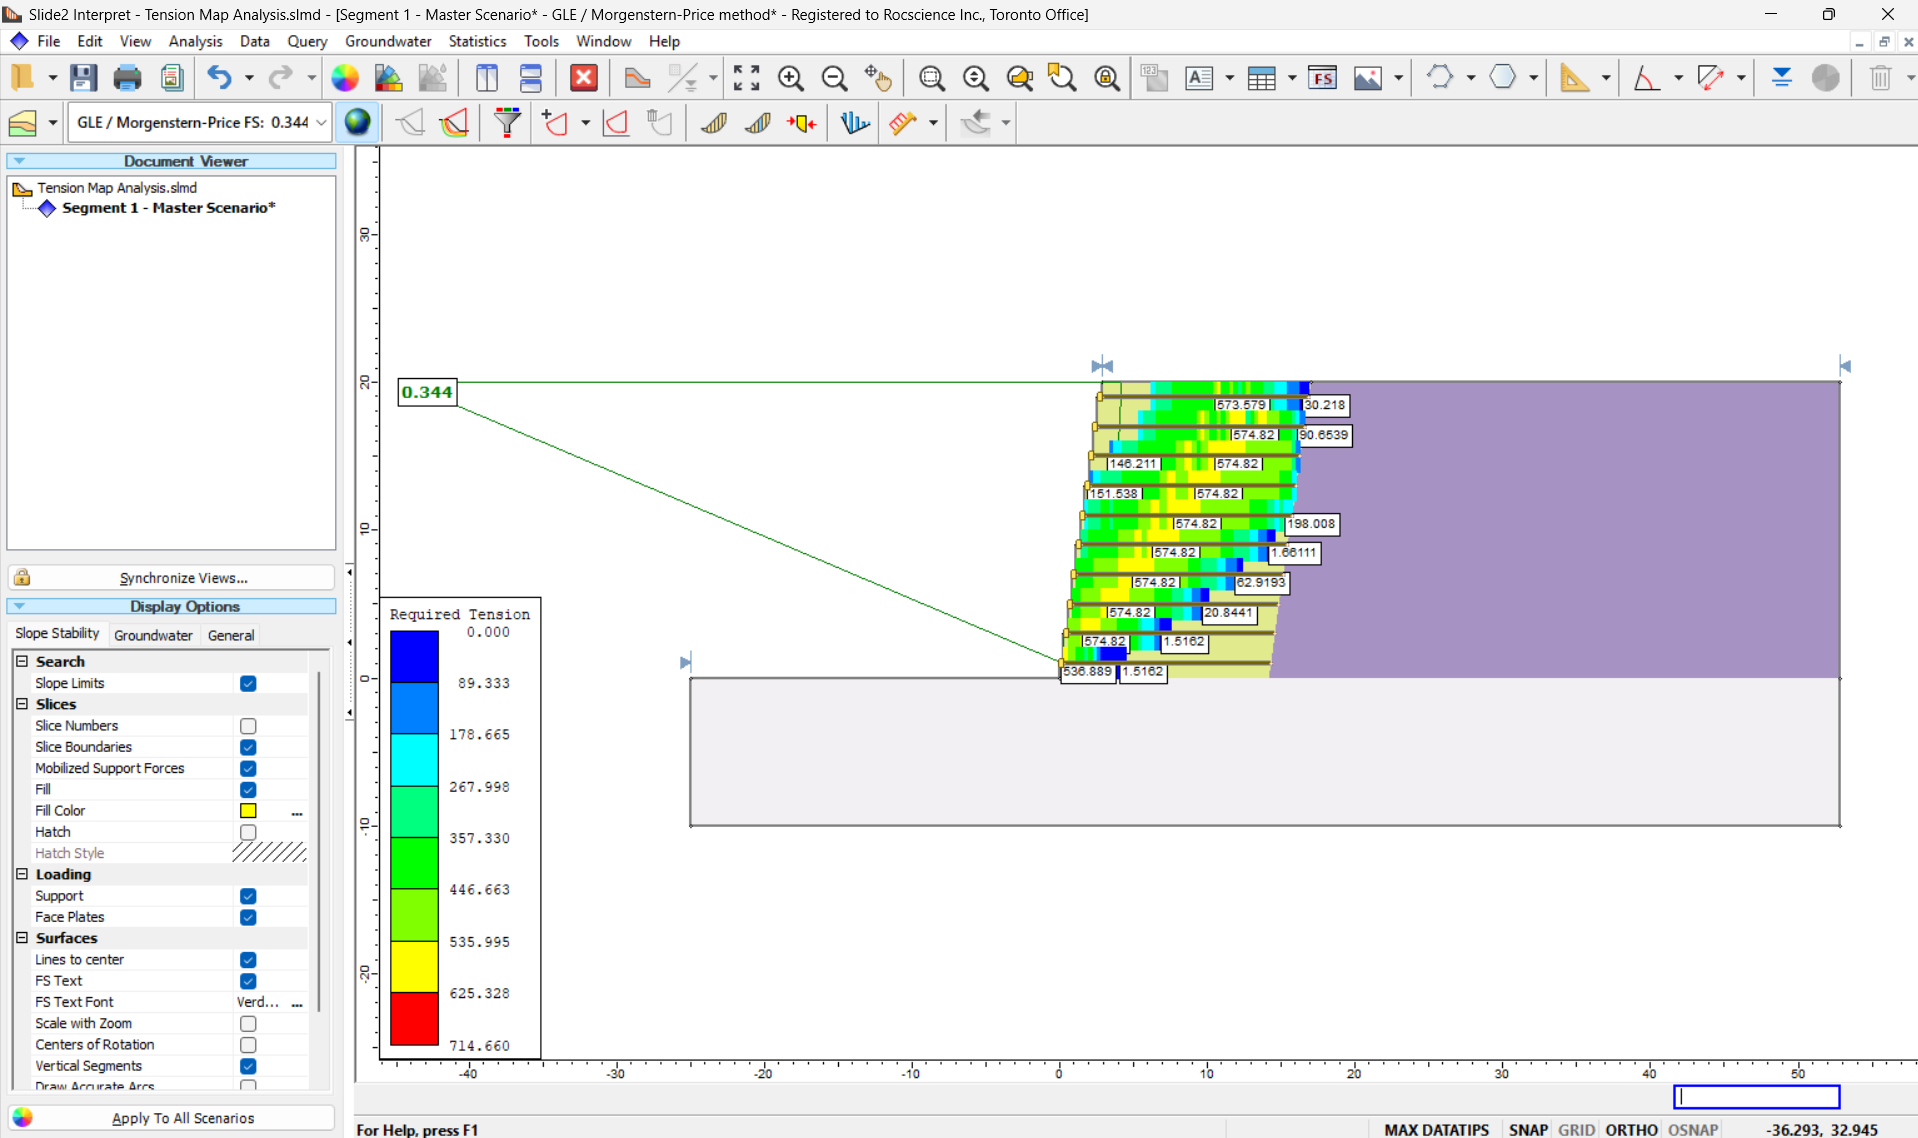
From these results, we learn the following.
- The tensile forces are similar to the original example but far exceeds our current tensile strength. A redesign is required to ensure the wall isn’t failing.
- It is important to consider other slope methods including ones considering full equilibrium such as GLE, as there may be a significantly different tension map result that results in a different final design.
We will redesign the support strength for the Bishop case.
11.5 Support Redesign
- Return to the modeler and open Support Properties once again (select Properties > Define Support).
- In the circular scenario, change the Allowable Tensile Strength of the Geosynthetic Reinforcement to 1000 lbs/ft after accounting for the factored tensile strength.
11.6 Computation and Interpretation (After Redesign)
- Run the analysis (Analysis > Compute) and open the Interpreter (Analysis > Interpret) when computations are done.
For the circular scenario and Bishop, the new redesign essentially achieves the FS of 1.0 initially specified. Thus, we can confirm that the tensions are the maximum tensions the support can expect.

11.7 Non-circular Analysis
It is important to consider a non-circular analysis which often provides a lower factor of safety and surface shape and thus a different required tensile force. Furthermore, both the slope and searching method also play a part in determining a solution.
For example, the following tension map analysis uses a non-circular analysis using GLE method and Particle Swarm Optimization (PSO). We find that the tensile force is different compared to the circular analysis results. As such, it is important to consider non-circular searching in order to verify the stability of the wall.
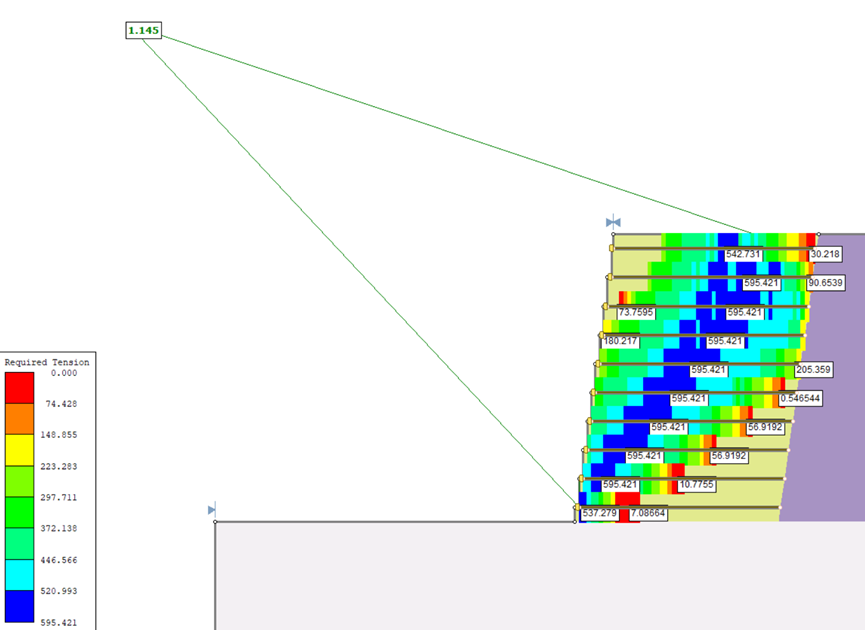
While a powerful tool, there are some specific limitations of this analysis. It’s possible after redesigning the support, originally invalid surfaces now converge which ultimately changes the final tension map results. This is due to the nature of the algorithm that optimizes based on where the minimum factor of safety has been found for the current model, an inherent attribute in PSO and surface altering. As such, tension map discrepancies may be more visible with more comprehensive searches or slope methods that do not consider complete equilibrium. In this case, further iteration and design may be required to find the maximum tensions required to stabilize the slope.