The Simplicity of Site Characterization using RSLog
- Alireza Afkhami, Senior Director of Web Applications at Rocscience
Site characterization comprises of field data collection and analysis to derive the subsurface model across the site. RSLog is designed to help you by streamlining the steps of site characterization and subsurface modelling. This article provides an overview of the tools offered by RSLog for this purpose.
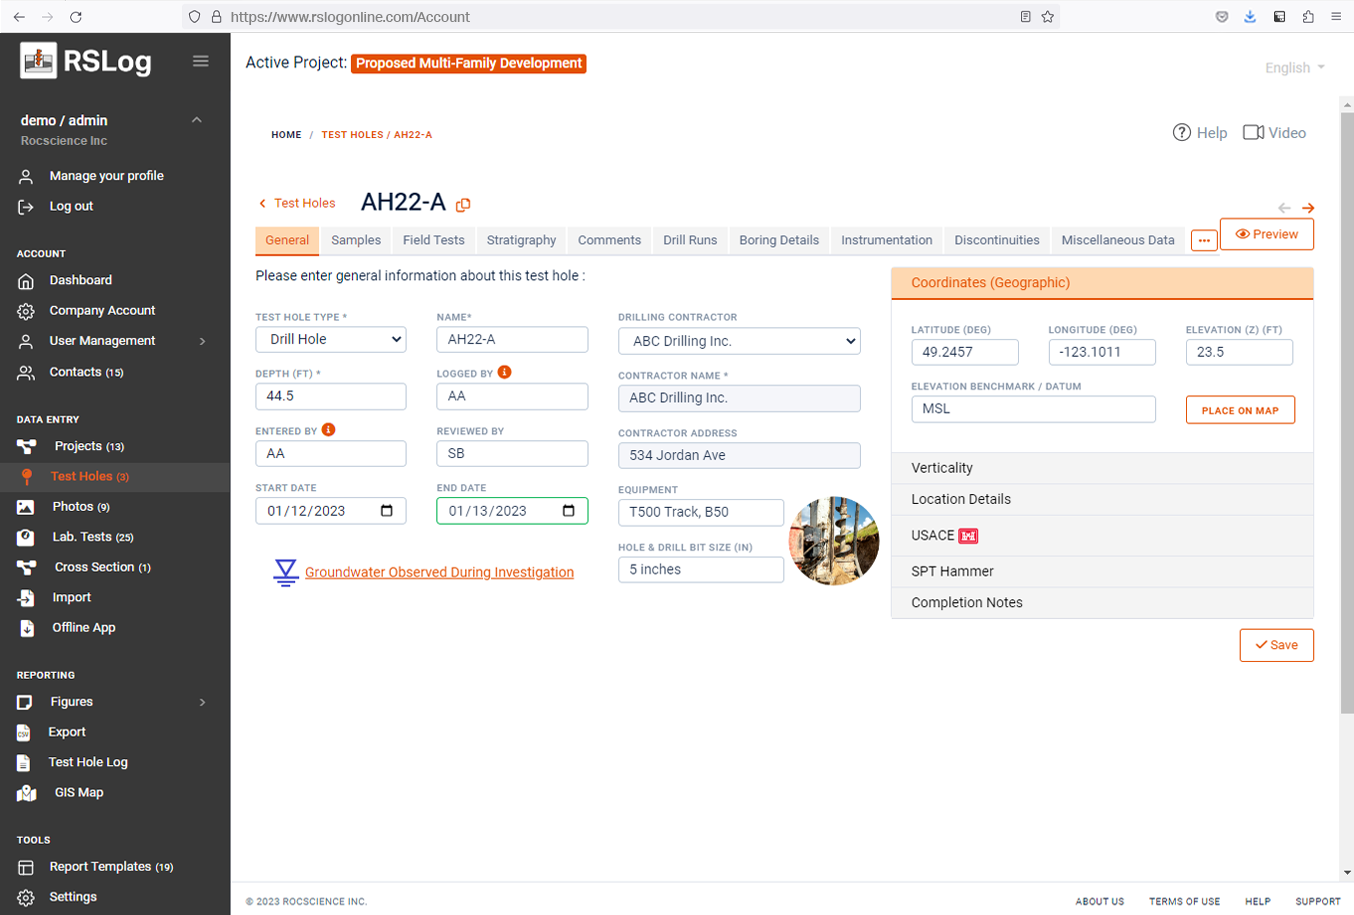
Data Collection + Collaboration
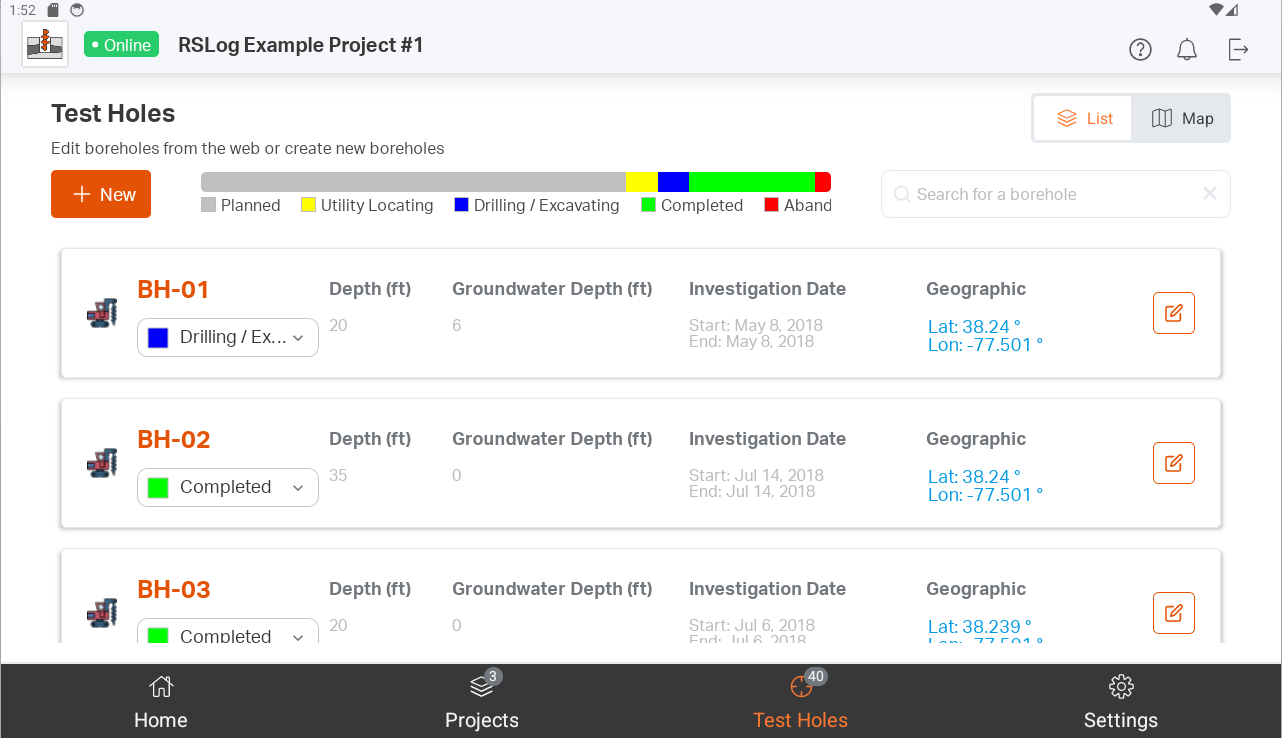
The first step of site characterization is collecting data during field investigation. This is typically an expensive phase of the project and failure in collecting sufficient and accurate data can impact the design phase. In larger projects, multiple field engineers collaborate on data collection during site investigation, and collected data is typically relayed to the project manager when possible.
RSLog’ Pre-Investigation Planner allows you to plan for your next field investigation and collect data while on site. RSLog’ OnSite app (online and offline) offers a seamless connection between the app and your RSLog account. This provides real-time progress of the site investigation as data is entered by the field engineers. At this point, generating a draft borehole log is just a click away.
Customizable Log Templates
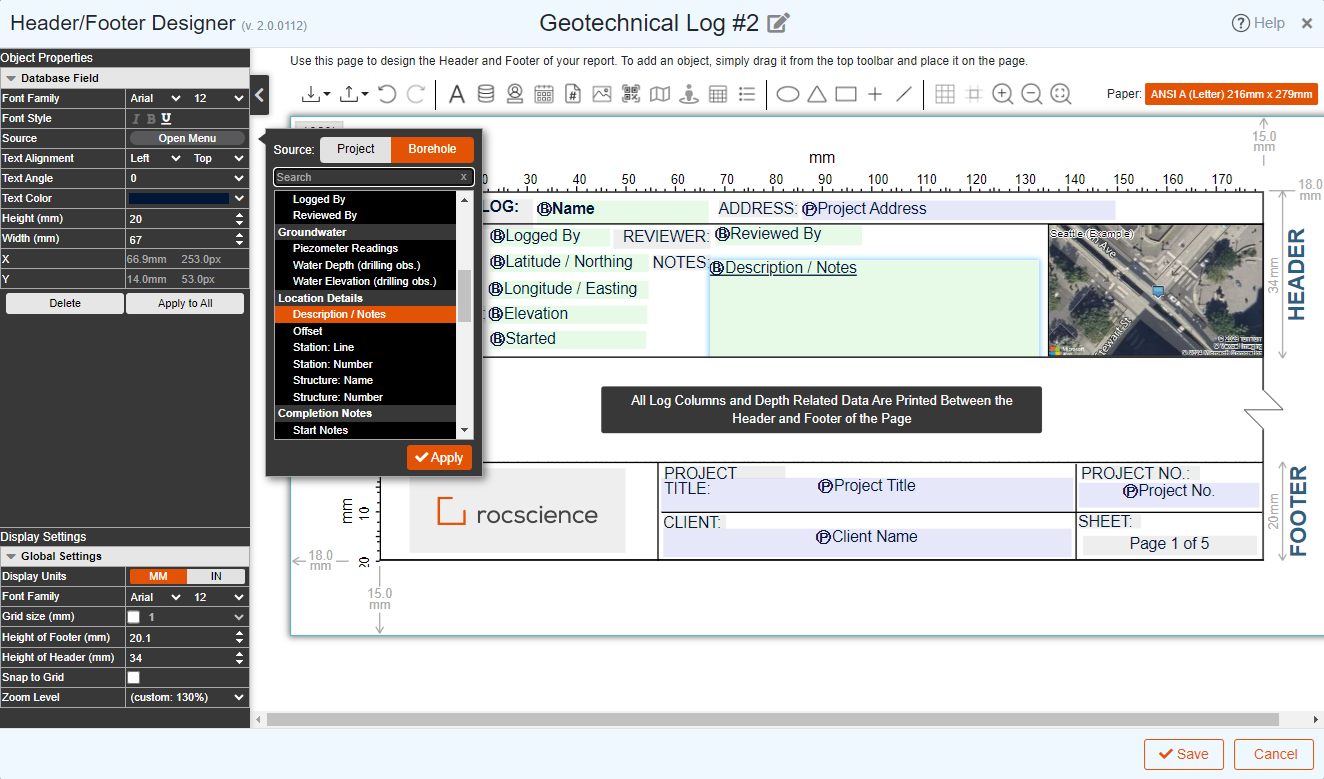
RSLog provides the flexibility to customize your log template to match your company standards. The state-of-the-art log template designer offers full flexibility on page design, selection of fonts and colors, design of various log columns, and a user-friendly header/footer designer. Once the field data is collected, turning it into a borehole log in RSLog can be done in one click.
Coming in the next update of RSLog:
- Elevation log column with flexible settings for label intervals and tick-marks,
- Versatile Graph log column with plotting up to 4 test results in one graph,
- Ability to add google map and street photos to your borehole log.
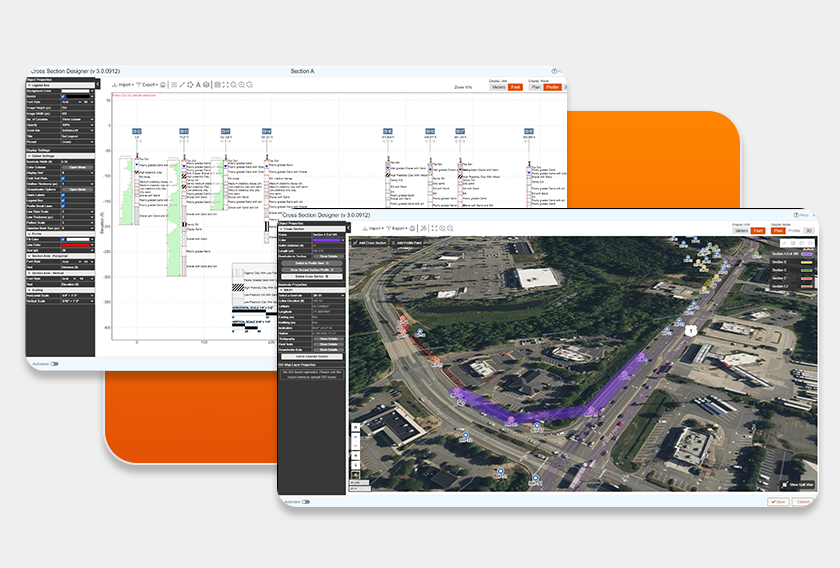
The Power of Cross-Section Designer
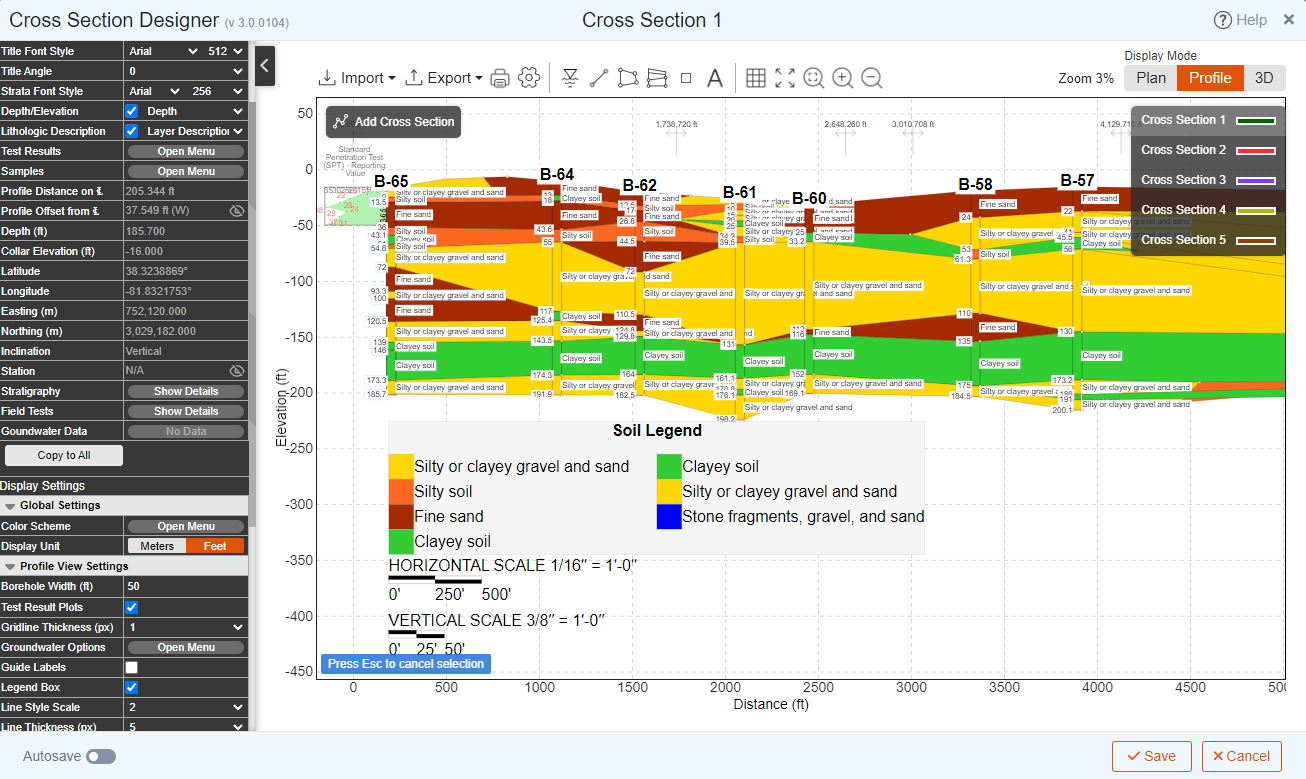
To create a cross-section in RSLog all you need is to draw a polyline on the plan view (map) and then start connecting soil/rock layers between boreholes. The entire stratigraphy, as well as field and lab test data, will be automatically loaded in the cross-section. This allows you to focus on applying your engineering judgment and local geology to come up with the best subsurface model. Some of the new features in our latest version of the Cross-Section Designer include:
- Improved export to DXF with more settings,
- Stationing and offset are now calculated automatically for each borehole along the cross-section,
- Visual presentation of piezometers on the Profile view,
- The ability to switch between hatch patterns and solid colors,
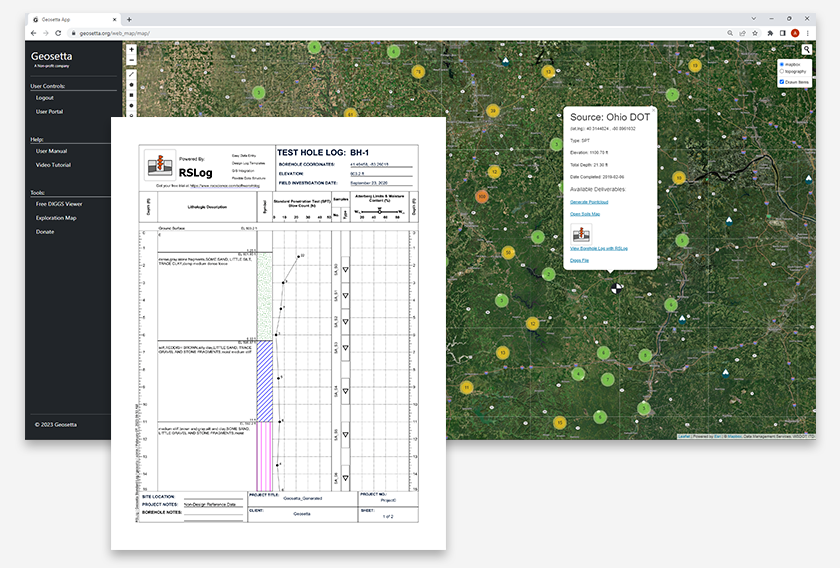
- Obtain estimated ground surface profile from map servers (uses LiDAR data),
- Use Machine Learning (ML) to estimate subsurface conditions (courtesy of geosetta).
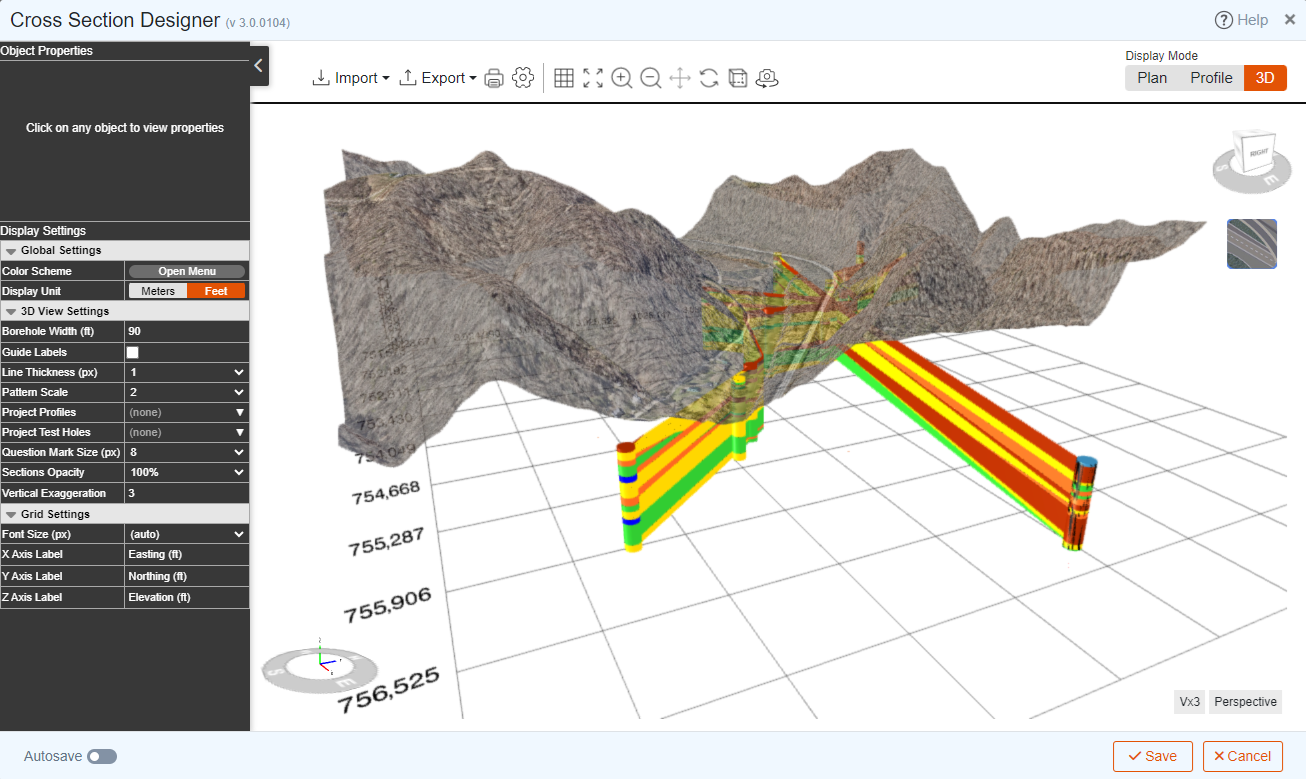
Simplifying 3D Visualization
A three-dimensional model is specifically helpful when you have multiple cross-sections in a project and when geology or topography are complicated. In RSLog, you can access the 3D viewer by one click. In addition to on-screen interaction with your subsurface model, you can export your model to various 3D graphic formats and share the model with others.
Switch to RSLog Today
If you are new to RSLog, start a free trial. Additionally, we can setup a webinar for your team to answer your questions. When you’re ready to purchase RSLog, we can also help you with migration of your historic borehole data (past projects).
Experience why RSLog is fast becoming the go-to Borehole Log Data Management platform.
Start a free trial of RSLog today
Free Trials