RSPile’s Enhanced Interaction Diagrams & Structural Capacity Ratio
- Ahmed Mufty, Senior Geomechanics Specialist
RSPile is continuously and rapidly developing, becoming an everyday tool for piling and geotechnical engineers. With three main modes of analysis: pile load carrying mode, individual pile analysis (single piles or patterns of piles), and group analysis mode, a wide variety of piles may be analyzed for different types of loading. You can determine the capacity of driven piles, bored piles, bored piles with enlarged base or multisectional piles. A set of sensitivity analysis choices are also available such as length analysis, pushover analysis, pile stiffnesses, etc. Many T-z and Q-z curves for different soil types and many methods for skin resistance and tip resistance are built in, though you can define your own curves or resistance values.
RSPile has the capacity to design a reinforced concrete section for bored or prestressed piles and to build up your pile with multiple sections with varied size or material. In recent developments, RSPile has expanded to start providing structural options including sections with moment capacity, and bored piles with casing, core or adding structural steel sections.
In the latest release, two major structural options for bored piles are introduced. Although the interaction diagram for reinforced concrete sections, unfactored M-P curves for biaxial bending vs. axial load was a feature that was developed in the previous release, the new release will have enhanced computations, faster execution time using an efficient optimization method, and an additional stress strain relation (ACI 318) was added to the interaction diagram construction process. Also, material factors are allowed now with single user choice factor or ACI 318-19 factors.
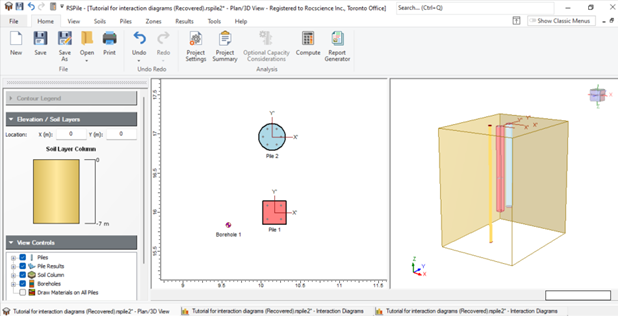
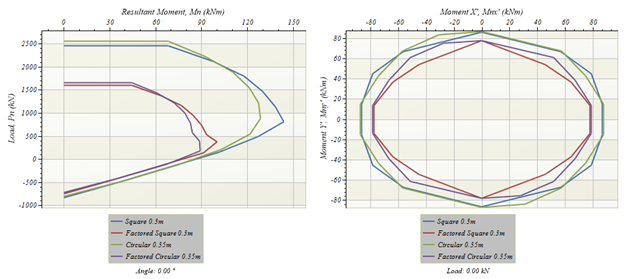
RSPile now has a tool to compute many interaction diagrams for multiple sections at the same time and you can change the angle of load application point or have Mnx-Mny plots at different axial load levels. Both factored and unfactored plots can be shown at the same time and in the same plot for comparison.
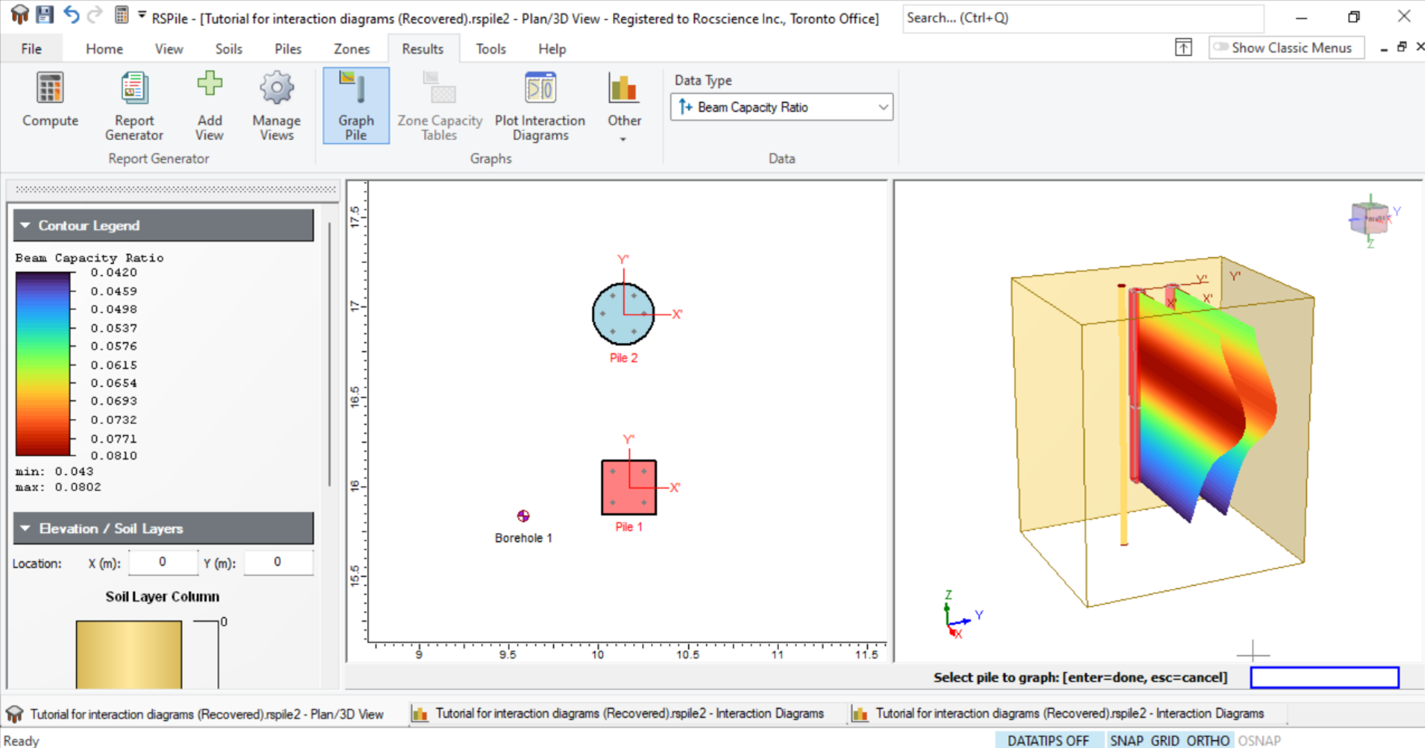
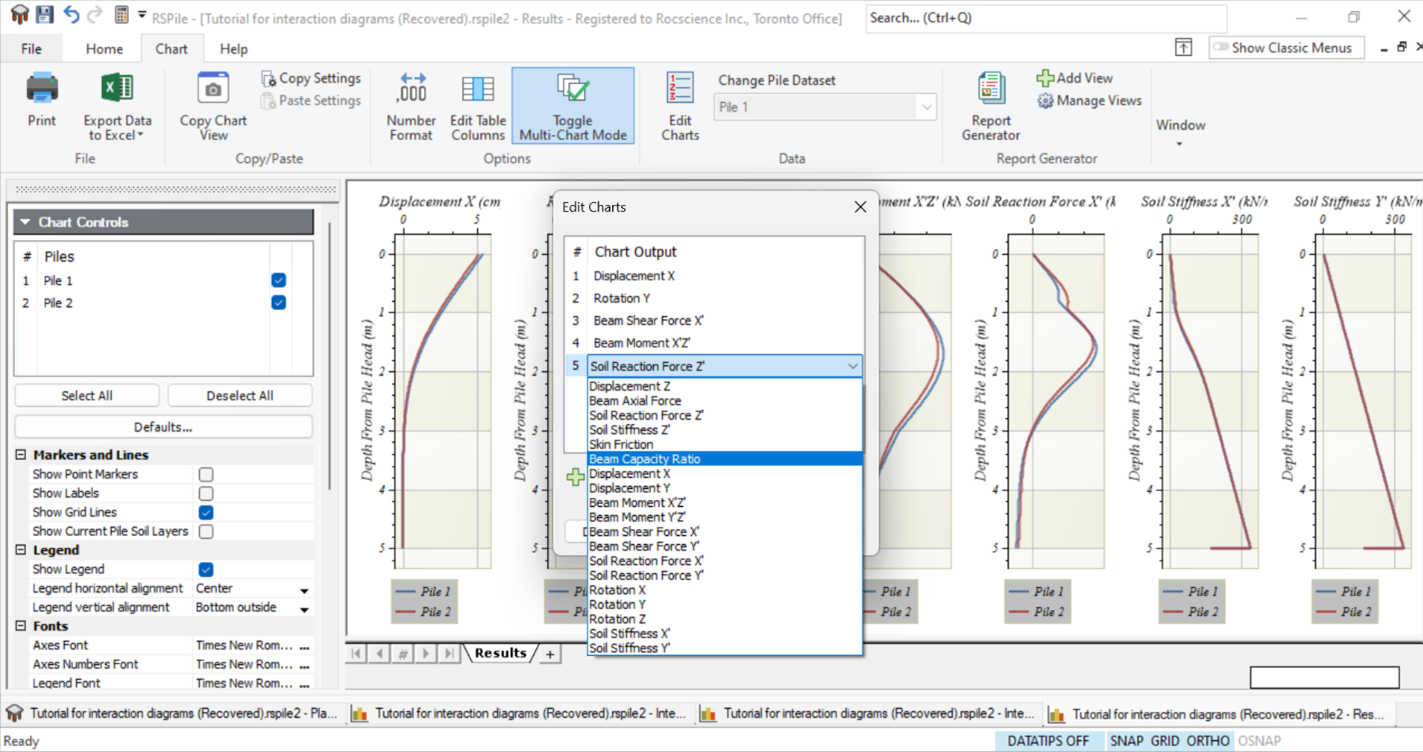
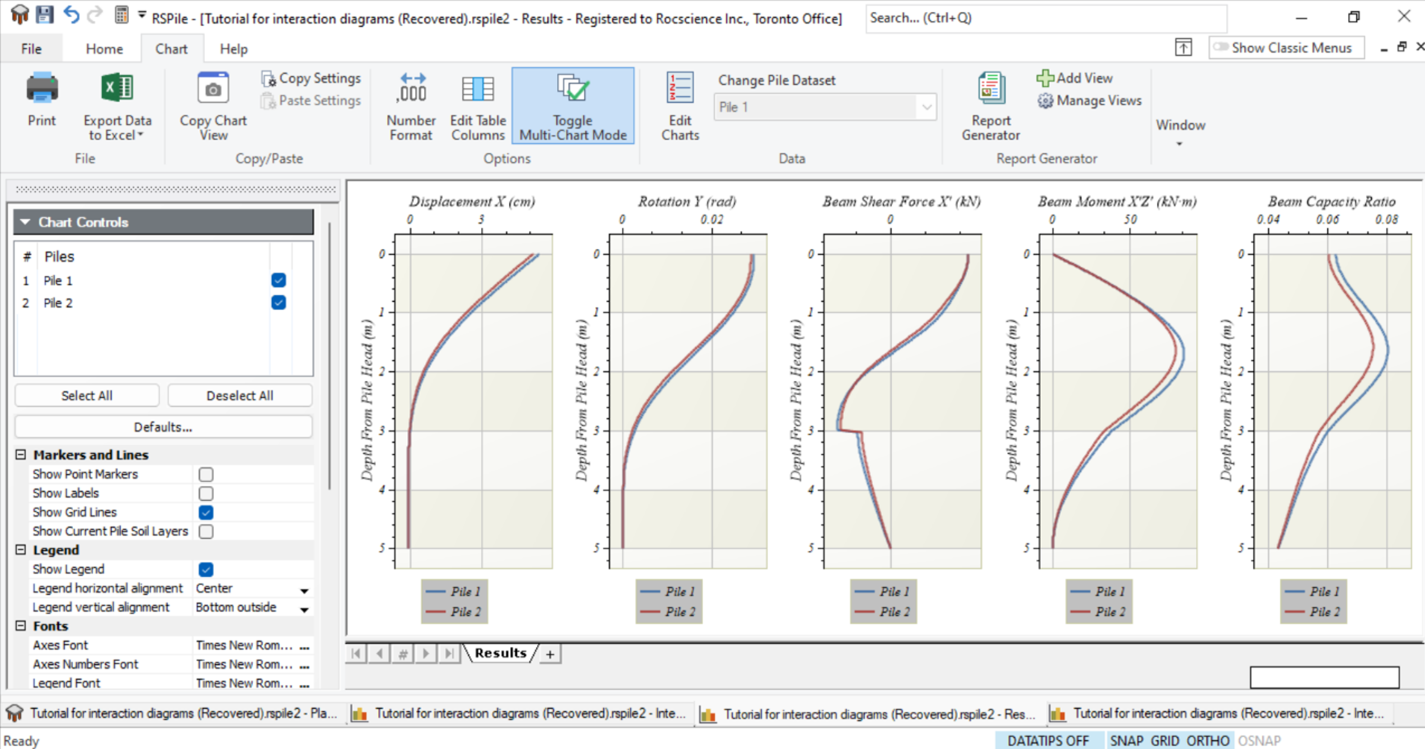
Another valuable feature being introduced is the determination of the structural capacity ratio for all reinforced concrete sections throughout the length of the pile. This is given for now as a graph in pile results when subject to loading. So, it compares the structural biaxial moment and axial load with the available capacity and hence, the failure or unacceptable section design may be detected easily. Imagine you can do that for hundreds of piles in one shot. So, if the capacity ratio is less than unity then the pile is safe. If exceeds unity, then you should revisit the section design at the failure levels.
You can see in the figures below how interaction diagrams will look like (you may change the number of points in the plot for smoother curves).