Bring Your Borehole Data to Life in Surfer — Directly from RSLog
RSLog is rapidly evolving from a borehole logging tool into a subsurface characterization platform, solving a core pain point: getting clean, reliable borehole data into visualization without tedious formatting or manual rework.
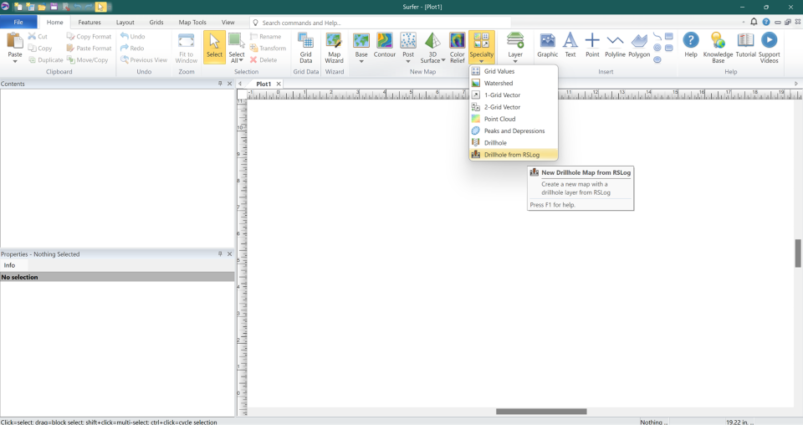
A new, lightweight connection between RSLog and Surfer now lets you export your borehole data in just a handful of clicks — Export page → Export button → Project data (JSON) — and open it instantly in Surfer. Instead of wrestling with spreadsheets or reinventing import templates, your data transfers as a structured, ready-to-visualize dataset.
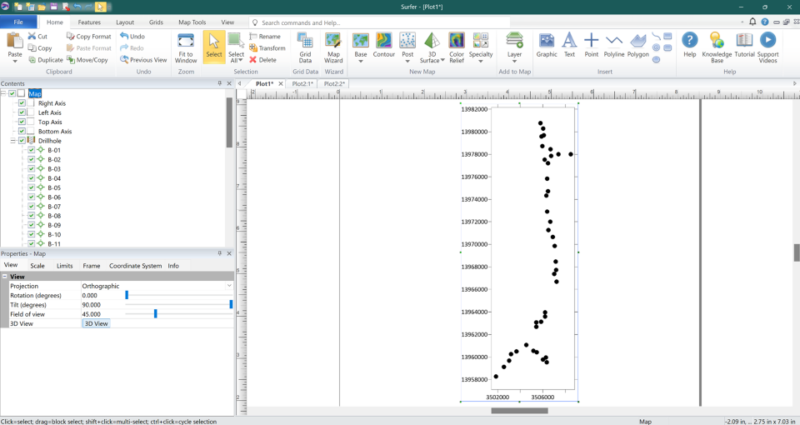
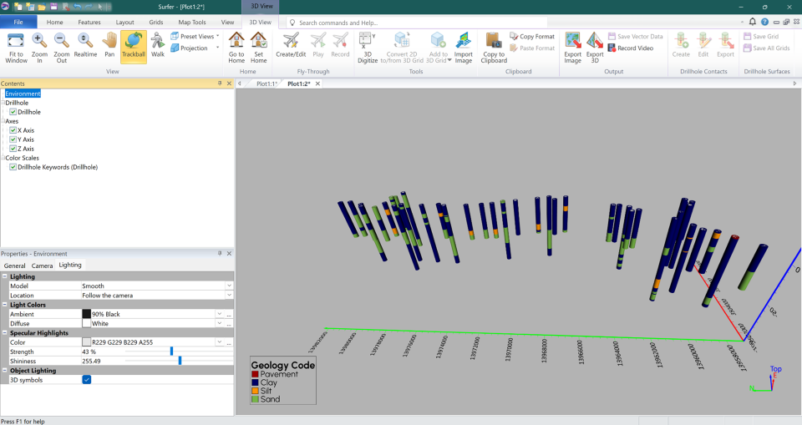
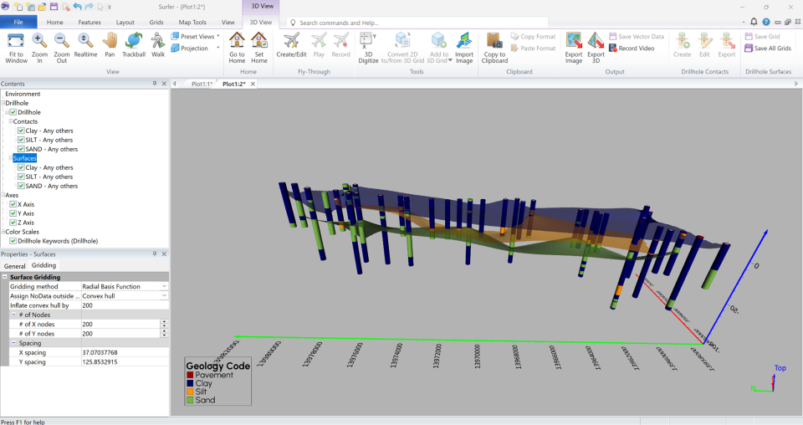
Once your RSLog project lands in Surfer, the real exploration begins. Engineers can map boreholes in 2D, pull them into a 3D scene, and visualize stratigraphic contacts to generate surfaces directly from lithology or contaminant concentrations. The workflow feels natural: data collected and managed in RSLog becomes an interactive subsurface model inside Surfer.
From there, Surfer gives you the freedom to deepen your interpretation:
- Build customizable 3D views to compare borehole stratigraphies and spatial trends with greater clarity.
- Grid your data in 3D to define isosurfaces, generate plume visualizations, and perform volume calculations.
- Export interactive 3D PDFs — fully navigable in Adobe Acrobat — to communicate subsurface conditions with colleagues, clients, or regulators without requiring specialized 3D software.
If you are interested in understanding how this integration will benefit your project, book a 30-minute demo with the combined RSLog-Surfer team, where you can test the workflow firsthand, and as a thank-you, participants will receive a complimentary one-month Surfer subscription.
Book your customised demo session now by emailing demoRSLog@rocscience.com.
Ready to Experience RSLog for Yourself?
If you haven’t explored RSLog yet, this is an ideal moment. The Surfer integration builds on RSLog’s core strength: organizing borehole data, lab results, and drilling logs into a consistent, high-quality dataset you can rely on for both interpretation and reporting.
Start Your Free Trial