Unlocking the Power of RS2 & RS3: Realistic Simulation of Hard Rock Failure with Voronoi Tessellated Models (VTM)
Predicting the behaviour of hard rocks under stress is a longstanding challenge. Unlike ductile materials, hard rocks often fail in a brittle manner, fracturing suddenly and unpredictably, especially under low confinement.
The Limits of Traditional Rock Modeling
- Traditional modelling approaches treat rock as a homogeneous mass. They ignore the grain-scale heterogeneities and microstructural flaws present in real rocks.
- These microscopic imperfections act as weak spots, leading to the initiation of tiny cracks long before abrupt failure occurs.
- As a result, conventional models struggle to simulate the true progression of brittle failure.
Voronoi Tessellated Models (VTM): A Grain-Scale Approach
To overcome limitations in simulating brittle failure, Voronoi Tessellated Models (VTM) are used to capture grain-scale heterogeneities in hard brittle rocks. This approach digitally divides the rock into non-overlapping polygonal (or polyhedral) blocks, each representing mineral grain. The boundaries between these blocks are modelled as joints, simulating natural grain boundaries and allowing for realistic crack initiation and propagation at the grain scale.
Types of VTMs:
- Discontinuum-based VTMs: Explicitly simulate crack initiation and opening but are computationally intensive, especially in 3D.
- Continuum-based VTMs: Offer greater computational efficiency but were historically limited to 2D simulations.
In a landmark collaboration, Rocscience Inc. and Dalhousie University developed a 3D continuum-based VTM using RS2 and RS3 software. The aim of this project was to achieve computational efficiency and extend grain-scale analysis to three dimensions, thereby overcoming the long-standing limitation of 2D continuum-based models.
Methodology: Simulating Brittle Failure in Lac du Bonnet (LdB) Granite
The research pioneers the application of a 3D continuum-based VTM to simulate the failure process of Lac du Bonnet granite. The methodology is presented as a systematic workflow:
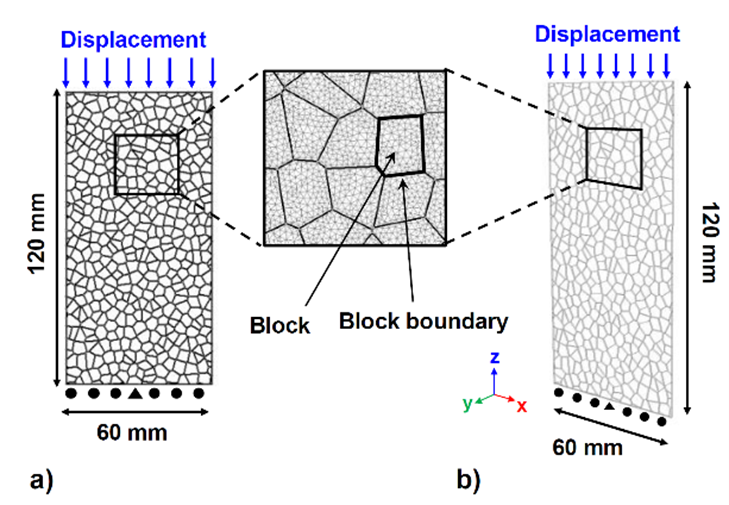
Step 1 - Building a 2D Voronoi Model in RS2
The RS2's built-in Voronoi joint network tool divides the model domain into polygonal blocks representing mineral grains, while simultaneously defining joint elements at grain boundaries. This process inherently generates heterogeneity through irregular block shapes, varying joint lengths and orientations, and differences in stiffness and strength between solid blocks and joint elements.
The RS2-VTM consisted of approximately 515 medium- regular polygons with an average edge length of 3.5 mm, meshed with 6-noded triangular elements (Figure 1). Sixteen micro-properties encompassing strength and deformation parameters for both solid block and joint elements were iteratively calibrated to match the macro properties (peak strength and Young’s modulus) and macro-behaviour (failure mode and post-peak response) of Lac du Bonnet granite. The specific values and ranges for these micro-properties are detailed in Table 1, which provides a comprehensive summary of the parameters used during the calibration process.
Unconfined compression testing simulations used the following boundary conditions:
- Lower boundary –Vertically fixed, with midpoint fully constrained (both horizontal and vertical directions) to prevent rigid body motion and ensure numerical stability.
- Side boundaries – Unconstrained (free displacement).
- Top boundary – Vertical displacement applied to simulate axial loading.
Table 1: Micro-properties of the 2D and 3D VTMs (from Amiri and Bahrani (2023)
Micro-Properties | Blocks | Block Boundaries |
E (GPa) | 78 | - |
υ𝜐 | 0.22 | - |
knkn (GPa/m) | - | 145,000 |
kn/kskn/ks | - | 2.5 |
σt𝜎t (MPa) | 22 | 9.8 |
c (MPa) | 82 | 45 |
φ(o)𝜑(o) | 59 | 59 |
σtres𝜎tres | 0.1 | 0.1 |
crescres | 0.1 | 0.1 |
φ(o)res𝜑(o)res | 59 | 59 |
Step 2 - Developing the Plane Strain RS3-VTM
The calibrated voronoi joint network from the RS2-VTM was imported into RS3 and extruded by 6mm along the y-axis to create a plane strain model. Boundary conditions were applied as follows:
- Front/Back boundaries– Fix in the y-direction to enforce plane strain constraints.
- Top boundary – Vertical displacement applied to simulate uniaxial loading.
- Lower boundary –Vertically fixed, with midpoint fully constrained (all directions) to prevent rigid body motion.
By maintaining the micro-properties and geometric characteristics of the 2D model within the 3D plane strain simulation, this method allows for a direct comparison of mechanical behaviour between the RS2 and RS3 models.
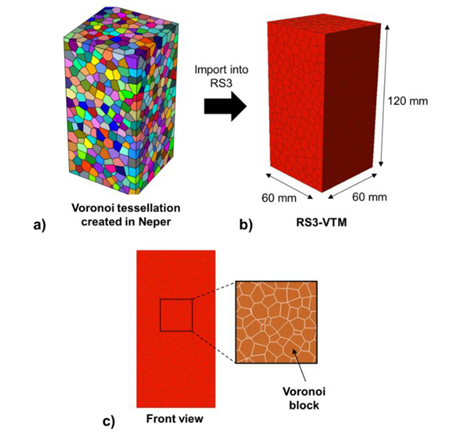
Step 3 – Implementing the Full 3D VTM
The full 3D RS3-VTM (60mm x 60mm x 120mm) was generated using Neper’s Voronoi tessellation algorithm. This structure was imported into RS3 via geometry import (DFN joint network import also supported), followed by geometry clean-up and joint surface assignment.
Key specifications:
- Block geometry: ~2,000 Voronoi blocks
- Mesh configuration: 1,454,270 four-noded tetrahedral elements
- Runtime optimization: 6 mm average joint size (larger than plane-strain models)
- Material properties: Calibrated micro-properties from Step 1
- Boundary conditions:
- Lower boundary: Vertical fixation with center point fully constrained
- Top boundary: Vertical displacement for uniaxial loading
Results: Comparative Analysis and Sensitivity Studies
Comparative Analysis of 2D and 3D Models
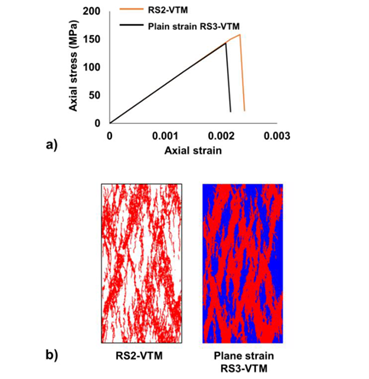
- Stress-strain behaviour
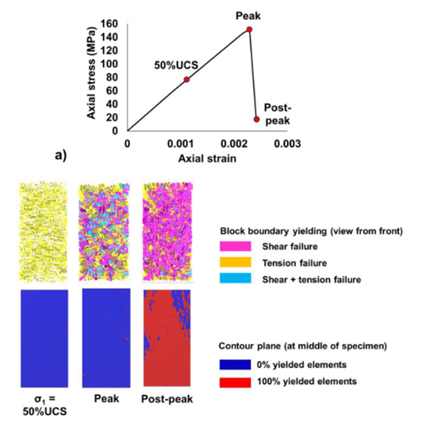
The RS2-VTM and plane strain RS3-VTM exhibited nearly identical stress-strain curves (Figure 3a), with brittle responses in both models. Peak strengths measured 158 MPa (RS2-VTM) and 143 MPa (plane strain RS3-VTM), with the slight reduction attributed to mesh element arrangement differences.
- Failure modes:
Both models showed tensile-dominated failure: joint elements yielded at ~30% peak stress, followed by solid-element yielding near peak stress. Shear/mixed-mode yielding occurred minimally at peak/post-peak stages in RS3-VTM.
Full 3D RS3-VTM Performance
- Unconfined compression results:
The model achieved a UCS of 151 MPa with failure initiated by tensile joint yielding pre-peak, transitioning to shear yielding at peak/post-peak.
Sensitivity analysis
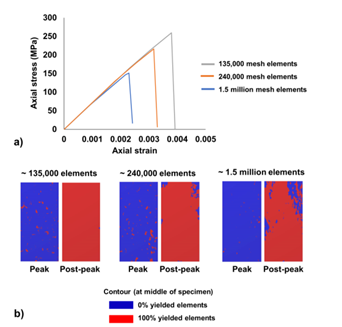
- Mesh Element Density
Mesh Elements | UCS (MPa) | Runtime (hrs) |
~135,000 | 260 | 3 |
~240,000 | 216 | 4 |
~1,500,000 | 151 | 11 |
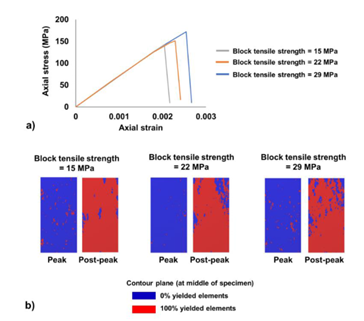
- Block Tensile Strength
Tensile Strength (MPa) | UCS (MPa) |
15 | 146.5 |
22 | 151.5 |
29 | 172 |
Key Insights
- Mesh refinement significantly impacts UCS. UCS decreased by 42% as mesh density increased (Figure 5a). Young’s modulus remained constant (70 GPa) and failure modes showed minor variation (Figure 5b)
- Block tensile strength is a primary control on peak strength (Figure 6a).
- Failure modes remained consistently tensile-dominated (Figure 6b).
- Plane strain and full 3D models successfully replicated grain-scale failure processes observed in physical tests.
Conclusion
The integration of VTMs within RS2 and RS3 represents a major step forward in simulating brittle failure in hard rocks, as demonstrated with Lac du Bonnet granite. For more information on the modelling capabilities and applications of RS2 and RS3, request a trial today.
See the difference Voronoi Tessellated Models (VTM) can make in your hard rock simulations.
Start a free trial
Try now