Software Synergy: Accelerating 3D Slope Stability Analysis through Seamless Integration
Even a mere decade ago, the amount of data available to us today would have seemed incomprehensible. Advancements in technology have propelled this growth in data and provided many tools to assist with interpreting the wealth of information at our fingertips. While 2D analysis has been the basis of geotechnical analysis for many years, 3D slope stability assessments are becoming more commonplace as technology improves. As this study on the Cumba pit slope failure by Bar et al. exemplifies, available data can be used to better understand failure incidents and prevent them from occurring in the future.
Using the 3D capabilities of Slide3 and RS3, this study performs a back analysis of the 2019 Cumba pit failure event in Dominican Republic. Within only one week, a comprehensive analysis was carried out using pre-existing data, including photogrammetry processing, structural mapping, kinematic analysis, 3D Limit Equilibrium Modelling (LEM) and 3D Finite Element Modelling (FEM).
The Cumba Pit Slope Failure
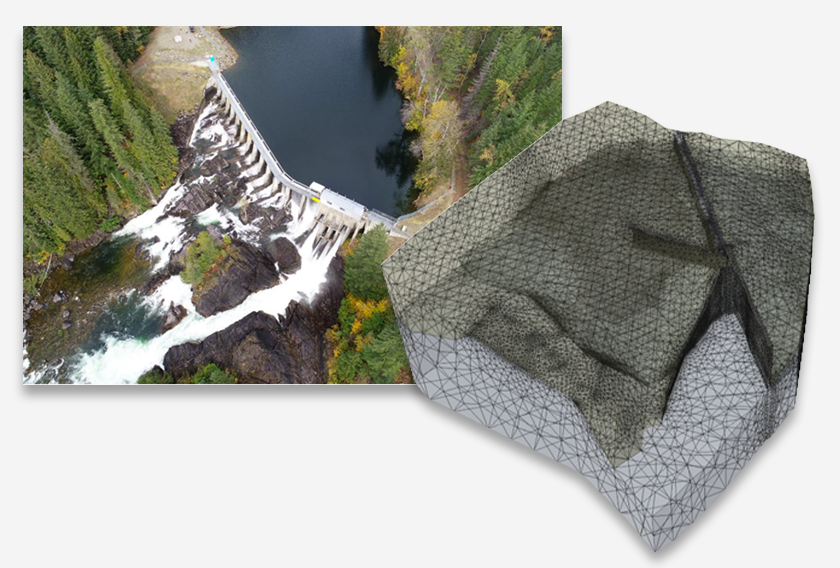
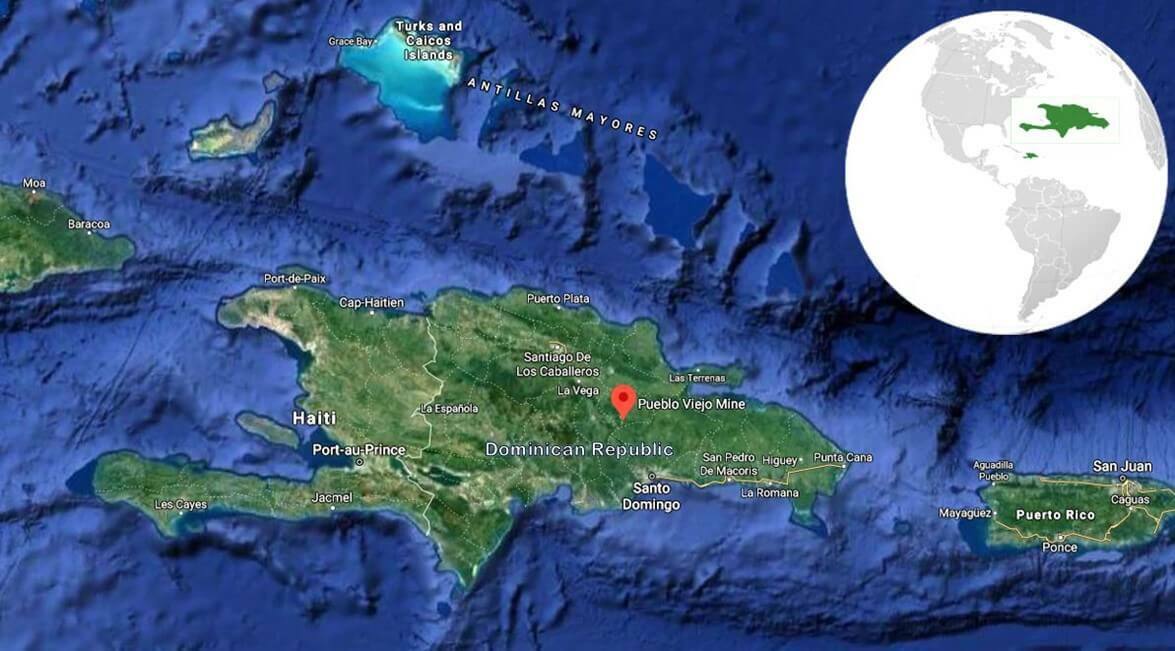
Located roughly 80 km North of Santo Domingo, the Pueblo Viejo mine is home to the subject of the study, the Cumba pit slope (Figure 1). Pueblo Viejo operates in a climate of heavy, year-round rainfall and extreme storms, making its deposit areas subject to possible slope instability.
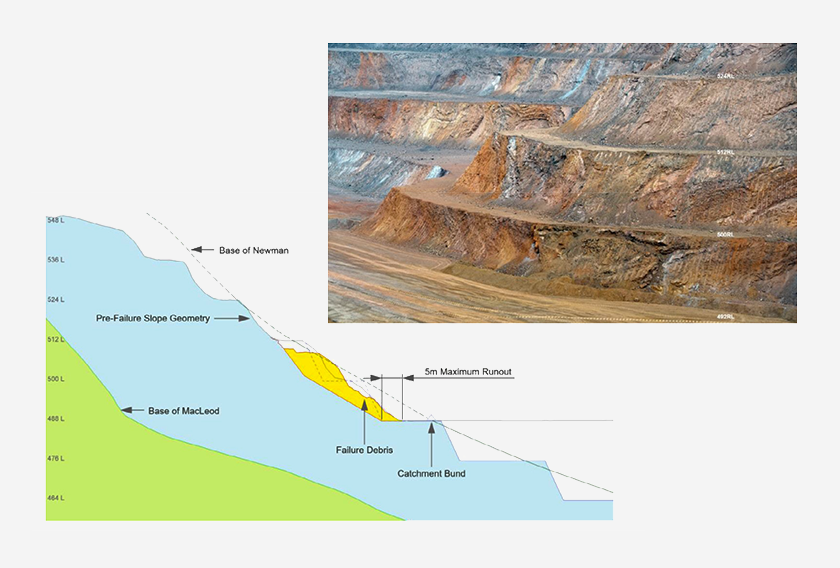
The failure of the Cumba pit slope occurred in September of 2019 over a three-week period. The failure surface is found on the North side of the slope and made up entirely of andesite. Many of the displacements appeared to be triggered by mining of the trim blast at the base wall between elevations of 310 and 300 mRL. Following the incident, a subtle disjointed fabric was visible, sharing a similar orientation to the Hatillo Thrust Fault (HTF).
Compiling Pre-Failure Data for 3D Photogrammetric Modelling
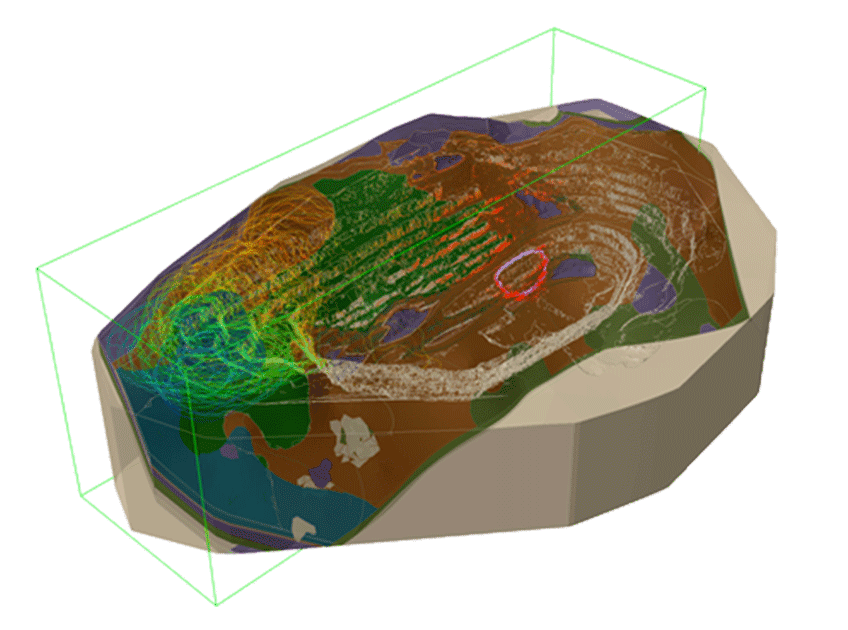
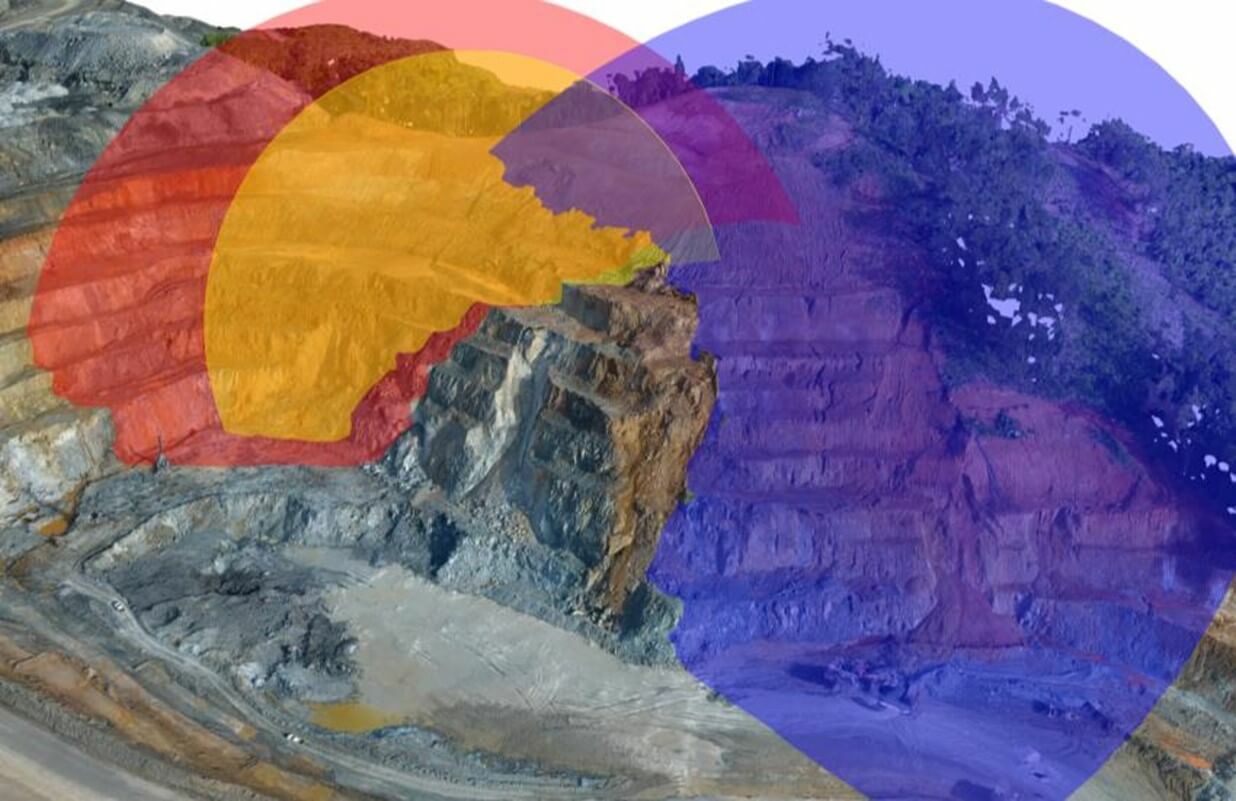
To conduct an effective back analysis of the pit, data was compiled from before the failure event. Using a collection of around 200 images, several 3D models were created by reprocessing the photos of the pit using ShapeMetriX UAV software. Although the available images were taken from a downward angle, which is not optimal for geological mapping, the software was able to produce detailed models containing over 15 million surface points. The models were then used to map the critical geological structures which contributed to slope failure, as highlighted in Figure 2.
Reviewing the Geotechnical Model using DIPS
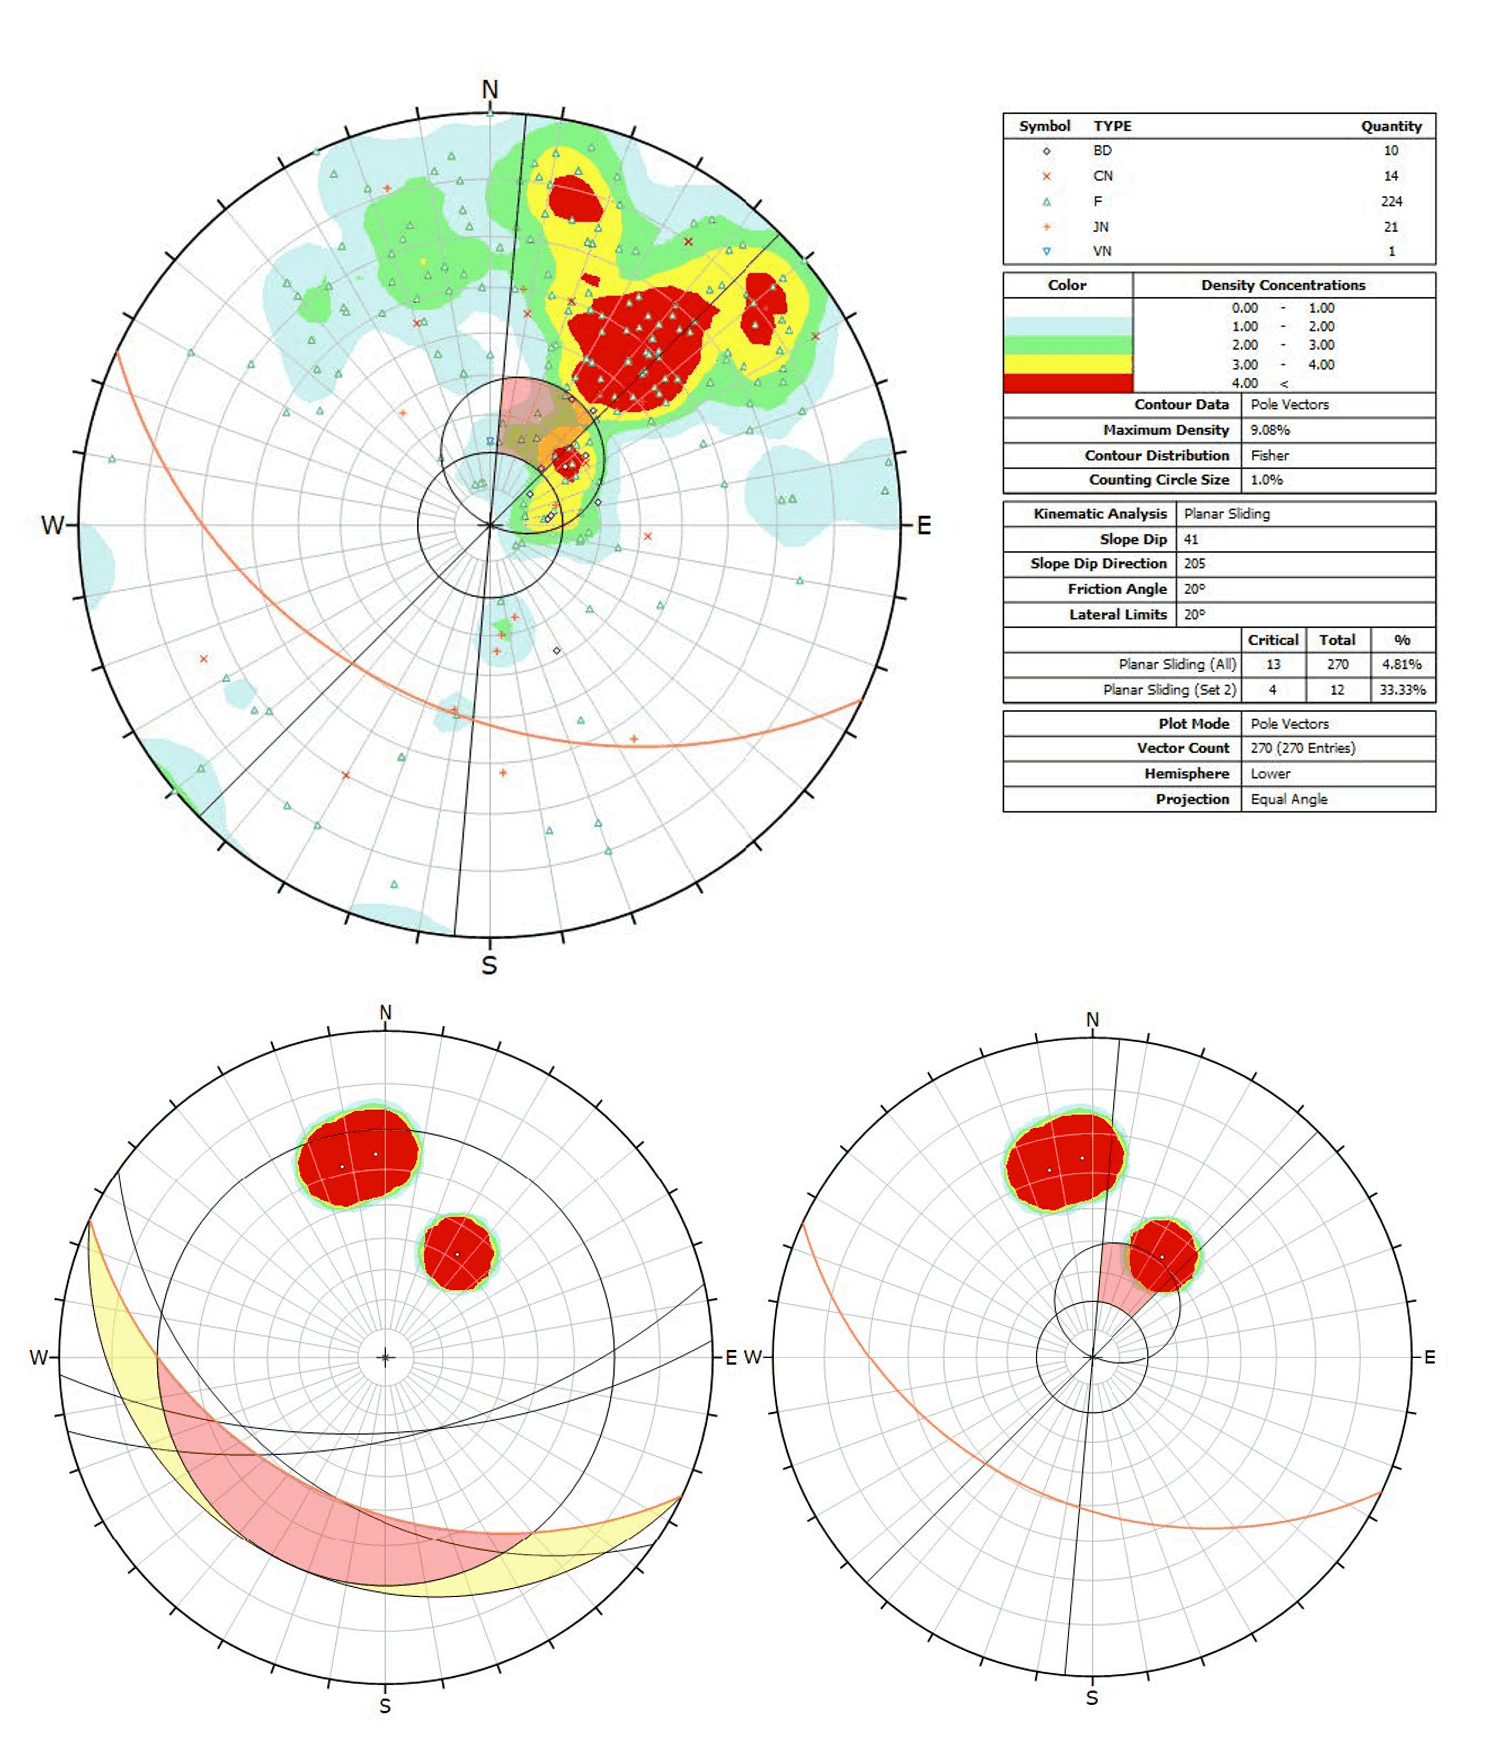
The rock mass was modelled using isotropic Hoek-Brown material strengths, which were determined based on historical data. DIPS was used to display a stereonet of the geological structures on the North wall, as seen in Figure 3. It was determined that planar and wedge failure mechanisms were inadmissible following a kinetic analysis for simple failure modes on the three main faults previously shown in Figure 2.
Limit Equilibrium and Finite Element Modelling in Slide3 and RS3
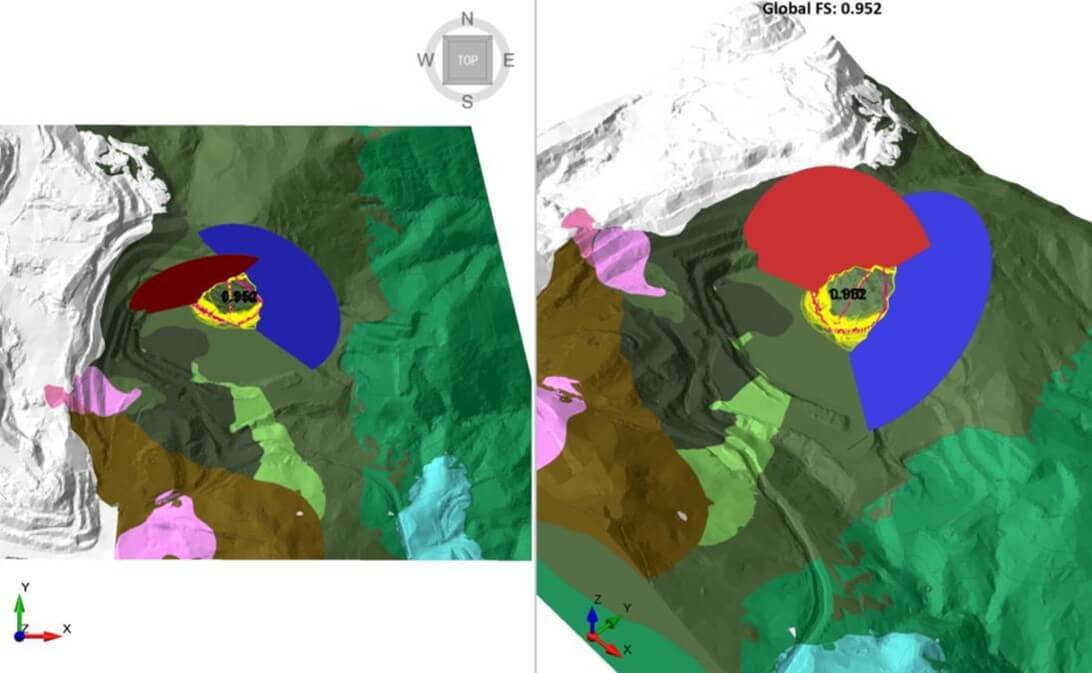
The study utilized Slide3 and RS3 software for LEM and FEM analysis, respectively. The testing found that failure within the andesite involved sliding on the blue fault with progressive daylighting. In the 3D LEM analysis, the shear strength of the fault planes was the main point of investigation, which was found to be most realistic at a value of 50 kPa. The results were analyzed using both Bishop and GLE analysis methods and a minimum slip surface depth of 10m.The 3D LEM was based on two geometric models:
- The pit floor at 310 mRL (Figure 4). Sliding is mostly along the blue and red faults, with shearing through the rock mass at the slope's base.
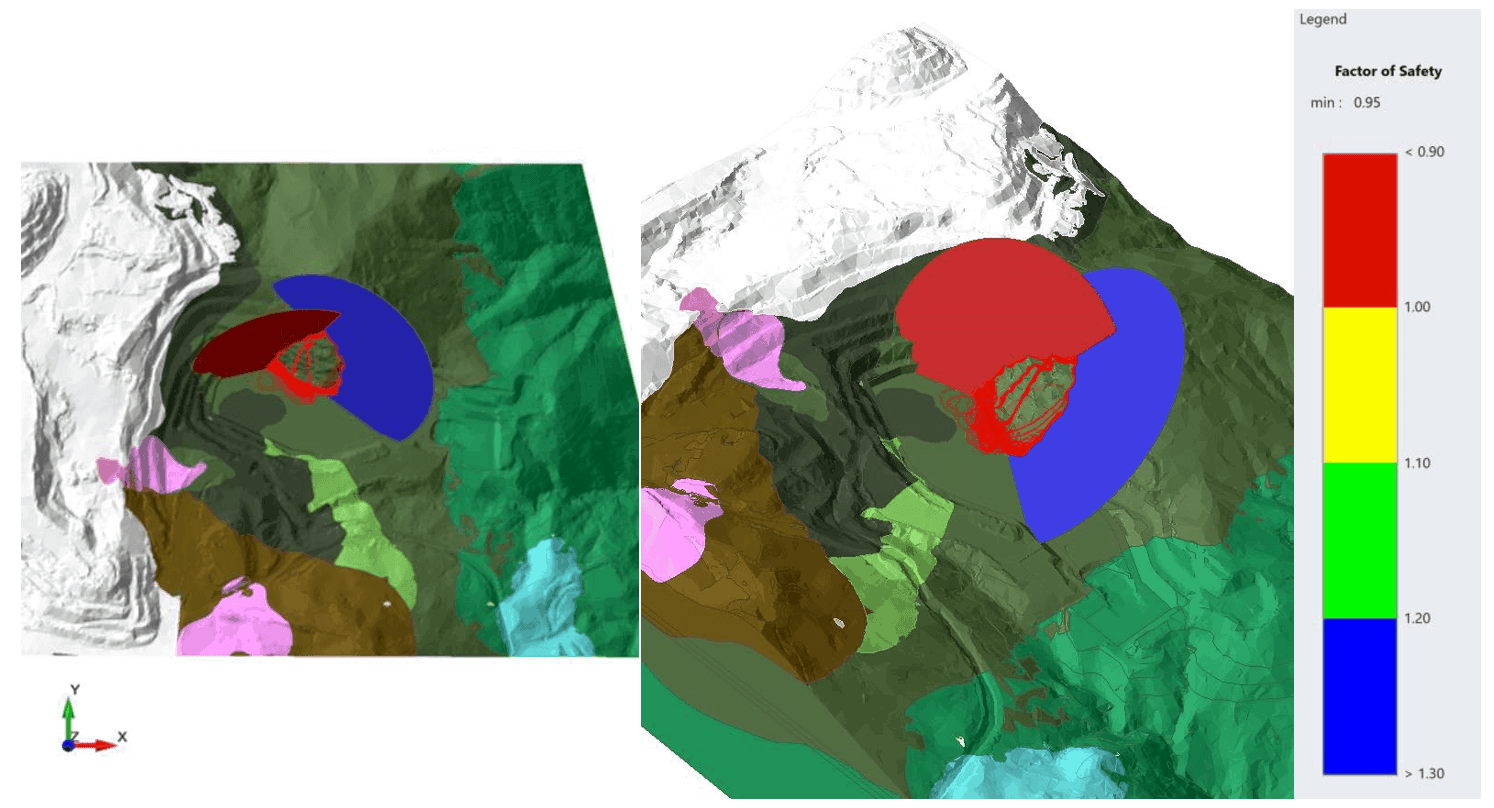
- The pit floor at 300 mRL (Figure 5.). Sliding prevails along the blue and red faults and shear through the rock base of the slope proving a good replication of the failure ‘non-daylighting; or ‘partially daylighting’ failure mechanism.
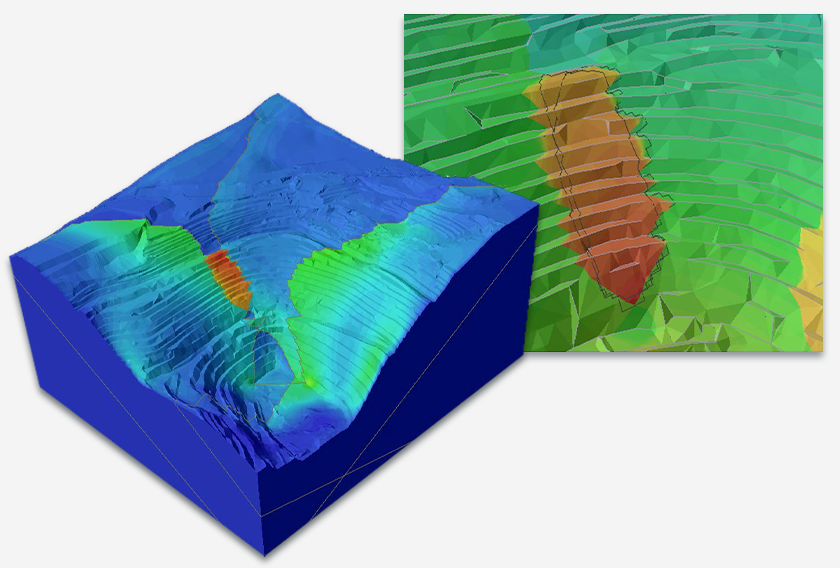
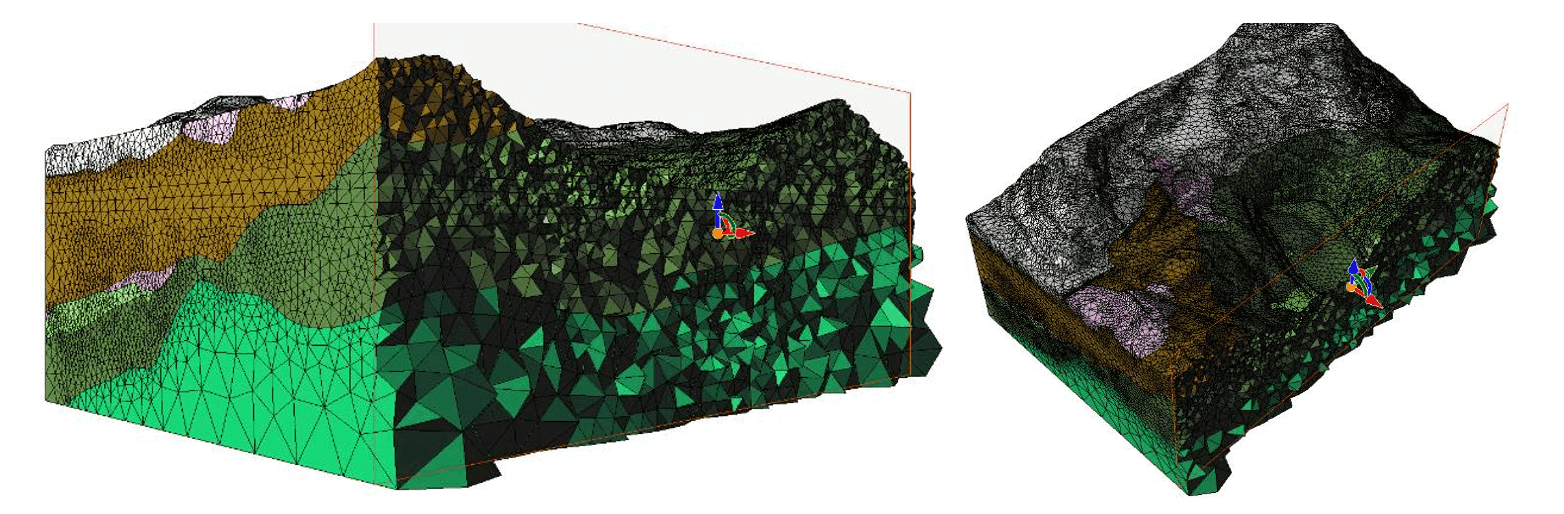
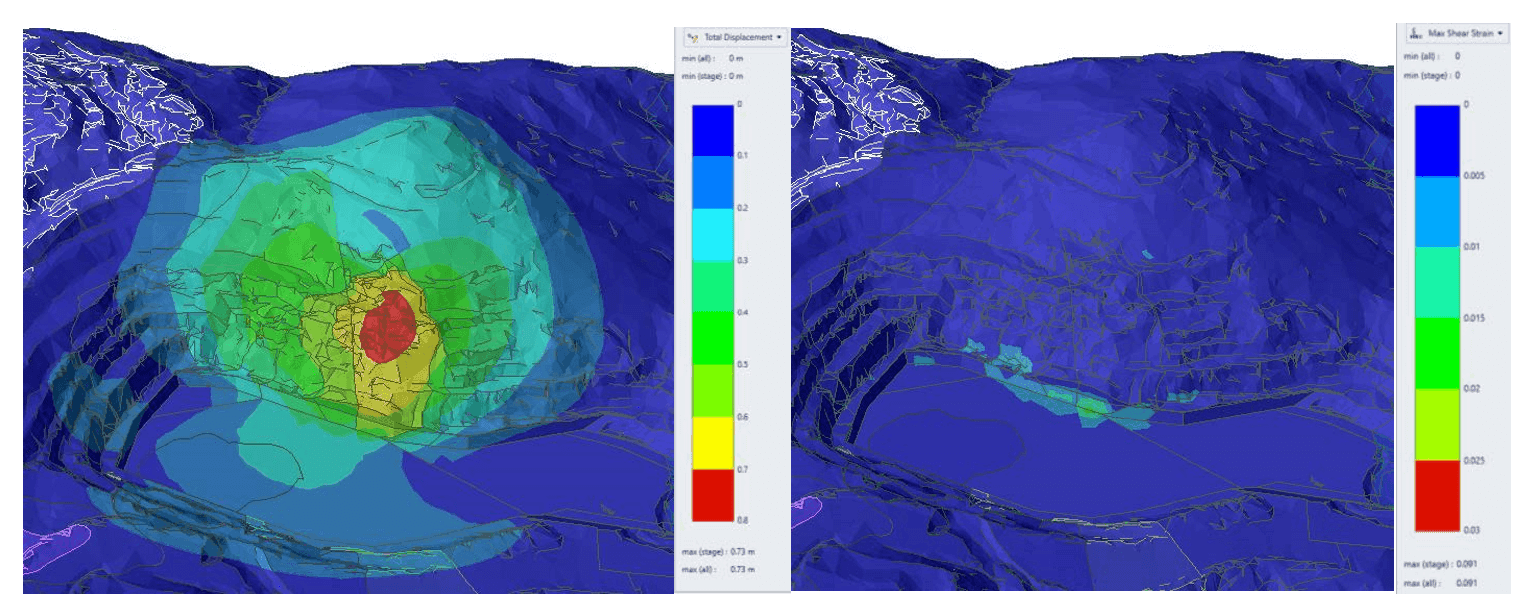
Following the 3D LEM results, a 3D FEM was conducted to confirm the failure mechanism. This model was developed using four-noded tetrahedra elements and a graded mesh sliced through the center of the Cumba pit slope failure (Figure 6). A collection of displacements in the fault bounded area, as seen in Figure 7, were discovered in the results as well as concentrations of shear strain on the slope’s base, within the rock mass between the red and blue faults from Figure 2.
Lastly, both the LEM and FEM results were qualitatively validated using data from ArcSAR, an interferometric synthetic aperture radar which measures line of sight (LoS) displacement data. When the results were compared, there were many notable similarities between the sources, including a clear congruence in spatial data. Although the study states that more quantitative data would be necessary to solidify the displacements predicted by the model, the results proved to be useful in the context of highlighting and interpreting the potential areas of concern in the model.
Enhanced Back Analysis using Tools in Tandem
Notably, the short timeline of a week for Bar et al.’s back analysis included all the following modelling, reviews, and analyses:
- Photogrammetry processing and structural mapping using ShapeMetriX UAV
- Kinematic analysis using DIPS
- 3D LEM using Slide3
- 3D FEM using RS3
With the help of pre-existing data, ranging from photographs to vibrating wire piezometers, as well as the use of 3D modelling and other geotechnical tools, the back analysis of the failure at the Cumba pit slope was completed. The ease of importing data from the ShapeMetriX UAV software to Slide3 and RS3 allowed for rapid 3D model creation. Combining this feature with the ability to verify results using multiple methods allowed for a truly thorough analysis.
The process demonstrated in this study highlights the substantial impact that combining different technologies and data-availability can have on slope stability analysis. For all the details on this project, read the full paper.