Slope Stability Analysis using Finite Element Method: Key Takeaways from an Open Pit Mine Design
Bench or slope failure can jeopardize the operational safety and productivity of an open pit mine, resulting in a great deal of time lost and additional costs to remediate. Comprehensive stability analyses in the developing stages of an open pit mine project can help you identify potential failures and plan suitable prevention measures which will ultimately save you time and money over the course of the mine’s lifecycle.
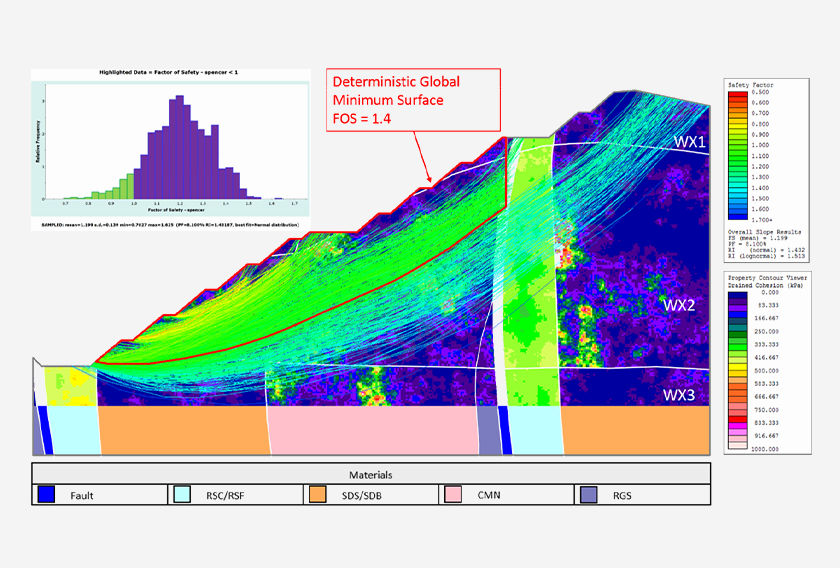
This case study is based on the paper by Daulet Dossymbek which was presented at the Rocscience International Conference in 2021, and focuses on the stability analysis of the Vasilkovskoye open pit. Several critical areas, characterized by significant jointing of a blocky rock mass passing through the main haulage ramp, imposed a significant threat to the safety of the entire mine.
A numerical simulation was conducted using RS3’s finite element analysis to provide an in-depth understanding of the geological characteristics of the deposit, physical properties of rocks, and stress-strain state while analyzing the critical risk factors of the walls. Taking complex geometry and non-linear behaviour of the slope into account, the numerical modelling approach allowed for a more detailed stability evaluation than using conventional methods.
Rock mass characterization and design parameters
Rock mass characterization of slopes is an important first step in determining rock mass design parameters. Along with analyzing laboratory data of the Vasilkovskoye mine investigation, rock mass characterization was performed to obtain design input data for an accurate 3D numerical model.
Findings obtained from rock mass data analysis:
- The top portion of the pit consisted of weak weathered rocks and could be distinguished from the base rock
- The thickness of these rocks varied and encompassed several benches at higher elevations
- The compressive strength of the weak rocks was less than 50 MPa
- The laboratory strength test data identified a much lesser weathered rock mass beneath the weathered rock described above
- Considering field data observation and borehole camera analysis, the GSI index greater than 70 was attributed to the deeper rock mass of the open pit mine
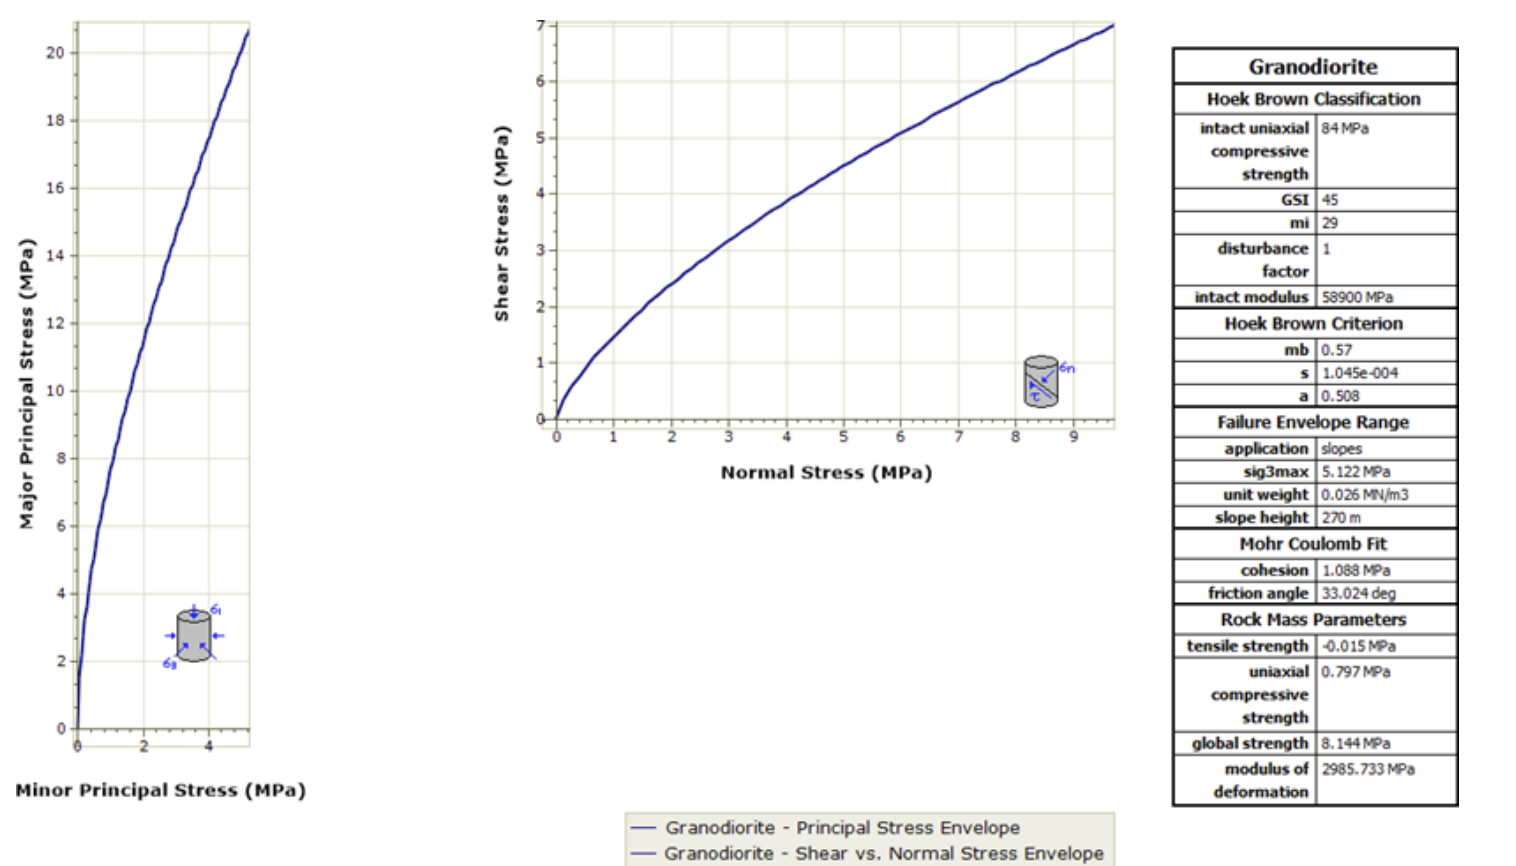
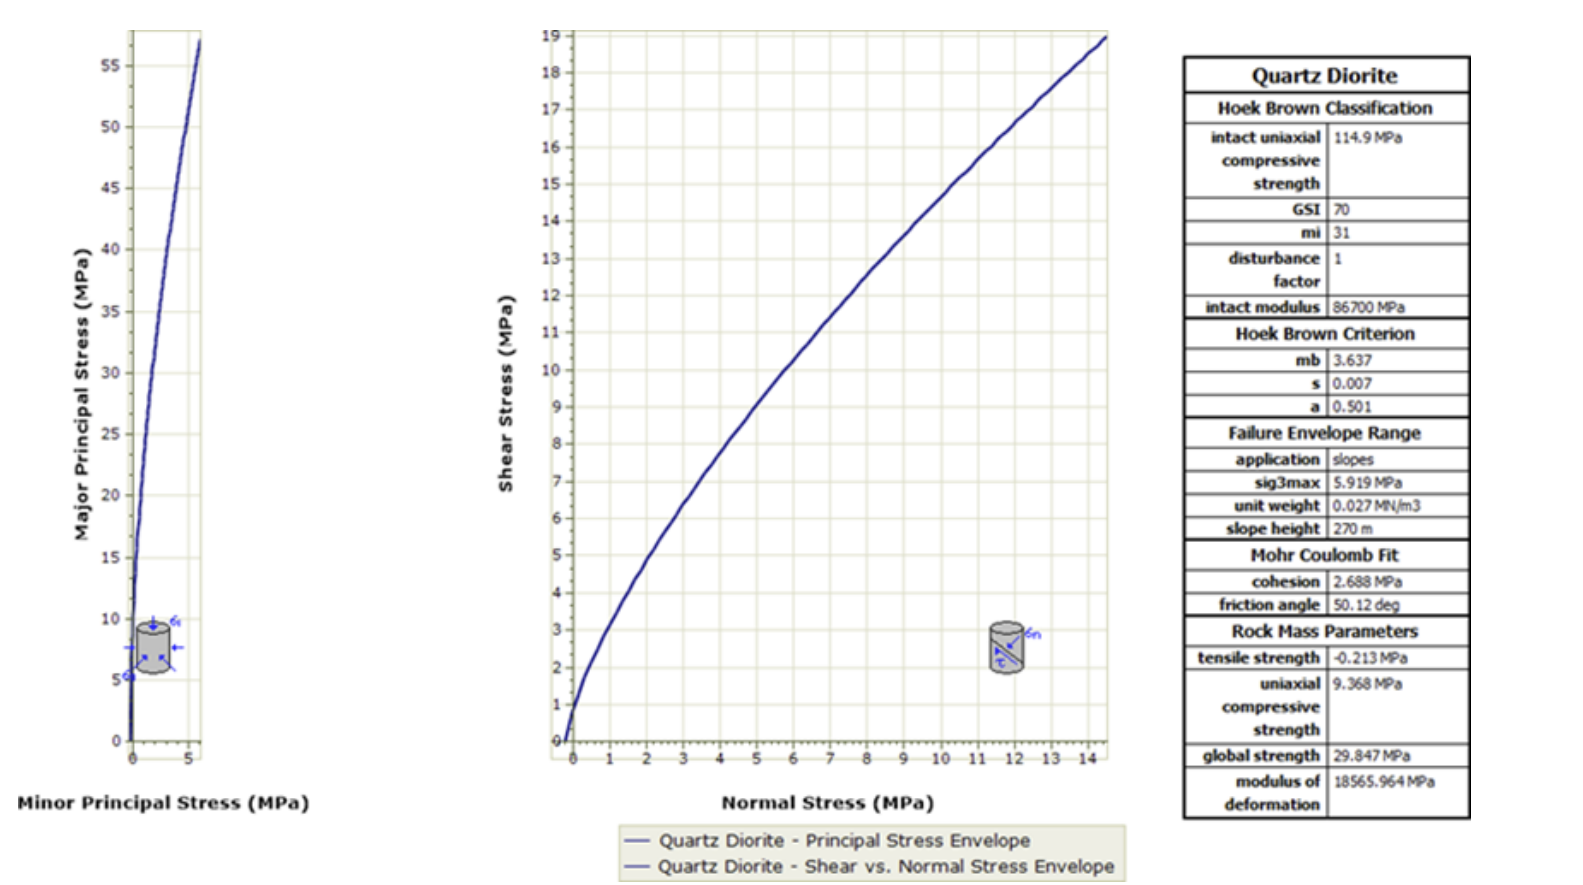
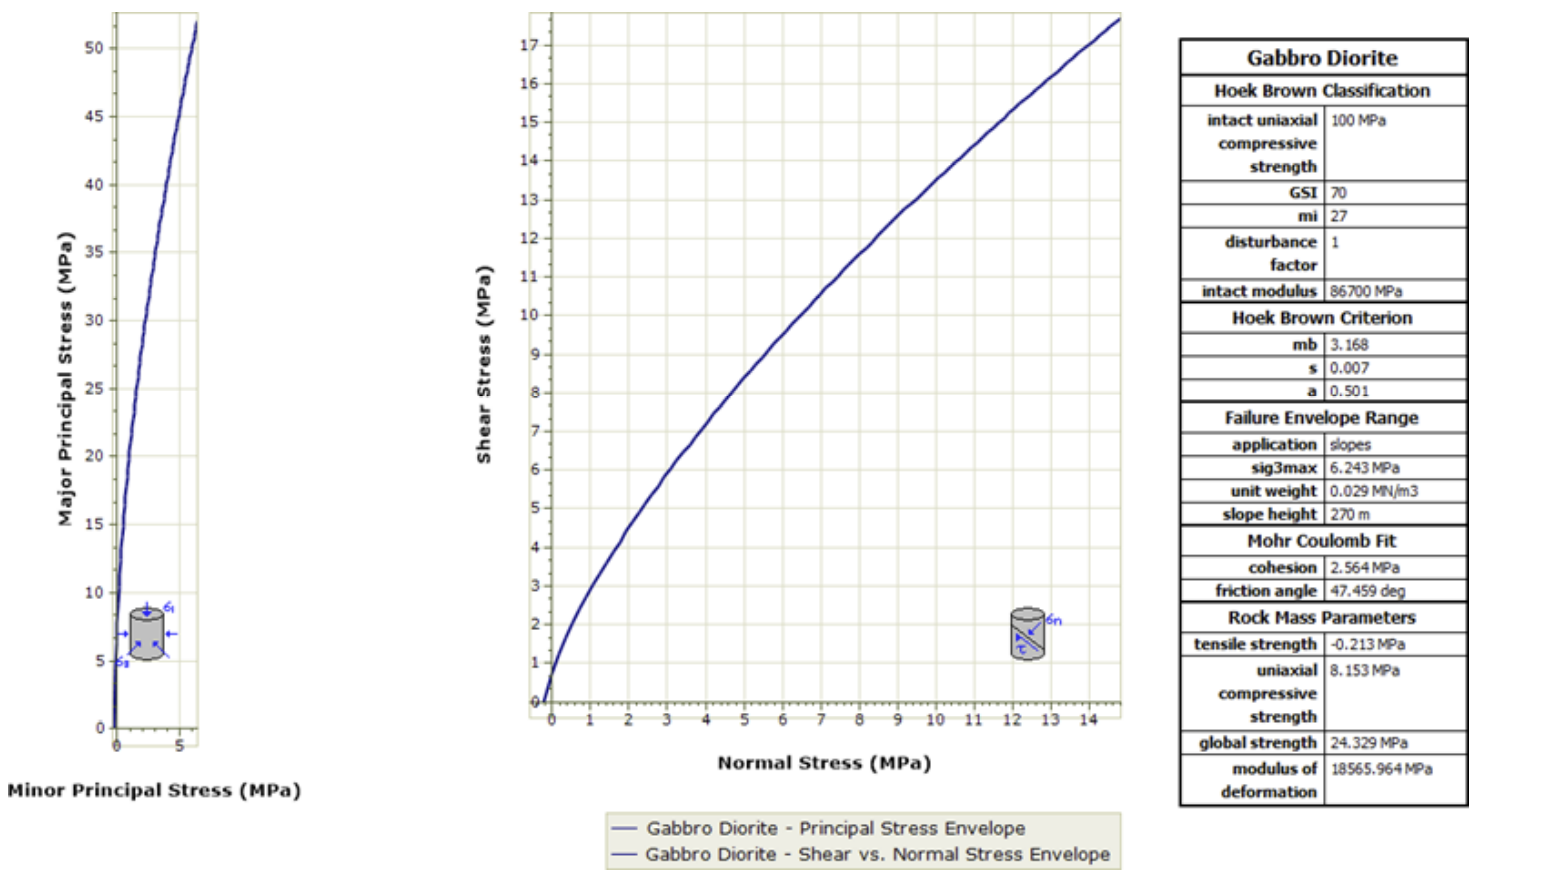
The three rock types identified at Vasilkovskoye were Granite and granodiorite, Quartz diorite / mix-diorite, and Gabbrodiorite. For the rock mass characterization, samples were collected from several boreholes located on the northeast side of the pit. The rock mass rating (RMR) and Geological Strength Index (GSI) were assessed at different elevations within the same region. The representative intact rock, rock mass RMR and GSI are summarized in Table 1.
Rock Type |
Unit Weight (t/m3) |
Young’s Modulus (GPa) |
Pois. Ratio |
UCS (MPa) |
Cohesion (MPa) |
GSI |
Fric tion◦ |
RMR |
mi |
mb |
s |
Granodiorite |
2.6 |
58.9 |
0.24 |
92.9 |
8.18 |
70 |
40.6 |
62/72 |
8.39 |
2.875 |
0.035 |
Quartz Diorite |
2.68 |
86.7 |
0.28 |
114.9 |
13.57 |
70 |
38.9 |
76 |
8.75 |
2.99 |
0.0357 |
Gabbro Diorite |
2.9 |
86.7 |
0.28 |
100 |
13.57 |
70 |
36.9 |
76 |
8.5 |
2.9 |
0.035 |
Table 1. Summarized Intact Rock parameters and Rock Mass RMR and GSI
Evaluation with RSData: Rock mass design parameters
Rock mass design inputs were analyzed and further evaluated using RSData which helped identify the strength characteristics of rocks found in the Vasilkovskoye mine. The results of the assessment are shown in Figure 1.
Rock Type |
Unit Weight (t/m3) |
Tensile strength (MPa) |
UCS (MPa) |
Global strength (MPa) |
Modulus of deform (GPa) |
Cohesion (MPa) |
Friction angle◦ |
mb |
s |
a |
Granodiorite |
2.6 |
0.015 |
0.797 |
8.144 |
2.986 |
1.088 |
33 |
0.57 |
0.0011 |
0.508 |
Quartz Diorite |
2.68 |
0.213 |
9.368 |
29.847 |
18.566 |
2.688 |
50 |
3.64 |
0.007 |
0.501 |
Gabbro Diorite |
2.9 |
0.213 |
8.153 |
24.329 |
18.566 |
2.564 |
47 |
3.17 |
0.007 |
0.501 |
Table 2. Determined Design Data of the rock mass as input for numerical analysis.
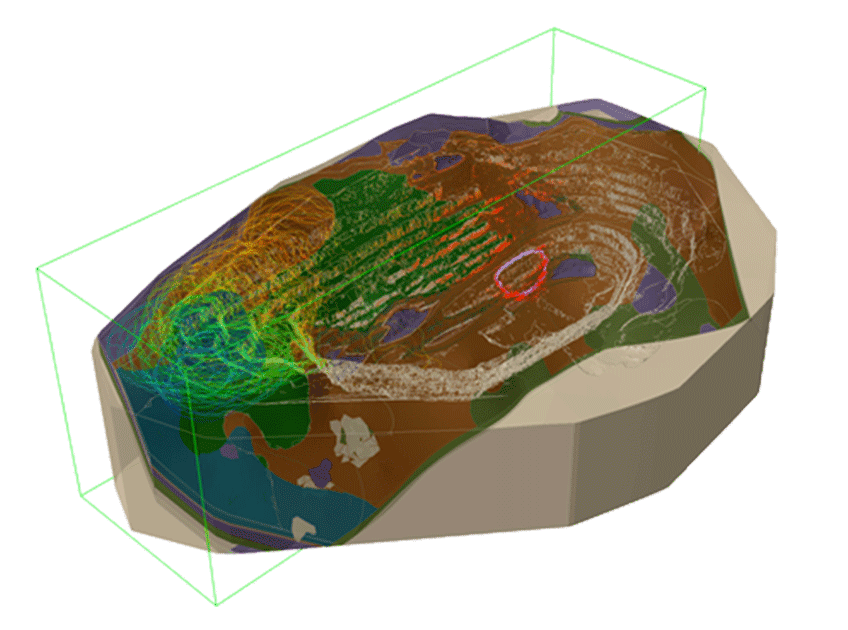
3D Numerical Analysis of the Vasilkovskoe north wall
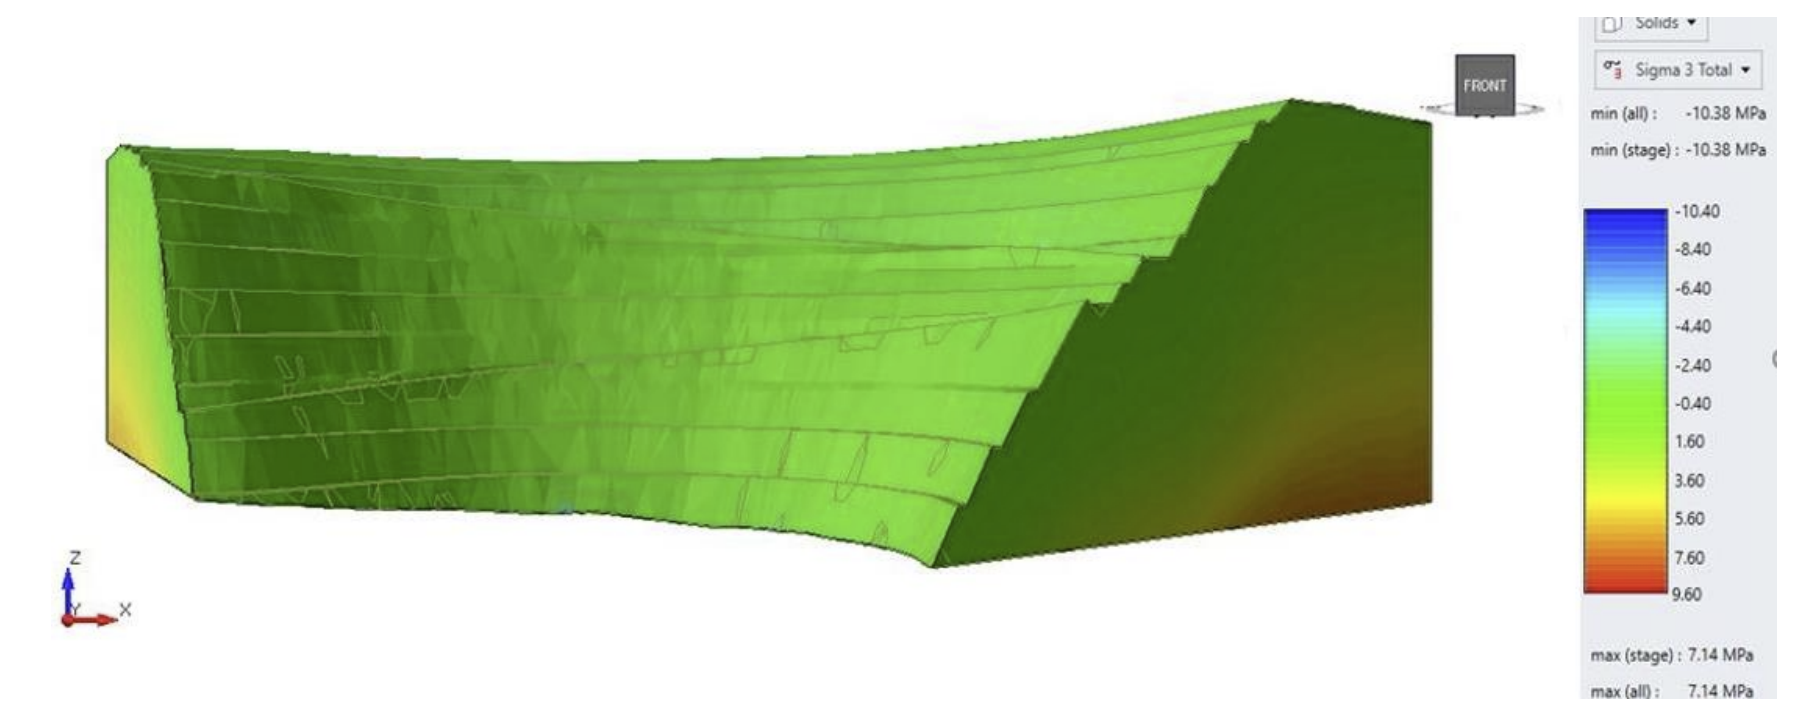
A 3D model of Vasilkovskoe open pit was created in RS3 with an average mesh size of 1 m. The major geological materials were assigned, and the model was restrained with an auto-restrain tool. The maximum and minimum principal stress distributions for the pit region are outlined in Fig 4 and Fig 5.
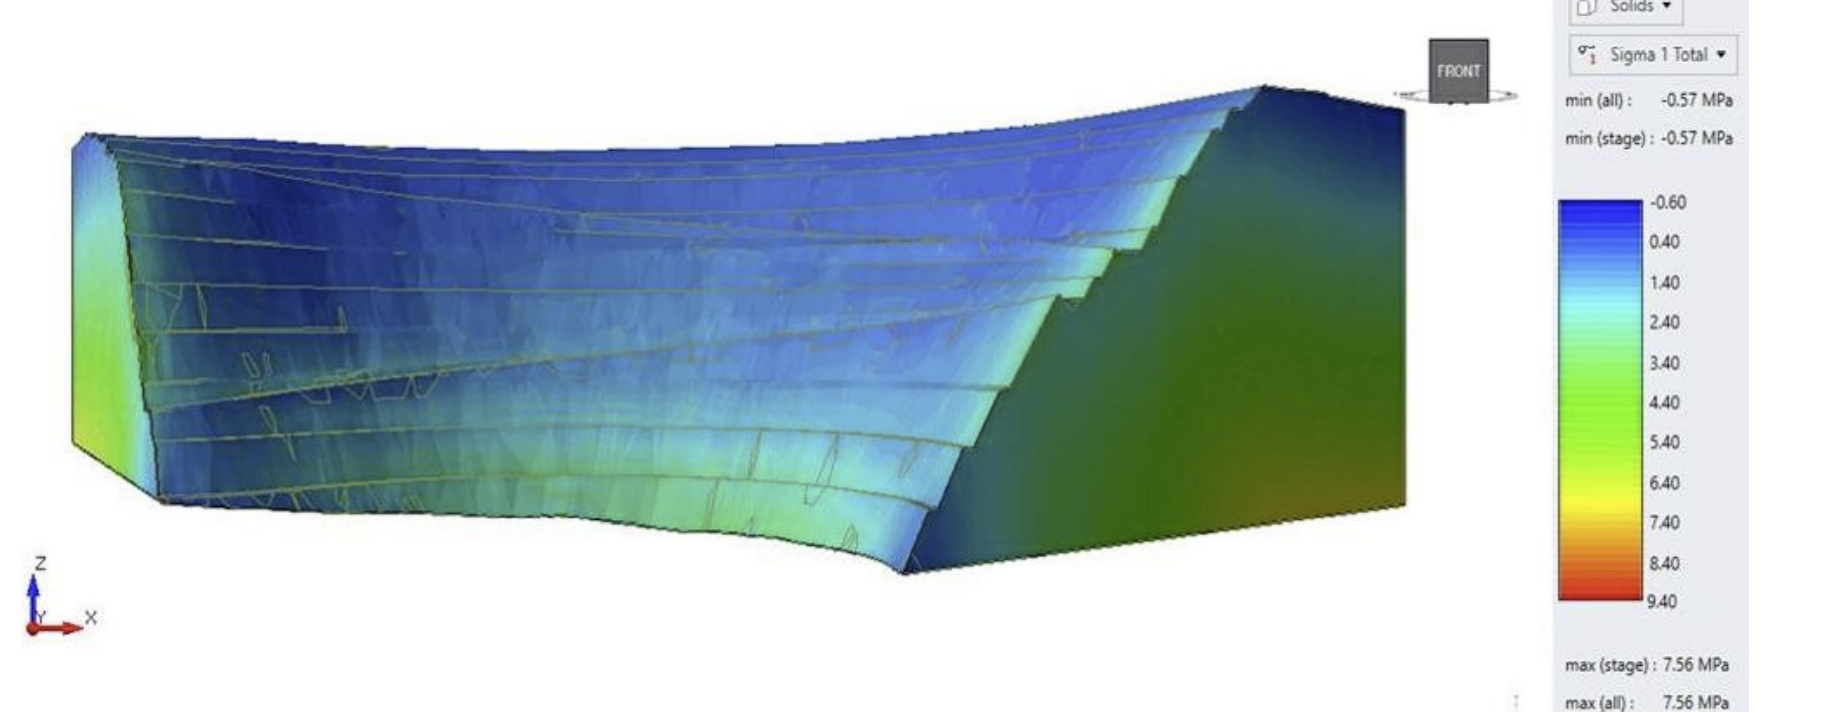
RS3’s simulation results show the calculation of the maximum principal stress as 7.56 MPa (Figure 4) and the minimum principal stress as 7.14 MPa (Figure 5). The analysis found that both stresses impact the basement of the north wall with the greatest compressive stress, which indicates lithostatic load because of the overlaying layers in rocks and gravity, causing pressure on each layer of rock to increase with depth.
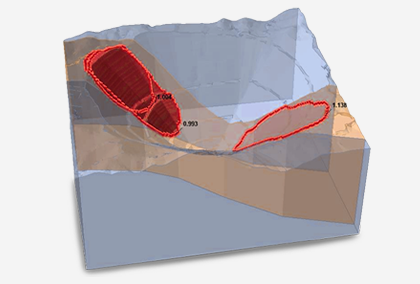
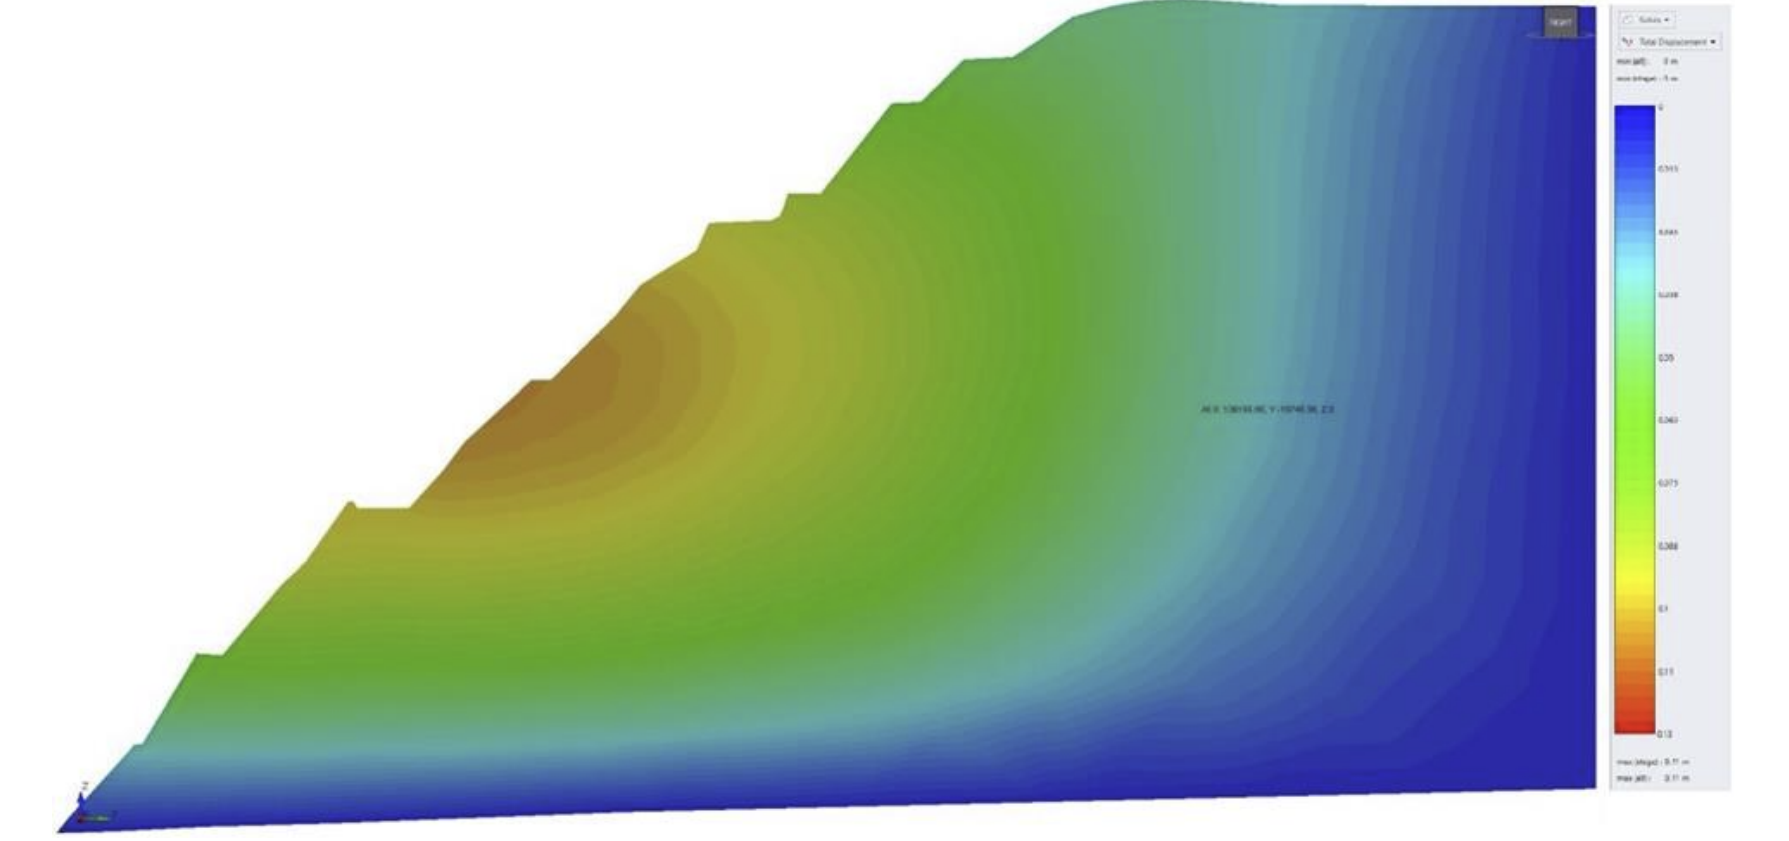
Results collected from the overall rock mass stability analyses revealed that the design planned for the pit walls was likely to have instability including potential failure mechanisms that could involve multiple benches. Figure 6 and Figure 7 illustrate the distribution of total displacements in the north wall region.
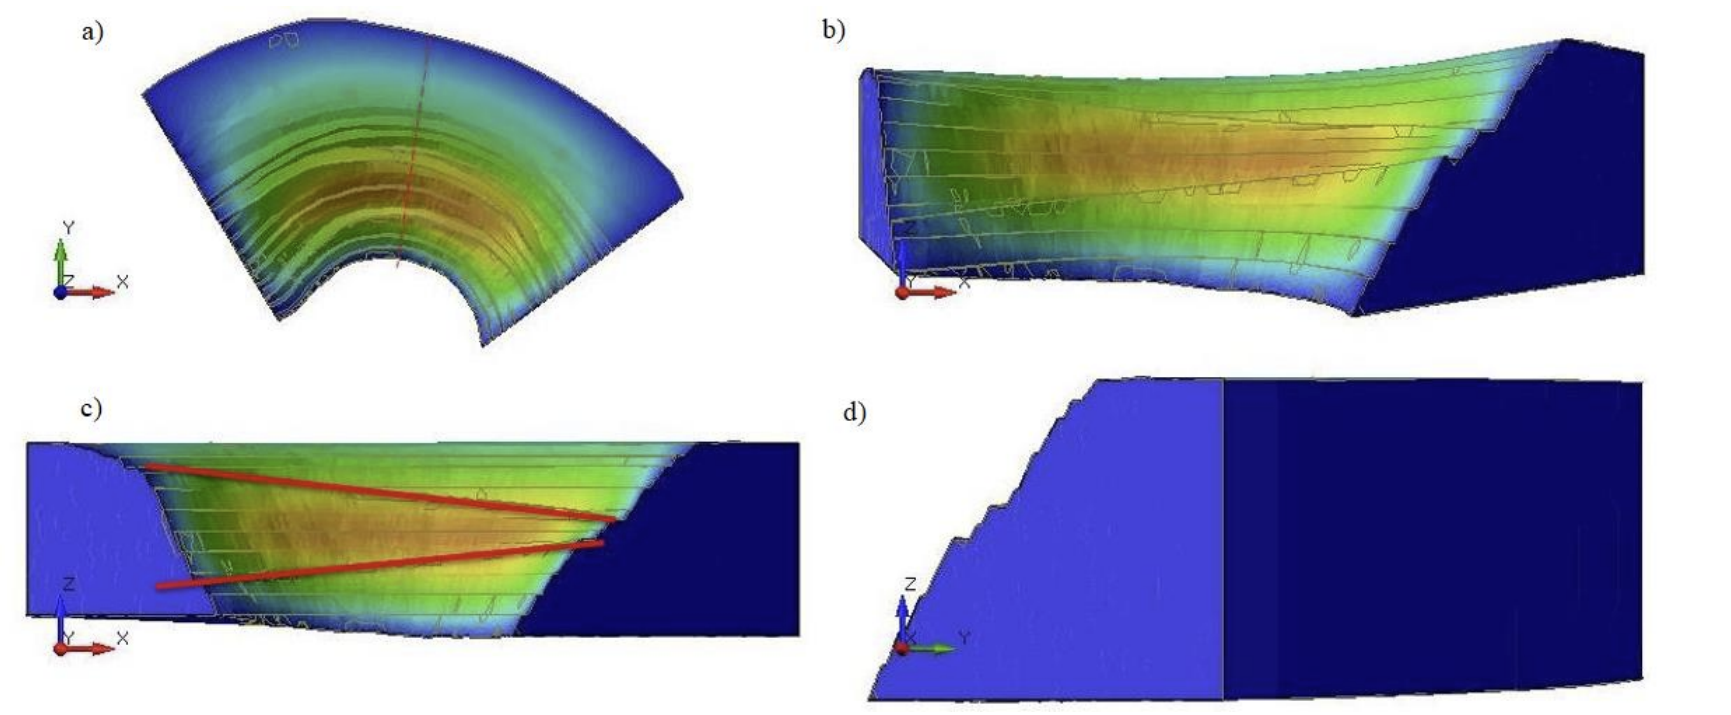
It can be seen in Figure 6 that the central section of the north wall had the highest potential of instability within the whole structure and the total size of the most unstable area was about 120 meters in length, 50 meters in height, and 10 meters in depth. In this case, the predicted maximum displacement was about 0.11 metres.
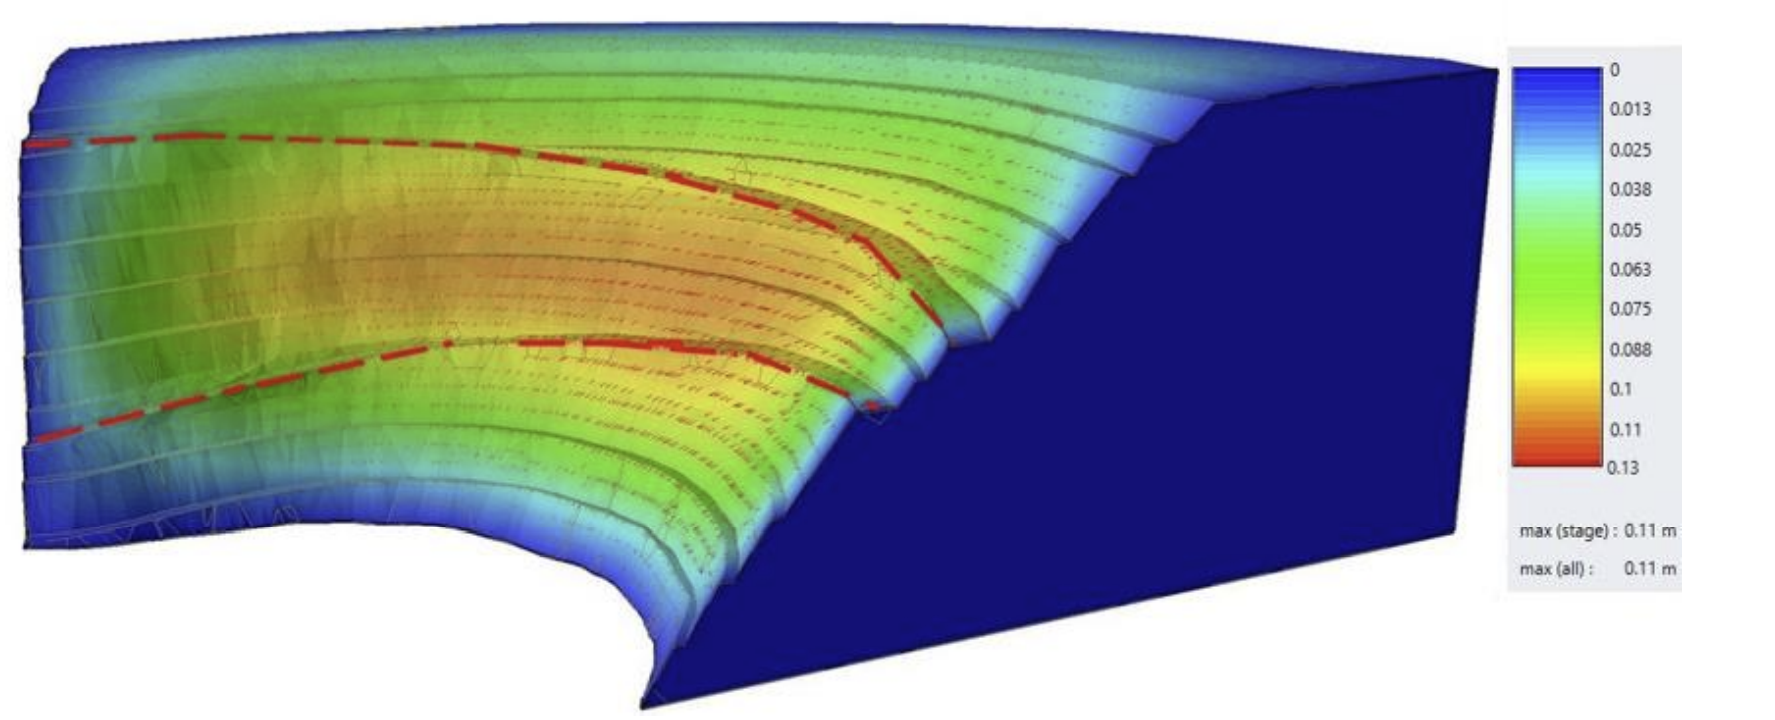
Through RS3’s advanced finite element analysis, the detailed displacement vectors were captured, which is shown in Figure 8. This simulation predicted the potential direction of the rock movement as the vectors draw attention to the center of the pit, indicating that there was a risk of several bench failures.
Final thoughts on the RS3’s 3D numerical modeling of pit wall deformations and failures
While traditional methods provide insight into a slope’s stability, RS3’s 3D finite element modeling offers a more comprehensive and detailed look at the potential deformations and failure mechanisms.
For further exploration into the safety of your slopes, we recommend using RS3’s Shear Strength Reduction method for a more advanced slope stability analysis.