Optimizing Slope Monitoring and Hazard Management to Near Real-time with Drone Photogrammetry – Transberg Method
Kinematic Instabilities – Critical Hazards in Mining Operations
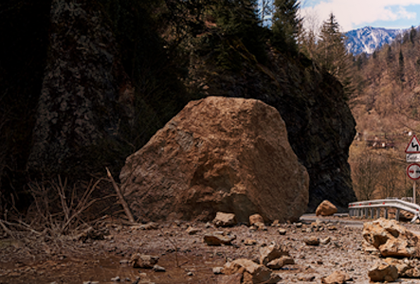
In open-pit mining, kinematic instabilities frequently manifest as rockfalls, creating serious risks to workforce safety and disrupting production continuity. When left unaddressed, these failures can endanger personnel, damage equipment, and halt production, turning routine operations into costly delays. The ability to rapidly detect, analyze, and mitigate such hazards is therefore essential for modern mines seeking to balance safe working conditions with operational efficiency.
The strength of the Transberg Method lies in Rocscience’s interoperable ecosystem, particularly the seamless cooperation between ShapeMetriX (3GSM), RocSlope3, and RocFall3. UAV photogrammetry captured on site is processed in ShapeMetriX to generate robust 3D slope models and structural maps. This geologic data is then seamlessly exported into RocSlope3 for 3D kinematic block stability analysis and further evaluated in RocFall3 to simulate runout and optimize mitigation strategies. Together, these tools form an integrated workflow that transforms field data into reliable hazard assessments in near real-time.
Transberg Method
The engineers at Encompass Mining developed the Transberg Method, outlined by Guy and Sjoberg (refer to paper 195 in EUROCK2025 proceedings), by leveraging the interoperability between Rocscience’s RocSlope3 and RocFall3 and 3GSM’s ShapeMetriX. This collaboration demonstrates the power of Rocscience’s ecosystem, where tools built for different phases of geotechnical analysis work seamlessly together to deliver a start-to-end solution for slope hazard management.
The method consists of:
- Capture UAV images of the slope
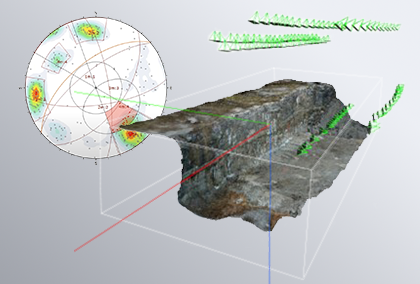
- Process the captured data in ShapeMetriX to generate a 3D model and perform structural geologic mapping in ShapeMetriX’s Analyst tool to capture discontinuity type, dip, dip direction, location and continuity. Automatically cluster to determine the joint sets and display spatially on the generated 3D model
- Export joint data from ShapeMetriX into RocSlope3 for a 3D kinematic analysis to identify possible block failure zones and to locate removable blocks.
- Areas with factor of safety (FoS) close to 1 are output in a heat map and overlain on the existing slope surface.
- Perform RocFall3 analysis for key zones of interest to assess rockfall run-out. Rock size and restitution coefficients are determined in the field, or from analyzing the generated 3D model for existing rock fall events and trajectories. The results of the rockfall analysis are used to determine mitigation strategies (i.e., bunds).
- Generate rockfall hazard maps using RocFall3 results and determine the most efficient overall mitigation strategy.
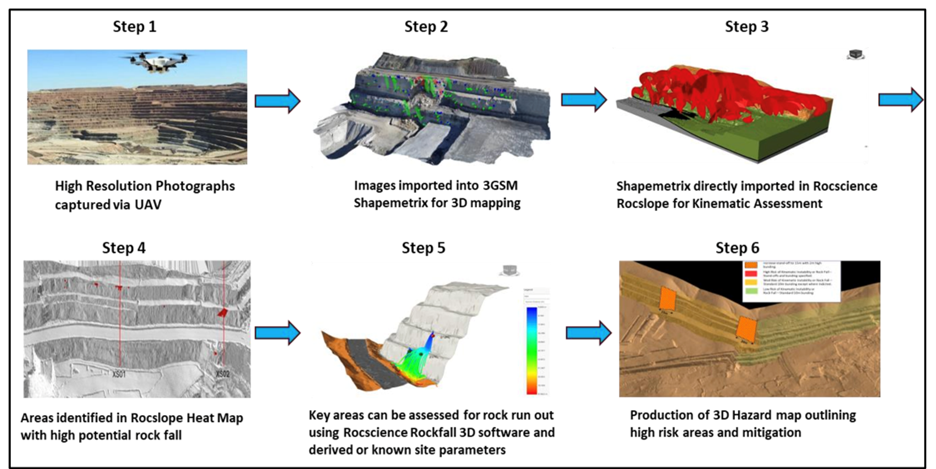
The Transberg Method is summarized in the image below.
A Case Study in New South Wales, Australia
The Transberg Method was trialed at an open-cut coal operation in central New South Wales that had been experiencing frequent, small to moderate kinematic and rockfall events. These hazards regularly disrupted activities such as drilling and blast-hole loading, and a recent kinematic failure had even restricted a haul road to a single lane. Discontinuity mapping at the site had historically been inconsistent and limited to major structures, making it a strong candidate to apply a UAV-driven, integrated hazard assessment method.
Open-pit mining at the site was done through strip-mining using truck and shovel equipment to extract overburden/interburden and coal. The advancing highwall and residual end wall were developed in Permian-age sedimentary units including sandstone, siltstone, mudstone, and conglomerate with unconfined compressive strengths of 20–50 MPa. Structural mapping identified joints trending east–west and northwest–southeast. Within the pit, normal faults typically exhibited throws <2 m and dipped steeply north at 70–80°, while thrust faults showed throws of up to ~6 m with similar dips (70–80° northward). This combination of rock strength variability and steeply dipping faults created a structurally complex slope environment with elevated susceptibility to kinematic instability.
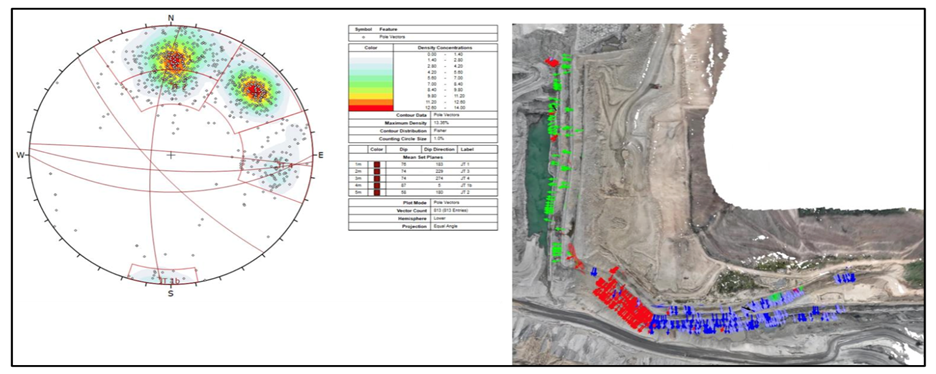
A UAV survey of the 5 km pit slope (Step 1) was completed in roughly two hours. The images were processed in ShapeMetriX (Step 2), generating a georeferenced 3D model of the highwalls and mapping 813 discontinuities.

The discontinuities were plotted on an equal angle, lower hemisphere stereonet in DIPS, which identified four discontinuity sets represented by two major and two minor sets.
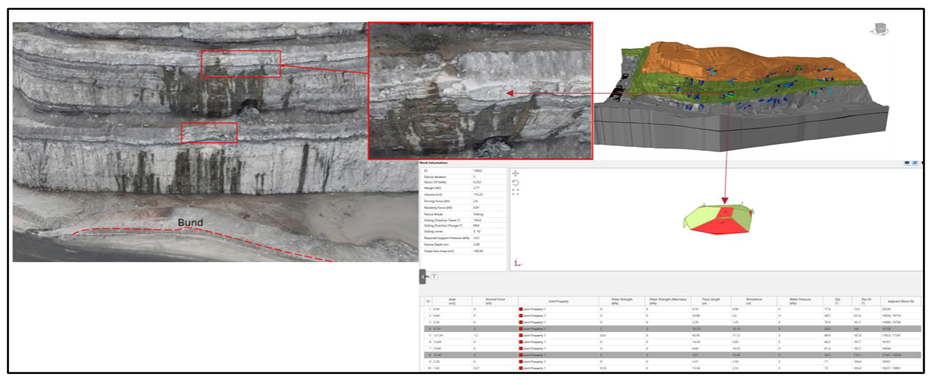
After the initial mapping of discontinuities, the georeferenced data and topographic and underlying geology surfaces were imported into RocSlope3 for block stability analysis (Steps 3 and 4). Most pseudo-stable blocks were identified on the northern highwall. Comparison of analysis results to known rockfall hazards yielded new areas of potential failure. The largest block (115m3) from the analysis was on the second bench crest above the pit floor on the northern highwall and is shown below overlain with a photo of the pit.
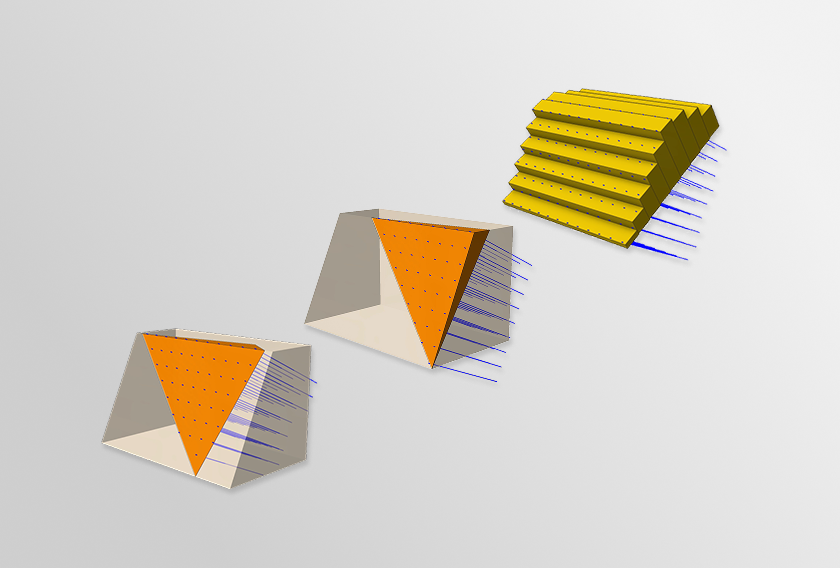
The identification of new potential locations of failure led to the assessment of additional mitigation measures. Separation and bunding were chosen as the mitigation measures and the optimal wall stand-off distance and bund dimensions were determined through a RocFall3 analysis (Step 5).
Coefficients of normal and tangential restitution were determined from back analysis of known rockfalls identified in the original 3D model where the origin, wall type, rock size and run-out distances were able to be measured. A point seeder (115m3) was used for the main volume identified from the RocSlope3 analysis, while a line seeder was used for more minor rocks with smaller volumes (8m3, 27m3, 64m3).
The output from the RocFall3 analysis is shown below, with a mean runout distance of about 30m. Using the analysis outputs, an effective earth bund was constructed to act as a rockfall barrier and reduce the associated hazard. In parallel, a slope stability radar was installed to track wall deformation, with its scan area specifically defined based on the kinematic hotspot map results.

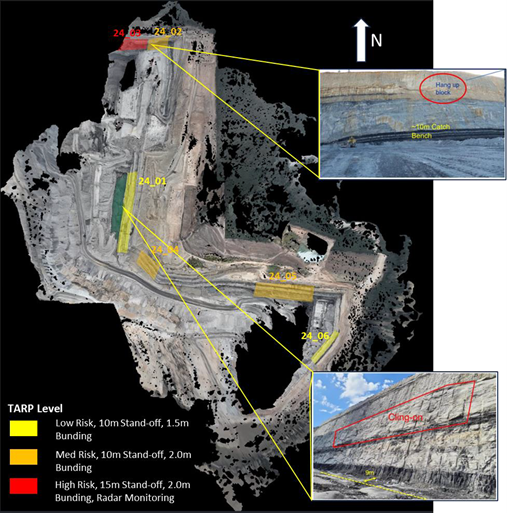
The 3D kinematic assessment identified priority areas for hazard mitigation, such as the placement of rockfall bunds, implementation of slope monitoring, and targeted inspections. This approach was applied at multiple locations across the mine, with outcomes presented as a hazard map that included recommended controls tailored to the activities underway at each site. Hazard zones were then assigned a Trigger Action Response Plan (TARP) level based on the residual operational risk (Figure 6).
This site went from sparse, manual data collection to comprehensive, rapid hazard analysis — resulting in improved safety, minimized downtime, and optimized extraction.
The Value of Integrated Hazard Management
The Transberg Method illustrates the strength of combining ShapeMetriX, RocSlope3, and RocFall3 into a single hazard management workflow. By linking photogrammetry, structural mapping, kinematic analysis, and rockfall modeling, engineers can move rapidly from field data to practical, site-specific mitigation.
Key benefits observed include:
- High-resolution hazard maps that capture both geological structure and operational context.
- Clear identification of priority risk zones, supported by quantified stability and runout parameters.
- Targeted mitigation design, such as optimized bund dimensions and focused monitoring zones.
- Operational efficiency, with reduced downtime and enhanced workforce safety.
Rather than relying on periodic manual mapping or stand-alone assessments, this workflow enables mining operations to adopt a routine, near real-time hazard assessment process. The outcome is not only safer operations but also more predictable production, optimized resource recovery, and greater confidence in slope performance.
Mining operations facing kinematic instability should not wait for the next rockfall to drive change. By embedding interoperable tools like ShapeMetriX, RocSlope3, and RocFall3 into everyday practice, engineers can transform hazard management from a reactive task into a proactive safeguard – protecting people, equipment, and production before the next failure occurs.