Answering “What, Where & How Much:” How RocFall3's Barrier Design is Enhancing Risk Mitigation
Risk mitigation is crucial when analyzing rock falls, and designing barriers is a key component of this. However, this task can be challenging as there are many variables to consider such as the barrier height, extent, and capacity. To help answer the questions of "what barriers are required, where to put them, and how much do they need to withstand," a set of new capabilities have been added to RocFall3 to help with your barrier design. These versatile functionalities will allow you the flexibility to better visualize the characteristics of rockfall impacts on each barrier, so that you can make safer and more cost-effective decisions.
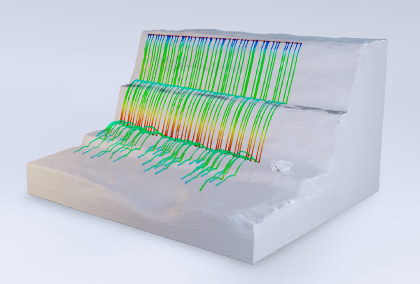
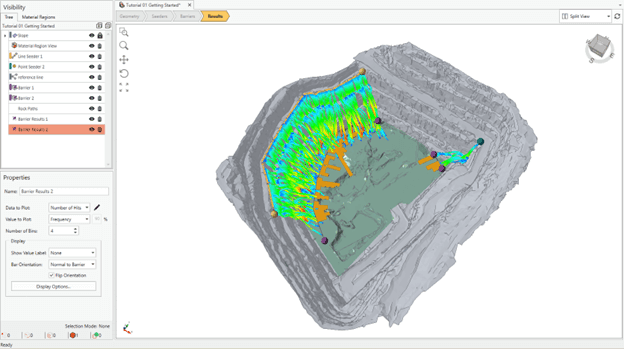
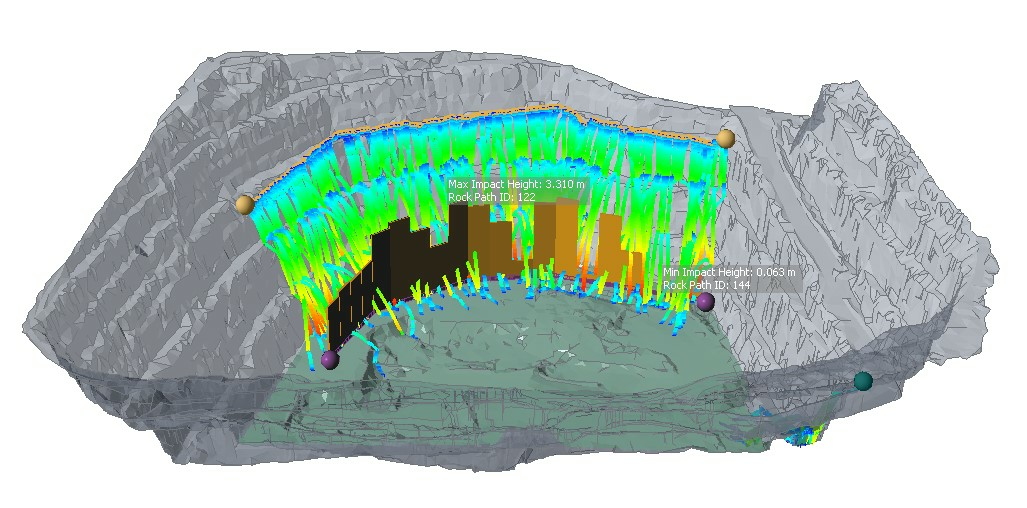
Visualizing Impacts on 3D Models
The new 3D graphing option in RocFall3 will add more power to your rockfall analysis and mitigation plan by allowing you to graph data from impacting rocks along barriers in your model and visualize them on your 3D model. This visual representation will facilitate a deeper understanding of where a barrier is most affected by rockfalls in terms of the number of impacts, impact energy, rock bounce height, and passing rate. This will allow you to evaluate different barrier types and locations efficiently, to help you find the optimal solution.
How can you benefit from it?
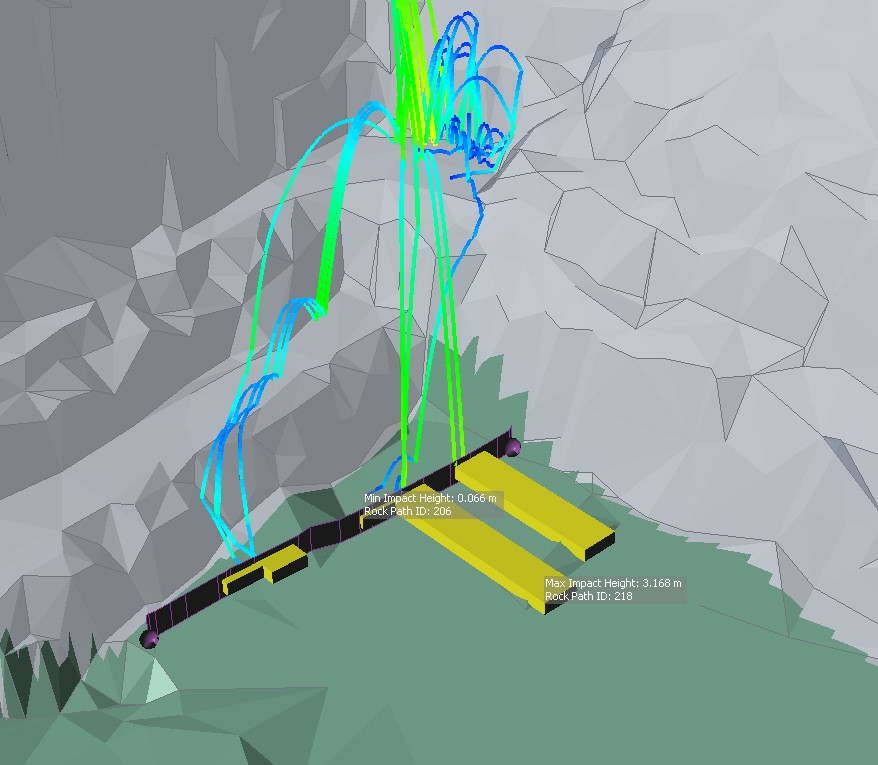
- By visualizing the parameters of impacts on different barriers directly on your model, you're given the flexibility to analyze and select the most effective barriers for the potentially impacted zones.
- You can plot data on more than one barrier and compare different barriers' performance.
- You have the flexibility to apply properties to all 3D plots simultaneously or customize each plot as per your needs.
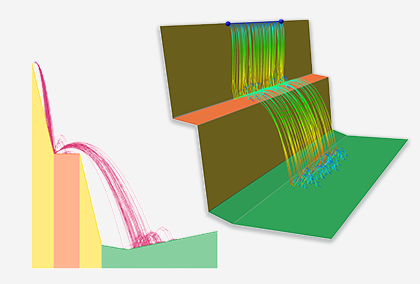
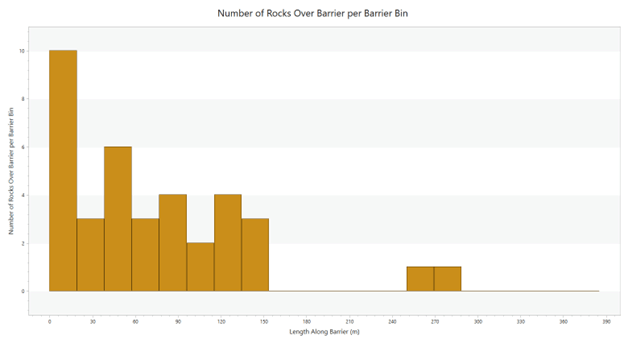
Graph along barriers in 2D
The 3D barrier plot can also be "stretched" and plotted in a regular 2D chart, with x-axis = length along the barrier. Seamlessly graph data along barriers using the 2D chart view option, where the x-axis represents the length along the barrier, and the y-axis represents the value to plot. This feature is similar to the 3D plot but unfolded into a 2D chart view.
How can you benefit from it?
- Create any number of 2D charts for analyzing different aspects of barrier performance, such as impact energy or rock bounce height, along the length of the barrier.
- This option provides a more detailed view of the barriers’ performance along its length to help you identify specific sections that may need more attention.
- You can easily export the 2D charts for use in your reports or presentations, helping to communicate the design process more effectively.
Withstand the Impact of Falling Rocks with Effective Barrier Designs
These new options in RocFall3 will provide you with the ability to better visualize the impacts along barriers, so that you can make more informed design decisions to improve the cost-efficiency of your project and mitigate the risk of damage and delays caused by rockfall hazards. These features will be available in the upcoming release of RocFall3.