Meet DIPS: The New Standard in Orientation Analysis
For more than 30 years, DIPS (Data Integration using Projected Stereonets) has set the benchmark for stereonet-based analysis of orientation data, becoming a trusted reference across geotechnical and mining engineering worldwide. It began as a focused stereonet plotting tool and has evolved in lockstep with advances in field data collection, consistently delivering what engineers need most: reliable data processing, clear visualization, and the confidence to interpret structural geology correctly.
DIPS marks a bold new chapter in orientation analysis, delivering a modern, interface-driven experience built for high volume digital geology workflows. It keeps engineers in control of dense datasets and rapid decisions, uniting this modern interface with kinematic and jointing analysis at scale, big data performance, Python-powered automation, and deep integration across the Rocscience ecosystem.
From Manual Measurements to High-Resolution Digital Geology
Orientation mapping once meant geologists standing on the rock face, collecting one joint measurement at a time with compass clinometers, tapes, and notebooks. These careful, hands-on campaigns typically produced datasets in the hundreds: enough for meaningful interpretation, but constrained by access, time, and safety.
Today, drone photogrammetry, LiDAR, and high-resolution imaging have transformed that reality. Entire slopes and excavations can be captured in hours, yielding tens of thousands — or even millions — of orientation measurements and associated attributes. The challenge is no longer how much data can be collected, but how much of it can be analyzed with rigor and confidence.
DIPS is engineered precisely for this environment. It brings together largescale data handling, multisource integration, and automation-ready workflows so that orientation analysis keeps pace with modern digital geology.
Built for Big Data: Orientation Analysis at Scale
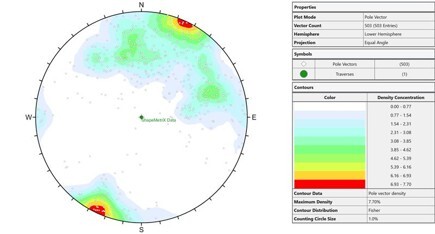
A the core of DIPS is a decisive leap in capacity and performance. Earlier versions of Dips imposed an 8,000 pole limit — sensible in a manual era, but increasingly unworkable when fracture networks are extracted from dense point clouds and photogrammetric models.
DIPS removes that ceiling. The platform is designed to work efficiently with datasets exceeding one million poles, allowing engineers to import fracture orientations from ShapeMetriX models, consolidate borehole data from multiple sites, and analyze complete orientation inventories without thinning or compromise.
This capability is enabled by a reengineered computational engine optimized for high volume work. Advanced memory management, multithreaded computation, and asynchronous interaction ensure that even very large datasets remain responsive to pan, filter, and replot — turning what used to be a performance bottleneck into an everyday workflow.
Advanced Workflows with Python Automation and API Control
Modern rock engineering teams rely on scripted workflows, reproducible pipelines, and integration with broader data and modelling environments. DIPS embraces this reality with a Python scripting API that opens the application to programmatic control for expert users.
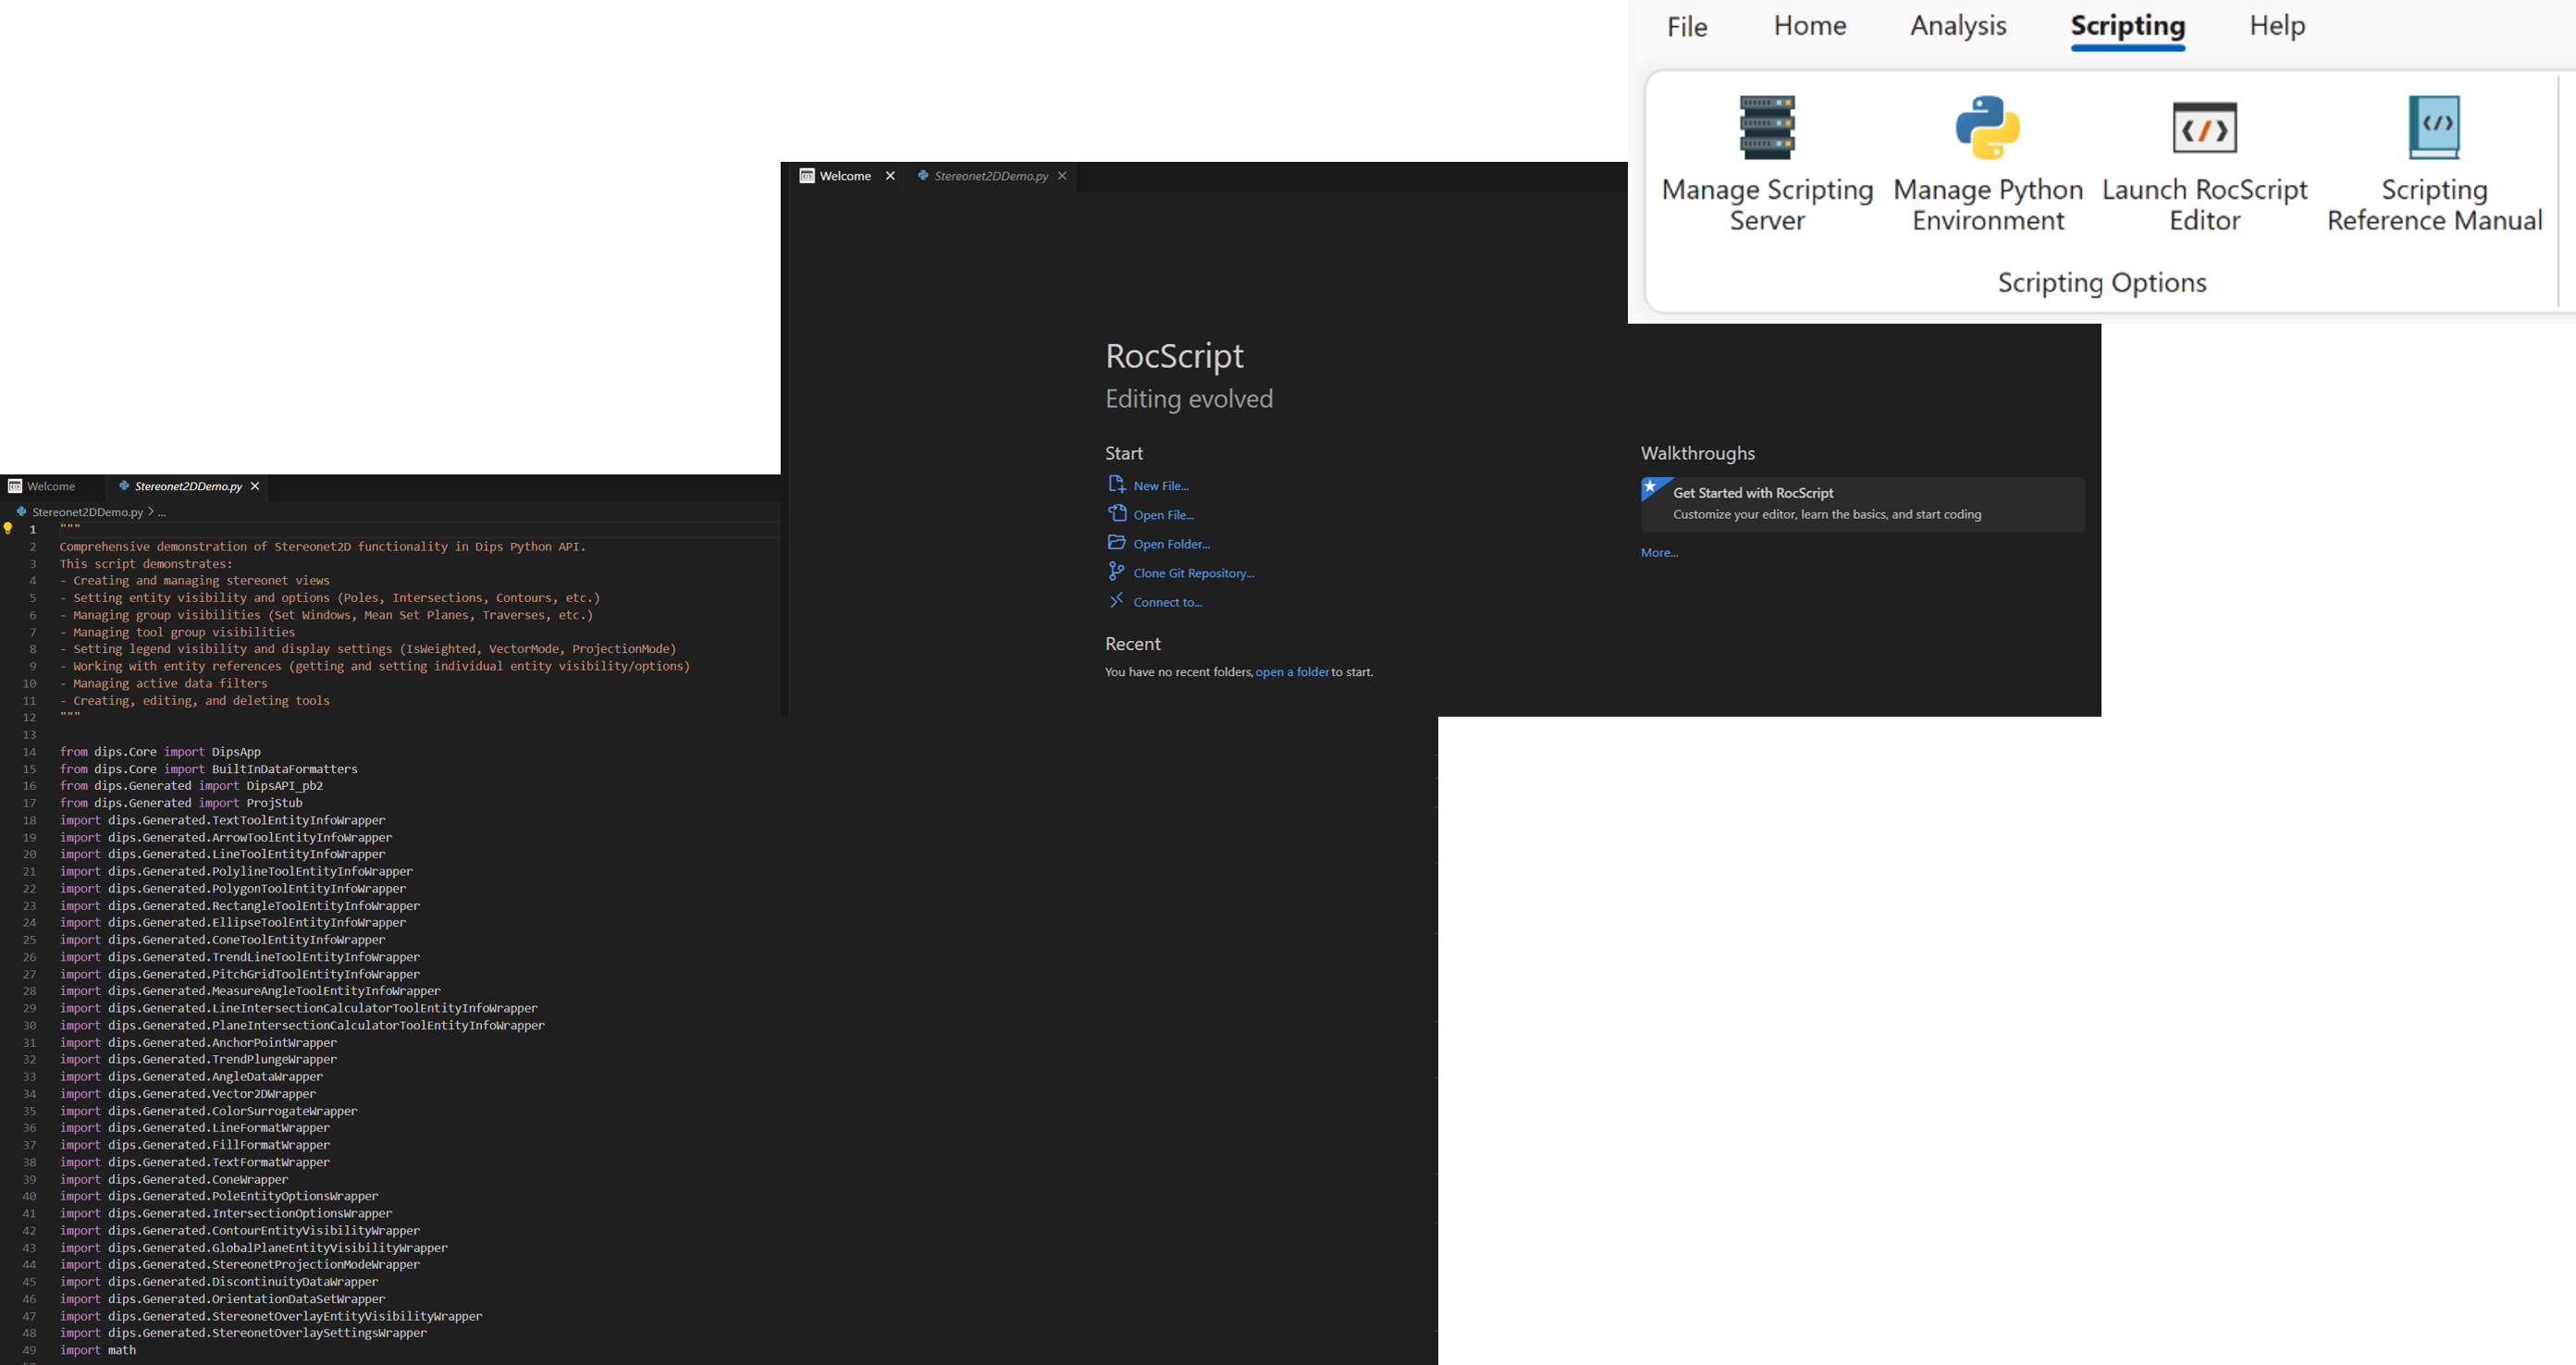
Engineers can automate preprocessing, analysis, and postprocessing directly from Python: cleaning large datasets, running custom kinematic or jointing analysis sequences, and exporting standardized outputs or reports on demand. This shifts DIPS from a purely UI driven tool to a flexible analysis engine that plugs naturally into in-house scripts, enterprise data platforms, and advanced research workflows.
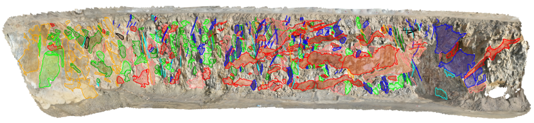
From Boreholes and Surface Models to Stereonets: RSLog and ShapeMetriX Integration
Subsurface investigations generate critical structural information along boreholes, and DIPS is built to pull that information into orientation analysis without friction. Direct integration with RSLog — Rocscience’s borehole logging solution — uses online and offline APIs to bring discontinuity data from the field straight into DIPS.
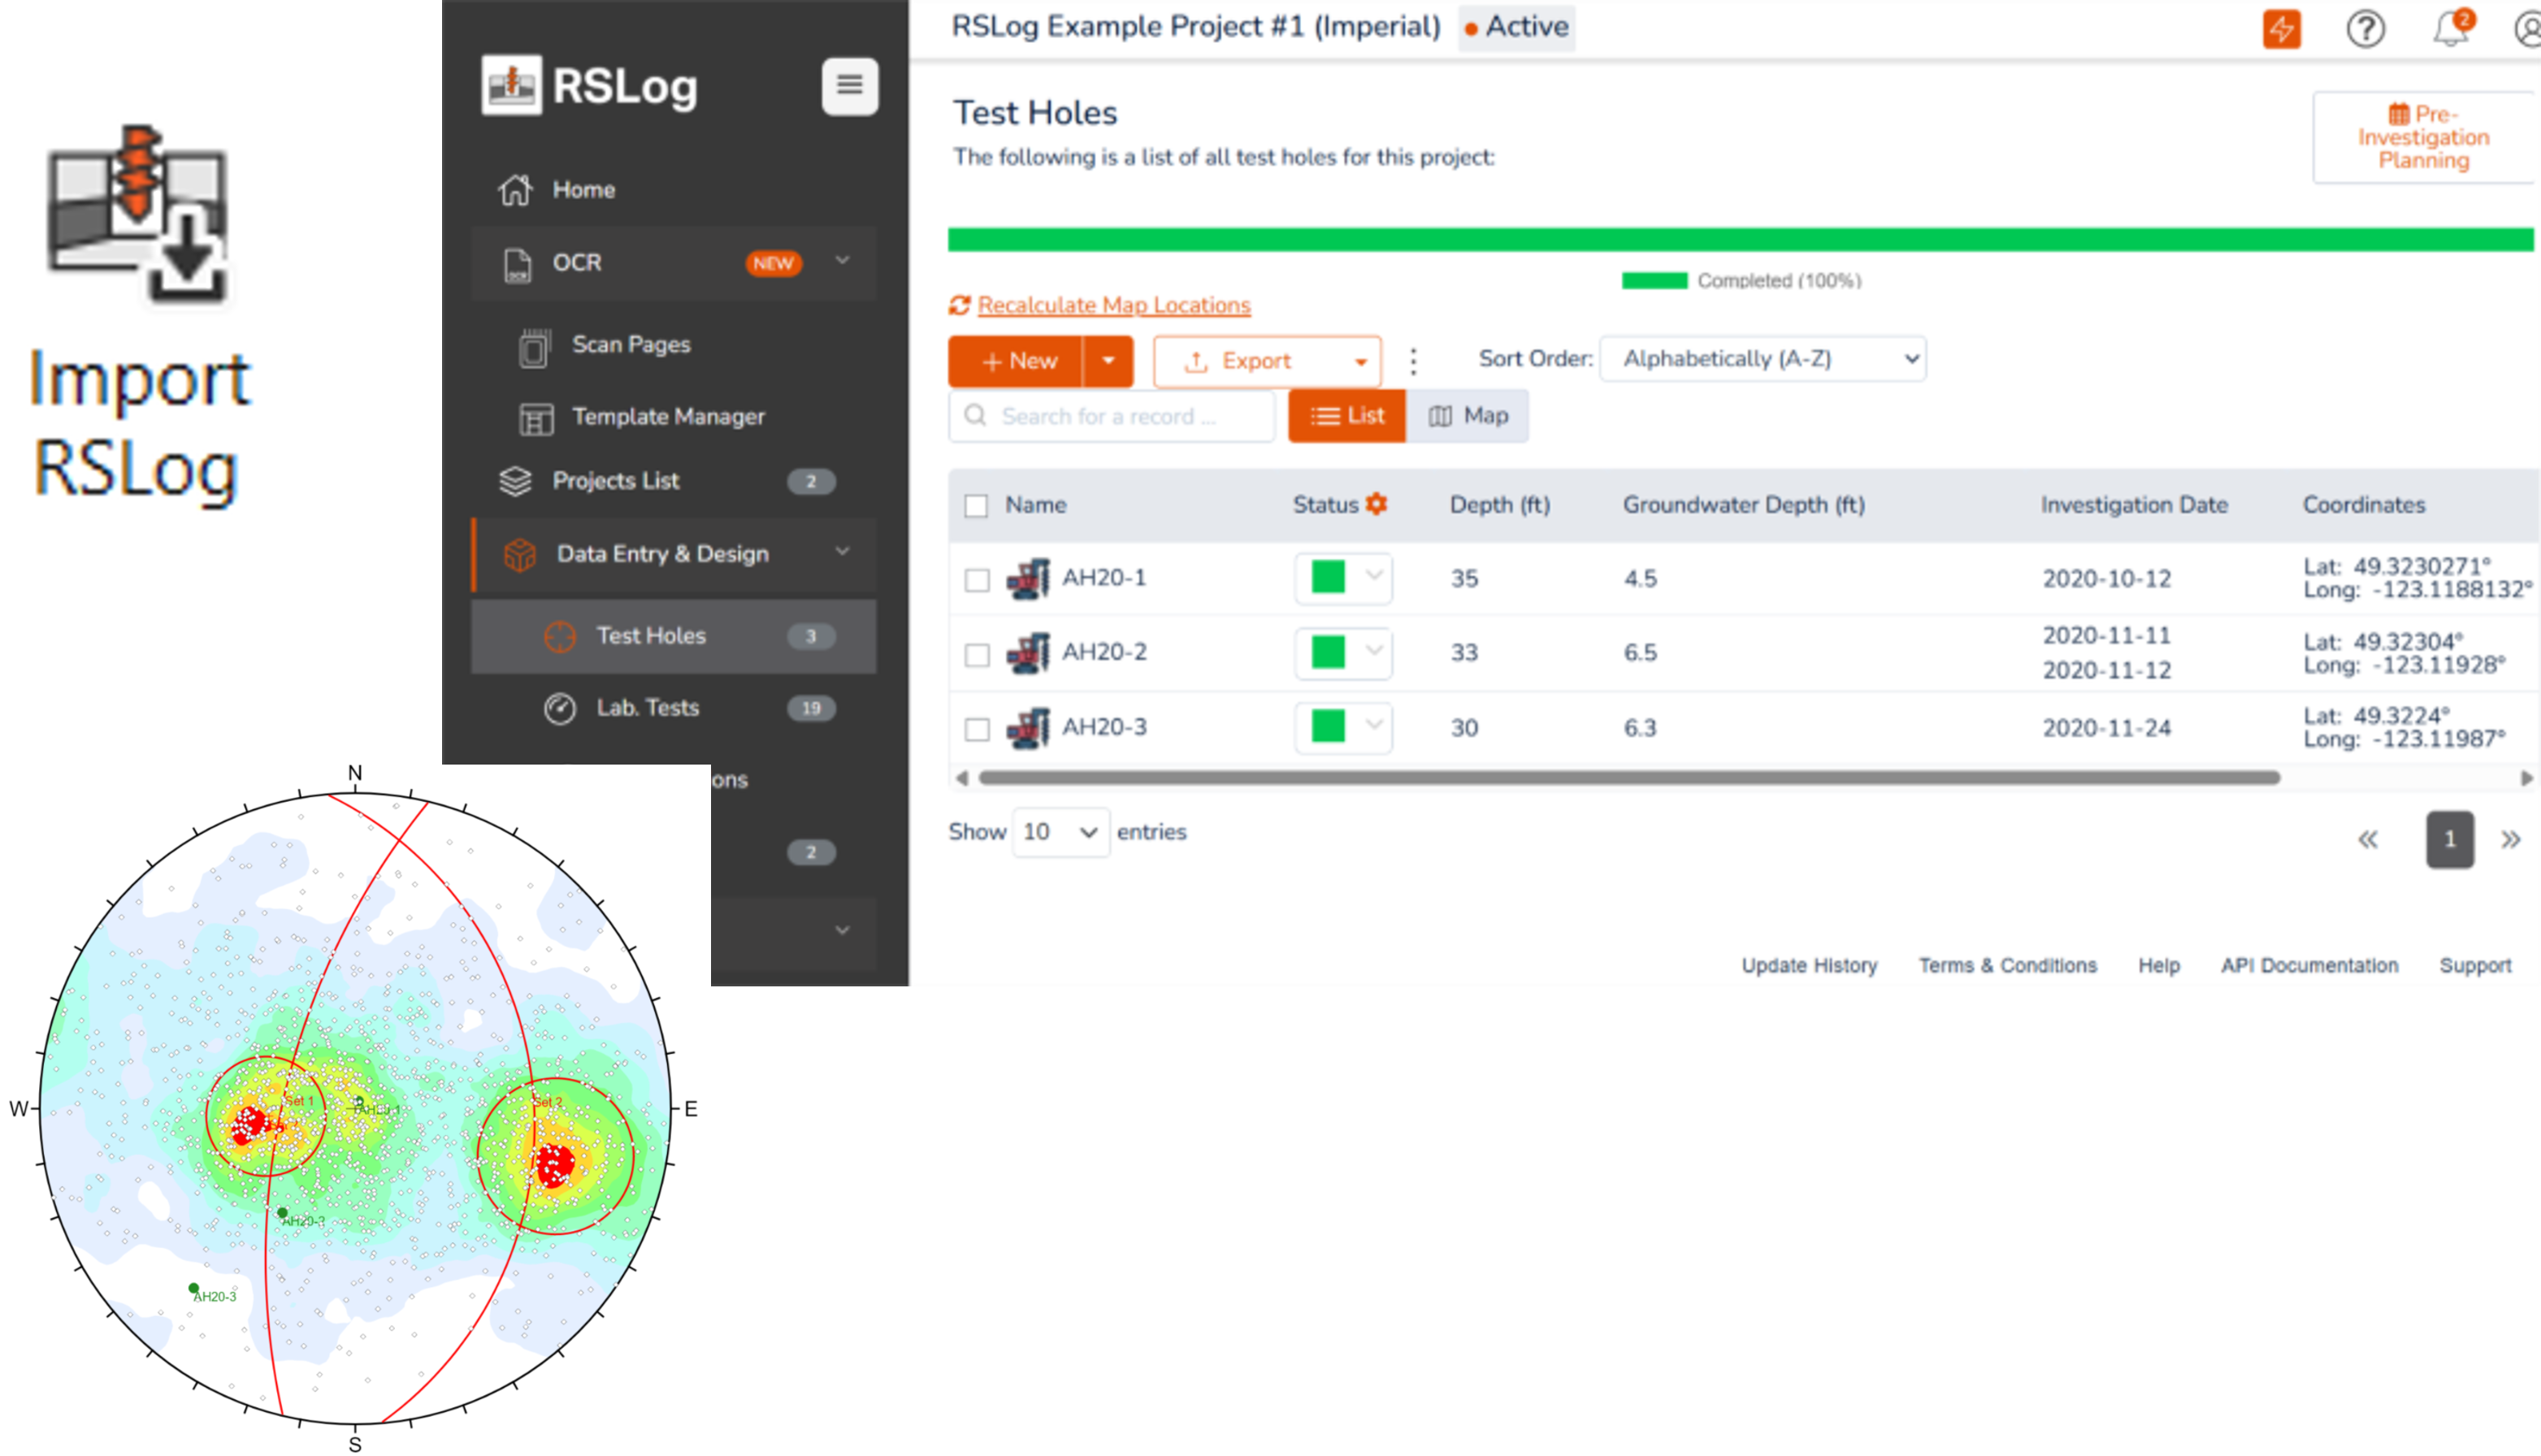
DIPS also complements workflows built on ShapeMetriX, enabling fracture orientations derived from digital surface models to be brought seamlessly into stereonetbased analysis. Together, these integrations help unify orientation inputs from boreholes and exposed rock faces within a single analytical environment.
This connected approach eliminates manual file handling and transcription, reduces the risk of errors, and accelerates this capability of transition from data acquisition to structural interpretation. Positioned within the Rocscience ecosystem and alongside stability tools such as UnWedge, RocSlope2, RocSlope3, and RocTunnel3, DIPS becomes a go-to hub for rock engineering analysis input.
Synthetic Joint Sets and Scenario Exploration
Not every analysis starts with measured data. Concept development, teaching, and early-stage design often require engineers to explore “what if” scenarios before field programs are complete. DIPS includes a synthetic joint and joint set generator to create and manipulate artificial datasets directly inside the platform.
This capability supports training, benchmarking, and sensitivity studies, allowing users to examine how different orientation distributions affect kinematic behaviour, jointing characterization, and downstream stability assessments — without waiting for full field datasets.
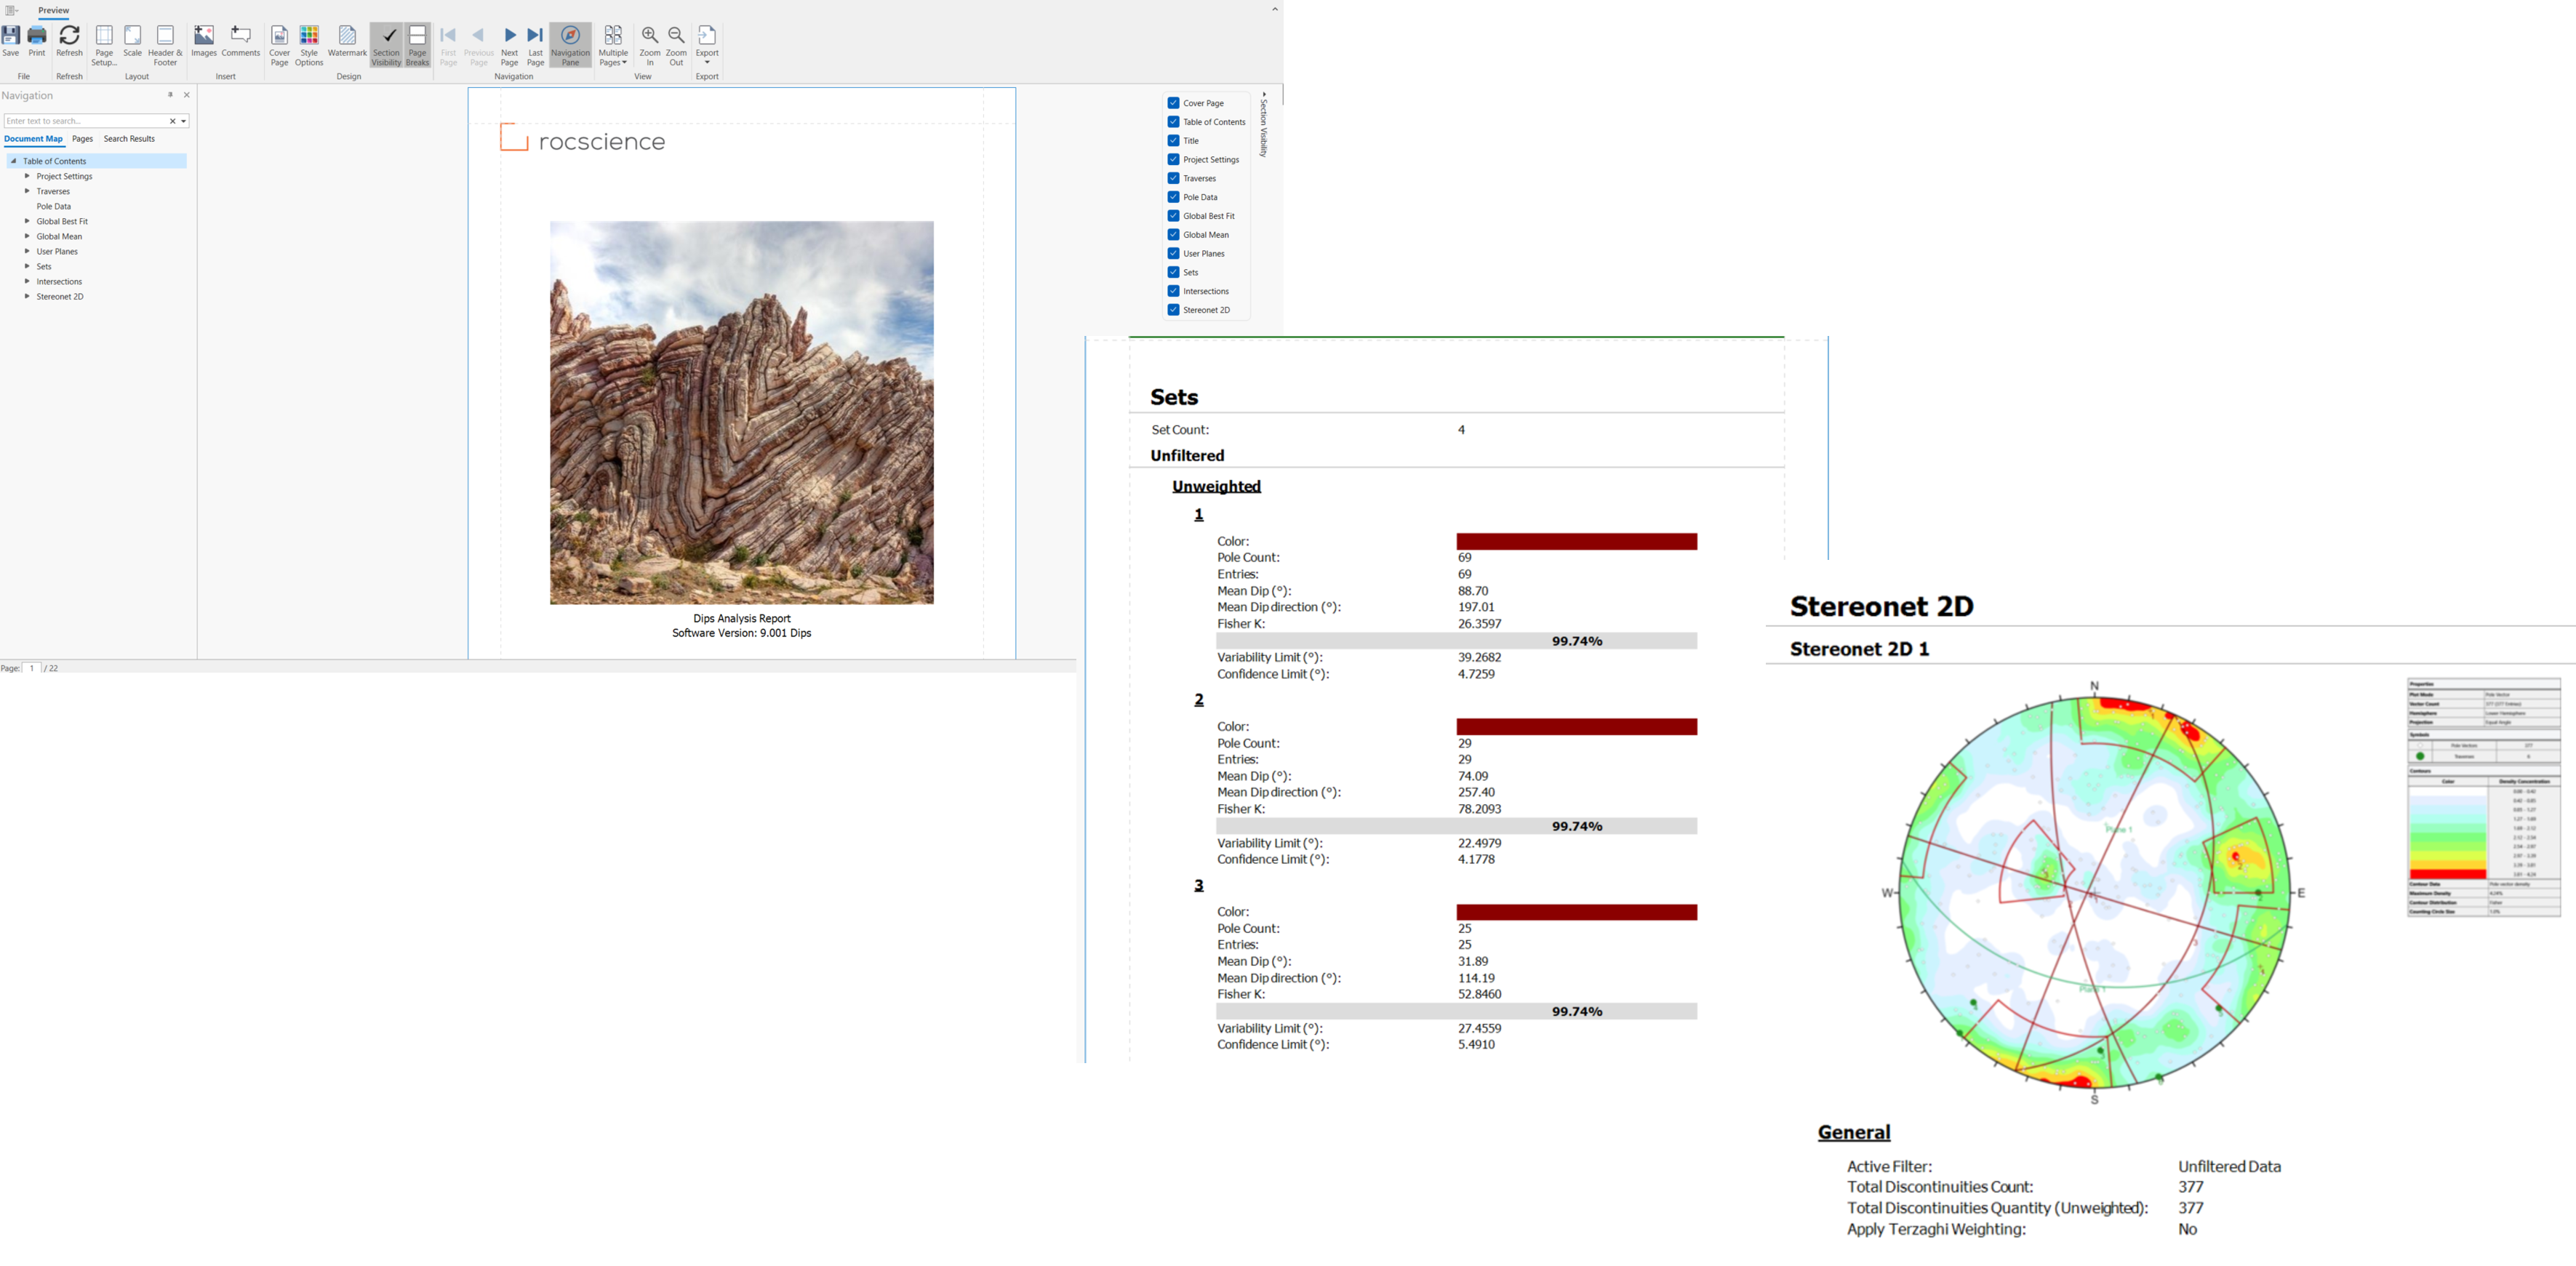
Automated Reporting: From Insight to Communication
Clear communication is as important as robust analysis. The Report Generator in DIPS streamlines this step by assembling key outputs into a comprehensive, professional quality document.
Statistics, plots, and chart views are compiled automatically into a structured report, reducing manual formatting and ensuring that decisions are backed by transparent, reproducible visuals and metrics. This makes it easier to move from internal interpretation to client ready deliverables with consistency across projects and teams.
A Modern Experience, Grounded in Familiar Practice
While DIPS ushers in a new performance and workflow paradigm, it remains firmly anchored in the analytical traditions that made Dips a reference standard. The evolution is intentional: existing users should feel at home while unlocking far greater capability.
A modern interface with a contextual ribbon surfaces only the tools relevant to the current task, keeping the workspace focused and efficient. Orientation measurements are grouped into datasets linked to specific traverses or data sources, each capable of storing quantitative attributes such as roughness and qualitative descriptors like weathering or infill, aligning with how engineers actually think about rock masses.
DIPS is also unit-aware. Mixed metric and imperial conventions can coexist within a single project, with all processed data converted and displayed according to the chosen reporting orientation and unit settings across stereonets and charts.
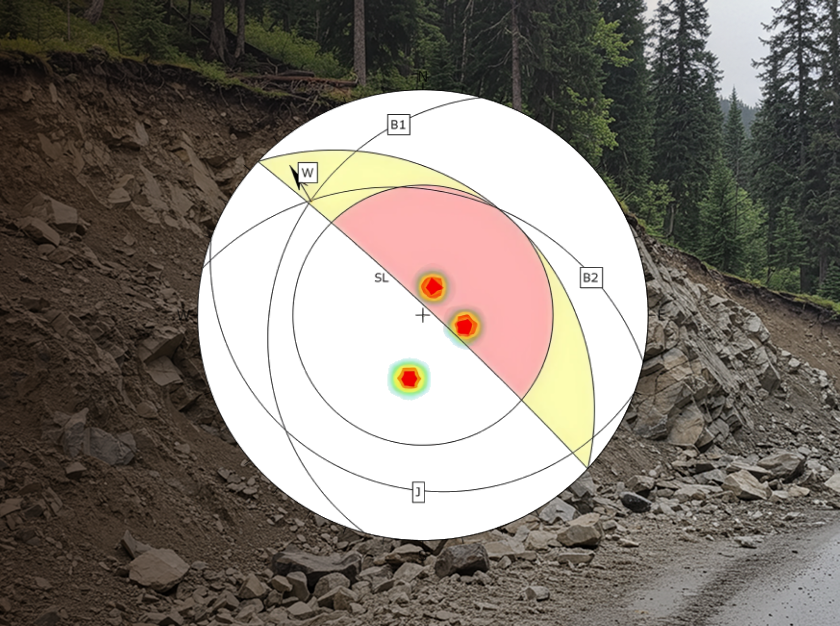
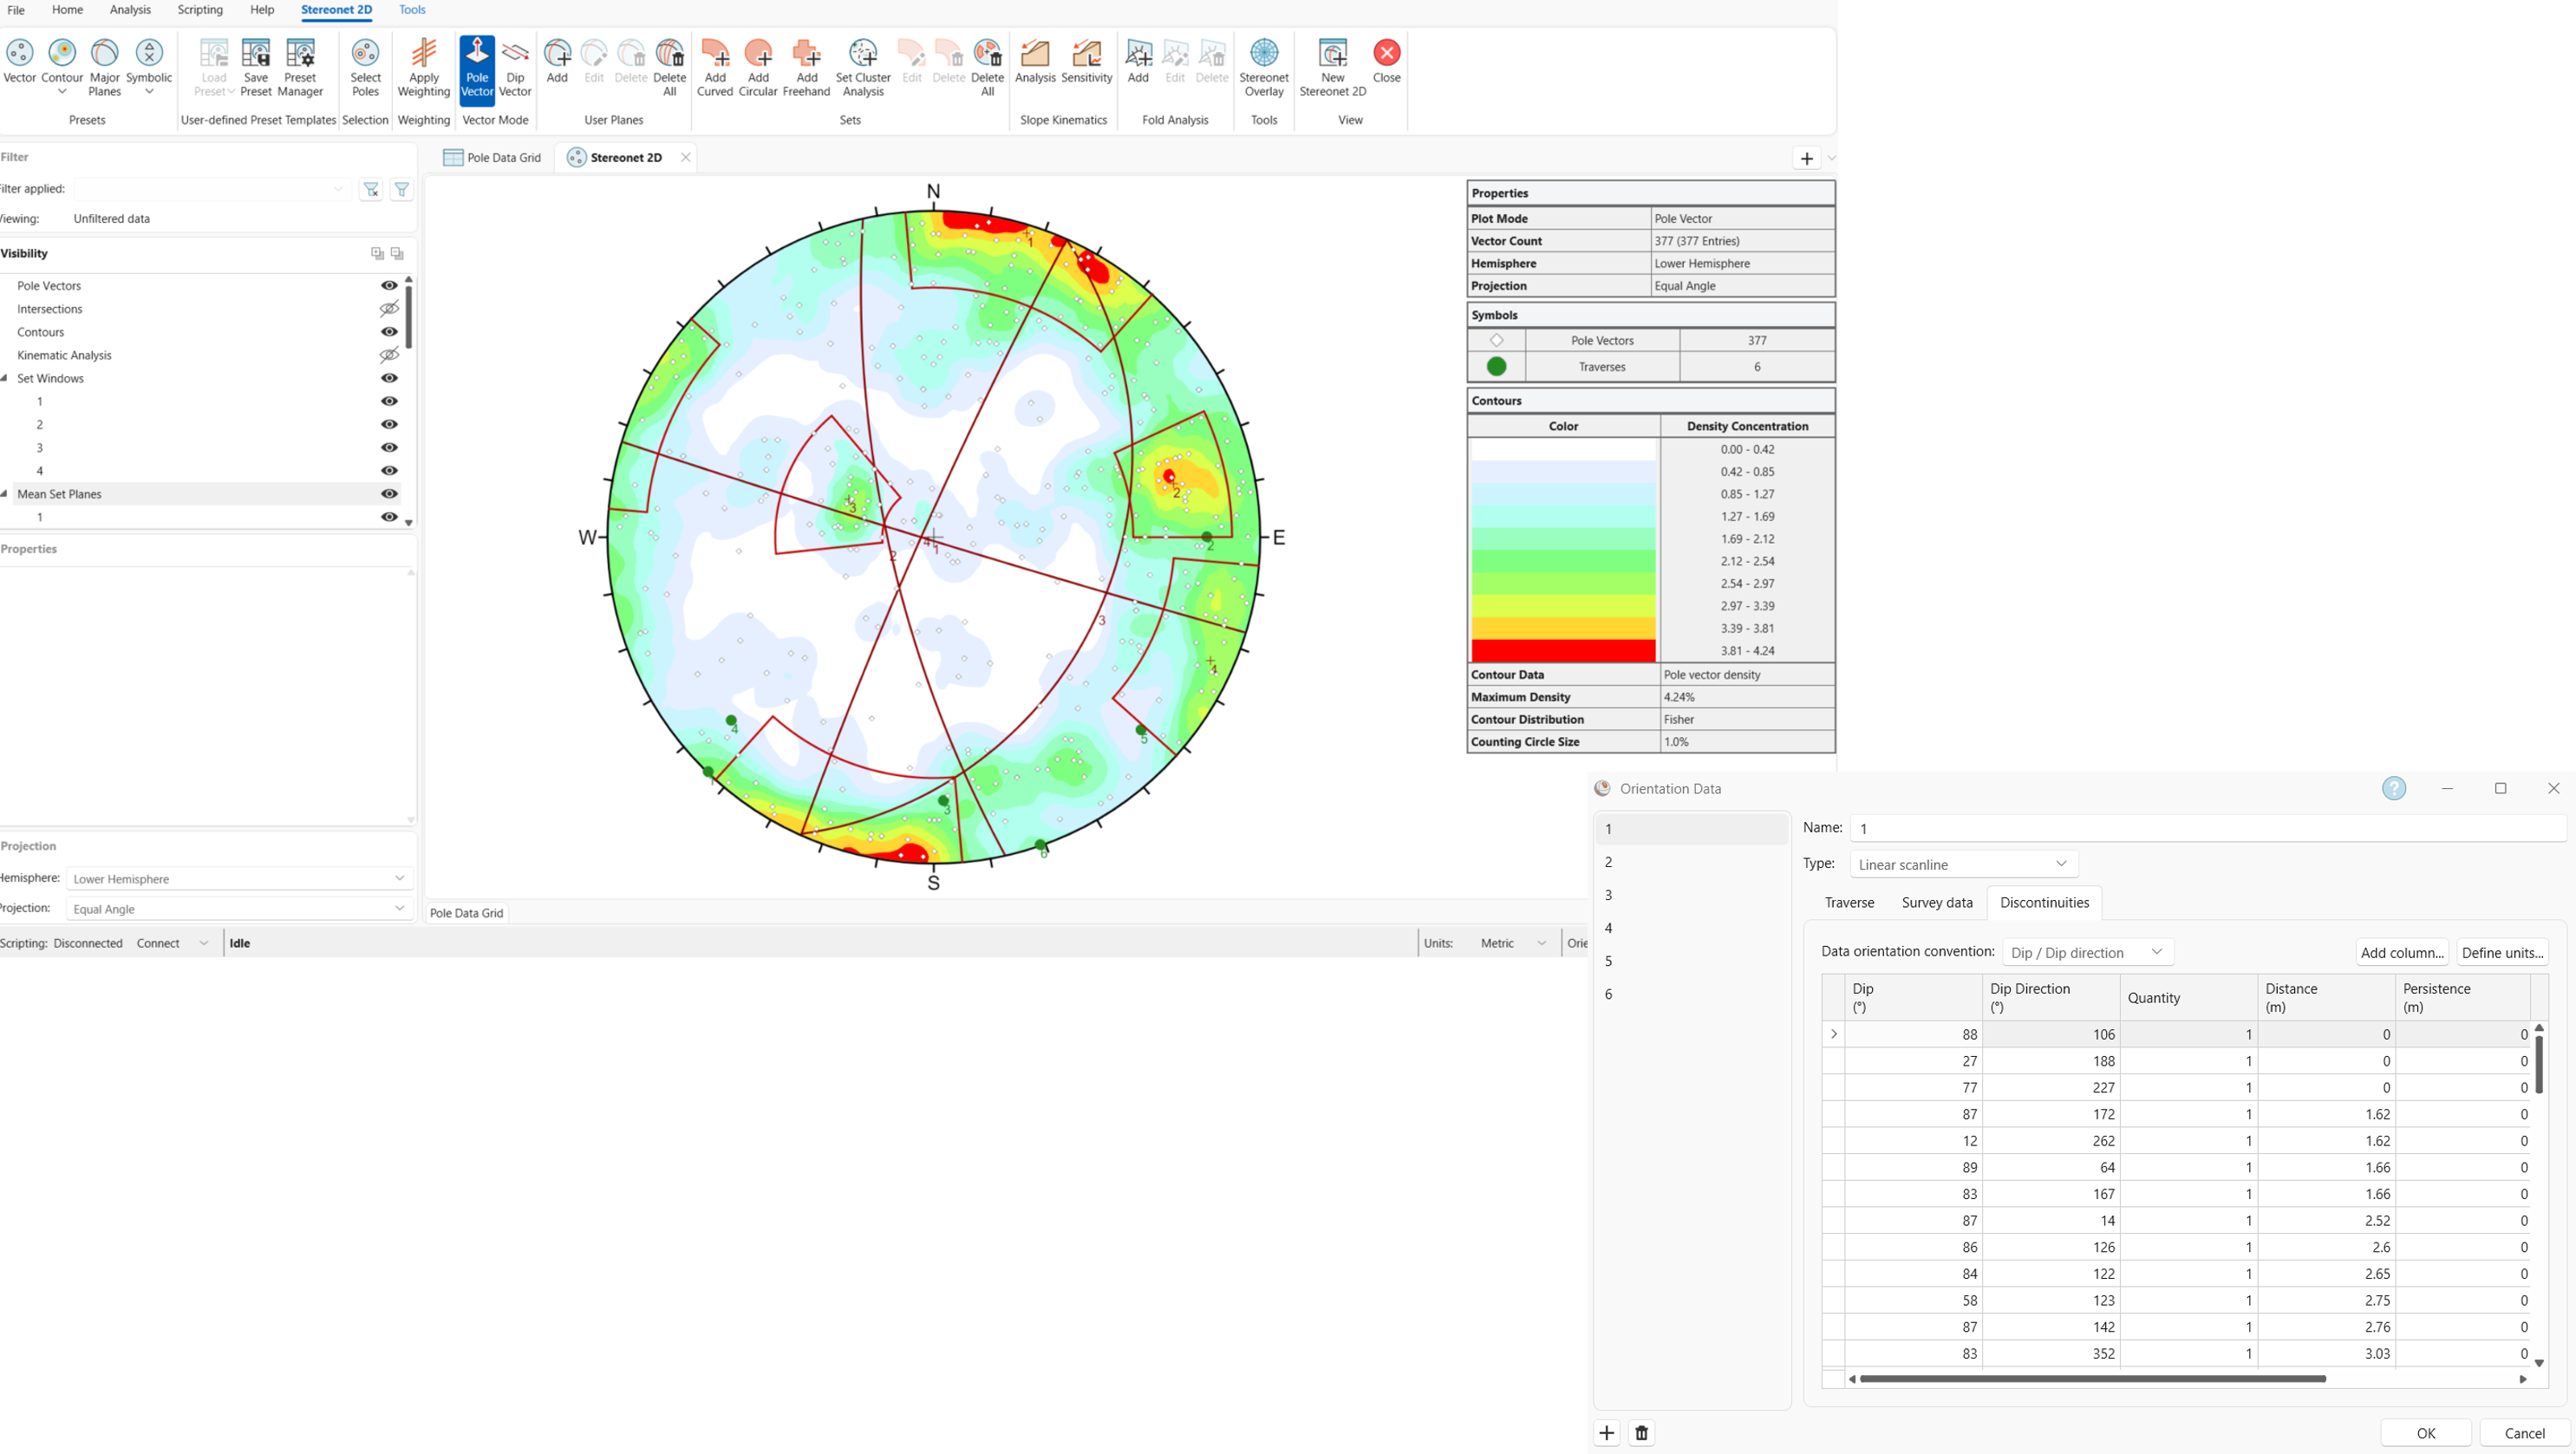
Precision Control for Complex Stereonets
As datasets grow, so does the complexity of stereonet visualization. DIPS introduces a Visibility tree and Properties pane that place all stereonet entities — poles, planes, sets, folds, intersections, contours, and annotations — under clear, centralized control.
Interactive two-way selection makes refining, editing, and simplifying plots fast and intuitive. Engineers can selectively emphasize structures of interest, manage dense plots without losing clarity, and maintain full transparency over how each visual element is constructed.
A Platform for Modern Data and High-Consequence Decisions
DIPS is not just the next version in a long lineage — it is an orientation analysis platform designed for the realities of modern rock engineering. Massive datasets, automation-driven workflows, and integrated ecosystems are now the norm, and DIPS is built to operate confidently in that world.
With DIPS, engineers can handle millions of poles, automate complex analyses with Python, bring RSLog and ShapeMetriX data directly into stereonet-based workflows, and generate client ready reports in minutes. By combining classical stereonet-based methods with bigdata performance and deep integration across the Rocscience suite, DIPS turns complex orientation data into clear, defensible insight for today’s — and tomorrow’s — rock engineering projects.
Experience DIPS in the Upcoming Webinar
Ready to harness big‑data performance, Python automation, and seamless integration across your workflow?
Register Now