2D Finite Element Analysis of a Reinforced Soil Embankment Constructed on a Cellular Foundation Mattress
By Ian Williams, Ph.D. & Dan Simpson
Introduction
This article presents a brief summary of a 2D finite element analysis carried out using RS2 to model a proposed reinforced soil embankment supported on a cellular foundation mattress. The analysis is based on a series of analyses carried out by Remedy Geotechnics Limited for a project involving the construction of a temporary haul road and piling platforms on formations of soft alluvial clay to facilitate the construction of a new viaduct for a major UK rail project.
RS2 Model
The 2D idealisation used for the RS2 embankment model is shown in Figure 1.
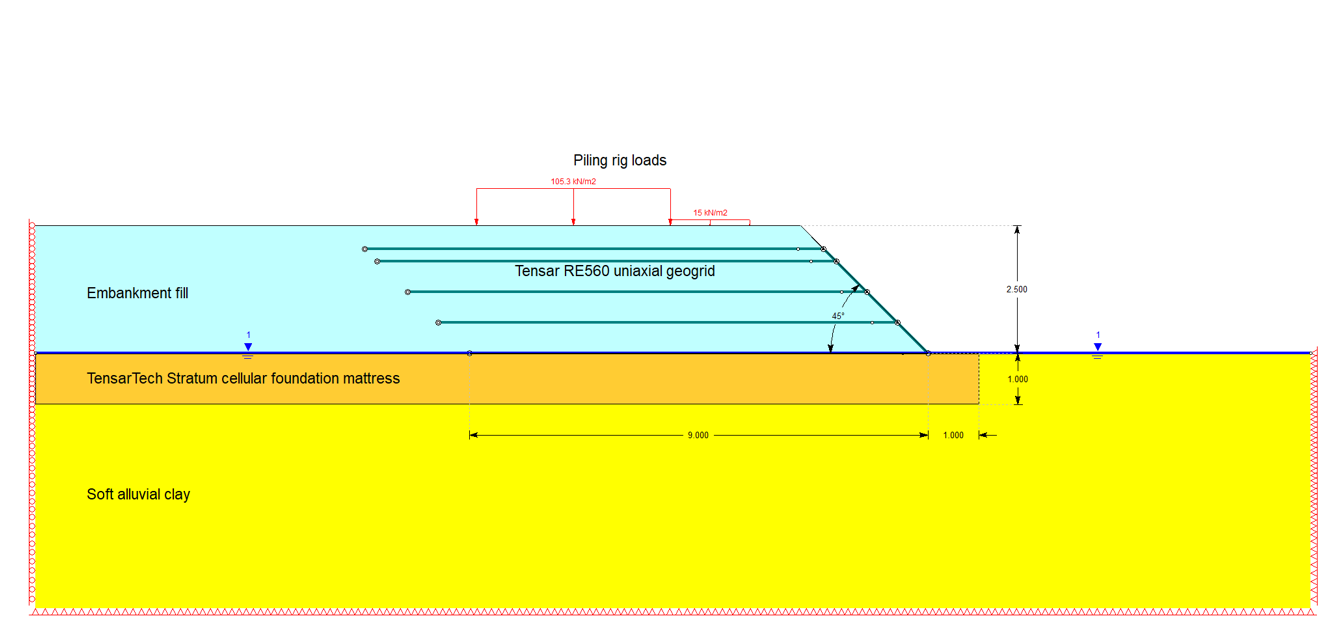
The in-situ soil formations comprise a 5 m depth of soft alluvial clay underlain by mudstone bedrock. To mitigate the risk of instability and control settlements, the embankment is supported on a TensarTech Stratum cellular foundation mattress system constructed to a depth of 1 m within the surficial horizons of the in-situ alluvial clay. The 2.5 m high embankment has a face angle of 45° and incorporates five horizontal layers of Tensar RE560 uniaxial soil reinforcement geogrids at a vertical spacing of 0.6 m. The groundwater regime is hydrostatic with the groundwater table coincident with the initial ground surface.
All soils were represented using elastic-perfectly plastic constitutive models with the Mohr-Coulomb yield criterion and non-associated plastic flow with zero dilation.
The elastic stiffness and Mohr-Coulomb shear strength parameters for the geocell mattress were calibrated against the results of more sophisticated 3D finite element models to derive equivalent parameter values for use in the 2D analyses.
The embankment geogrid reinforcement was represented in the RS2 model using elastic geogrid elements. A database of various geosynthetic products is built-in to RS2 and can be used to expedite the entry of the reinforcement properties (see screenshot presented in Figure 2).
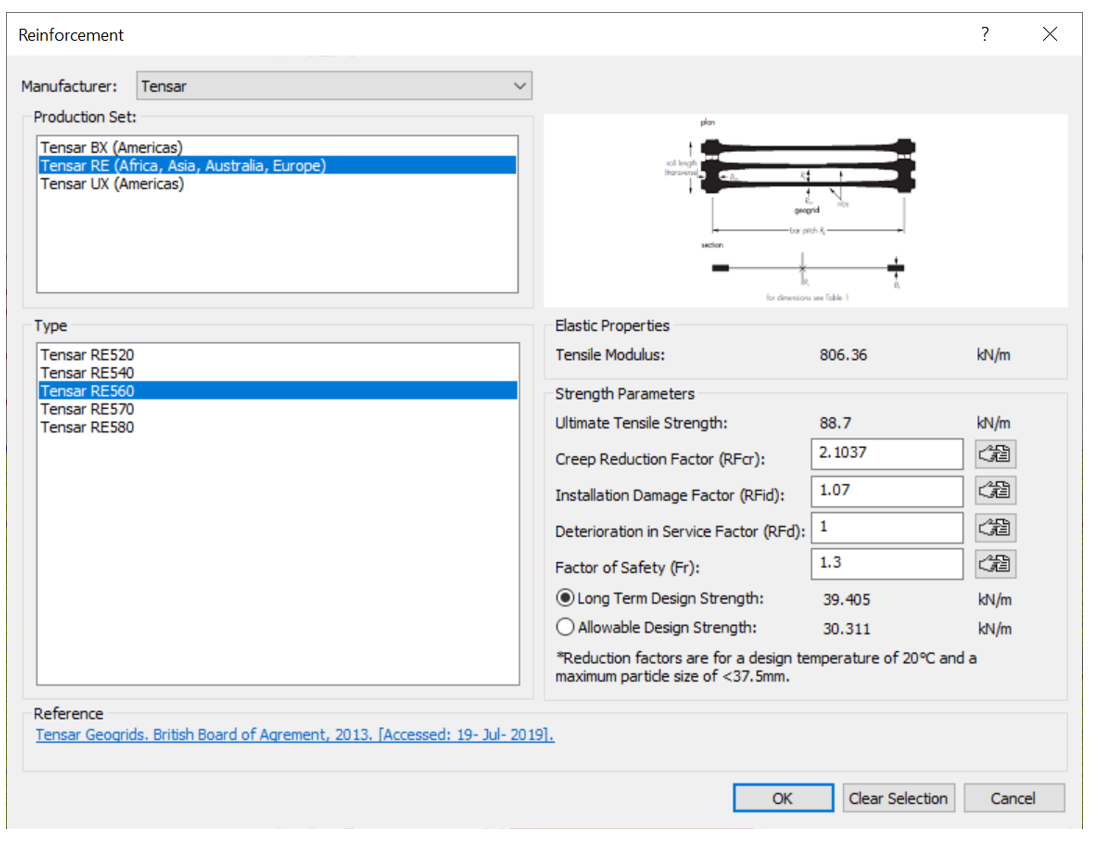
Piling rig loads were approximated by applying vertical pressures to the ground surface at the top of the embankment.
The analysis was carried out in a sequence of four stages as shown in Figure 3.
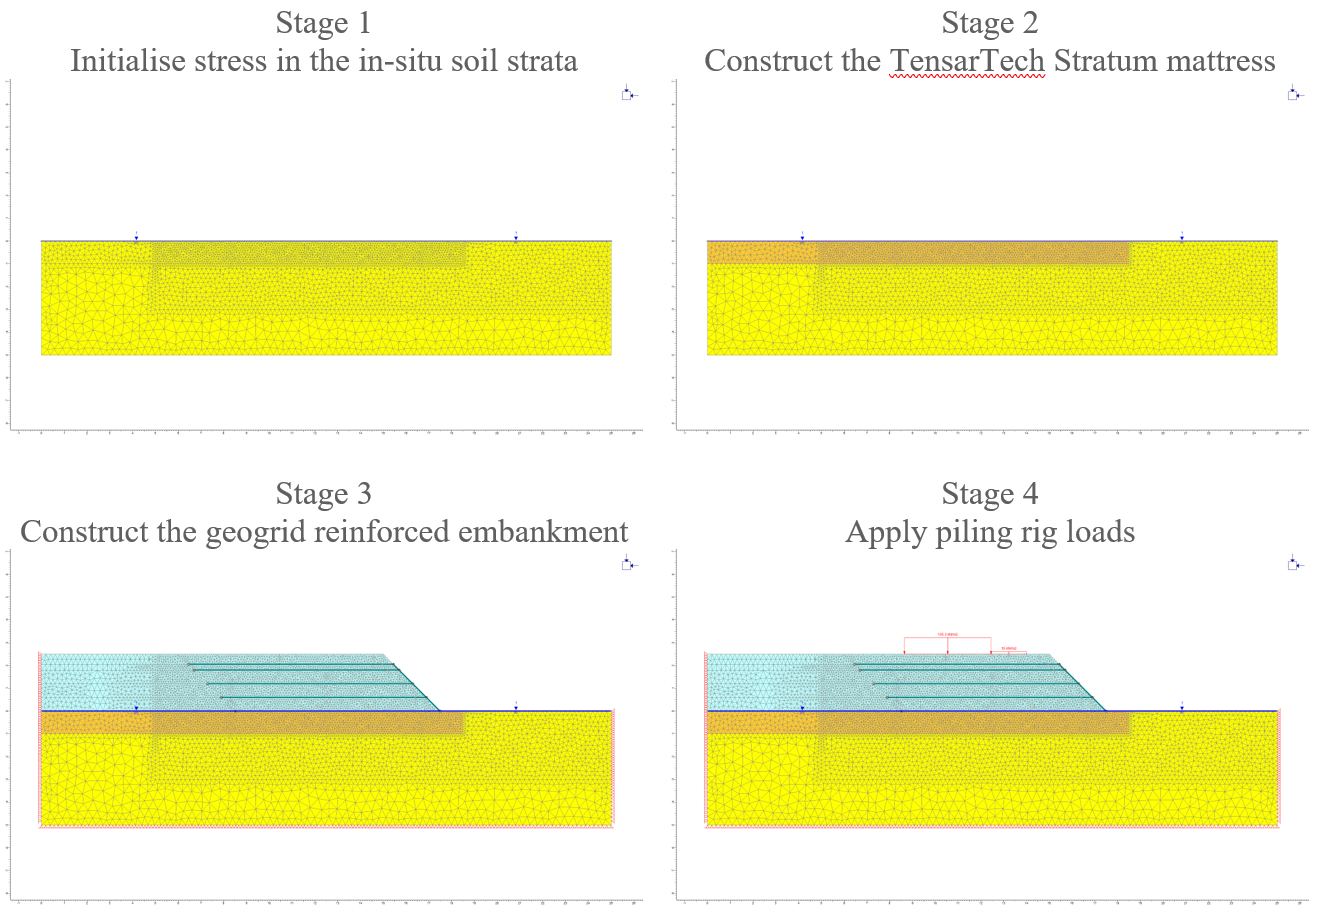
To examine likely modes of failure for the embankment without and with the imposed piling rig loads, shear strength reduction (SSR) analyses were performed at stages 3 and 4 respectively.
Analysis Results
A selection of results from the analysis are presented in Figures 4 to 8. For reasons of confidentiality, the values of some results are not given and attention is focused on modes of behaviour.
Figure 4 shows contours of soil strain in the horizontal direction together with plots of axial tensile load in the geogrids at modelling Stages 3 and 4. These visualisations show that the peak tensile loads in the geogrids coincide with regions of peak tensile strains in the soil.
Figure 4(a) shows that at Stage 3 the development of a slip surface at the embankment toe is being resisted by the mobilisation of axial tensile loads in the lower geogrids where they pass through regions of the embankment within which the horizontal soil strains are tensile. The axial tensile loads in the geogrids reduce to zero in regions where the horizontal soil strain remains compressive. Tensile horizontal soil strains are also developing upwards from the base of the geocell mattress where it is ‘sagging’ under the surcharge of the embankment fill.
Figure 4(b) shows a different pattern of horizontal soil strain and axial tensile loads in the geogrids when the piling rig loads are imposed. Now the dominant tensile strains in the soil and tensile axial loads in the geogrids occur beneath the imposed piling rig loads. These dominant tensile soil strains coincide with zones of high shear strain and are consistent with the onset of punching shear through the embankment/geocell mattress and ultimate bearing failure of the underlying formation soils.
The maximum axial tensile loads in the geogrids did not exceed the tensile capacity at any stage.
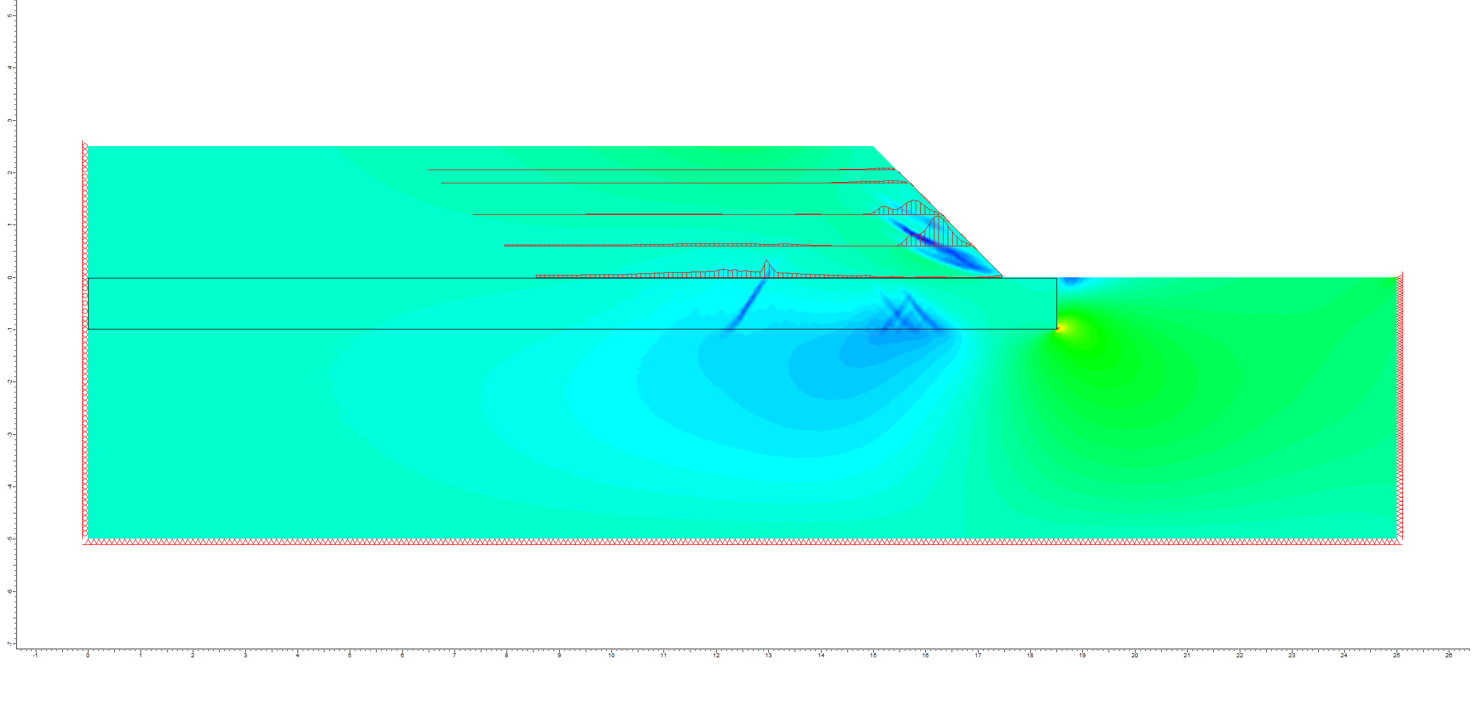
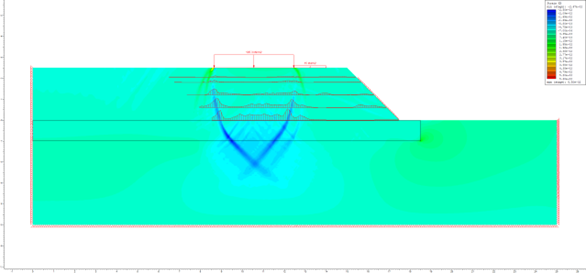
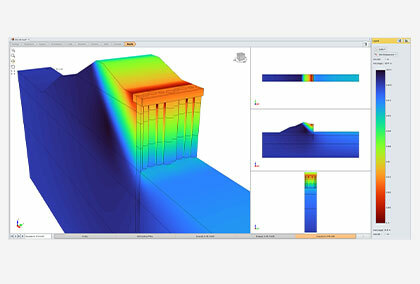
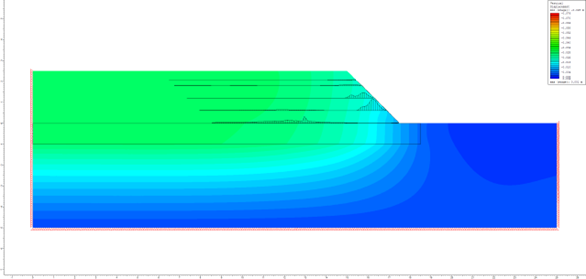
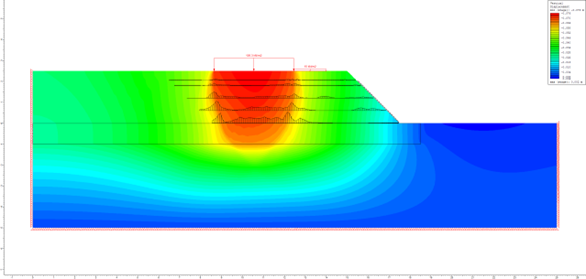
Figure 5 shows contours of vertical displacements together with plots of axial tensile load in the geogrids at modelling Stages 3 and 4. For this particular model, the maximum settlement due to embankment loading is around 28 mm and the additional settlement induced when the piling rig loads are imposed is around 48 mm.
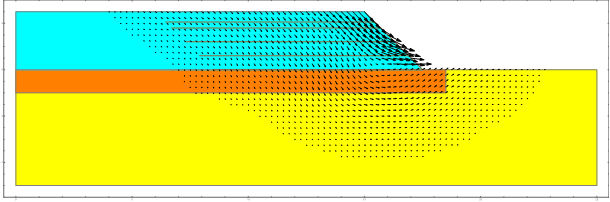
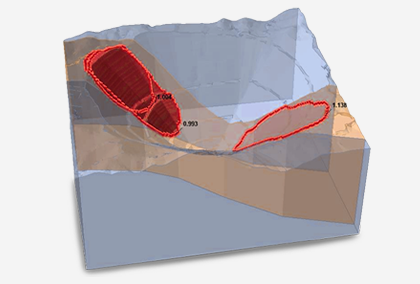
Visualisations of the failure modes based on the SSR analyses are presented in Figures 6 to 7.
These visualisations suggest that at Stage 3 the predicted failure mechanism comprises a slope failure with the slip surface passing through the embankment toe. Localised face bulging between the horizontal geogrids is also predicted.
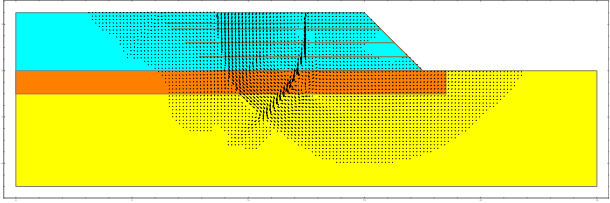
At Stage 4, when the piling rig loads are imposed, a punching mechanism through the embankment and geocell mattress together with a bearing capacity failure in the underlying subgrade is predicted. Due to the proximity of the rig loads to the embankment crest, the failure mechanism is asymmetric with an anticlockwise rotational movement. The primary mode of failure, however, is a bearing capacity failure due to punch through.