The Slide2 Playbook: 7 Tips for Better Slope Stability Analysis
From model cleanup to advanced data queries, Slide2 offers a wide range of features that can improve your slope stability analyses — if you know how to use them effectively.
Whether you're new to the software or a seasoned user looking to streamline your workflow, these practical tips from Dr. Sina Javankhoshdel (Rocscience Senior Manager - LEM) will help you get more value out of every model you build.
1. Clean Up Messy Geometry Before You Compute
Complex geometry with too many vertices can slow down your model and introduce unnecessary complications. Use the Geometry Cleanup or Simplify Boundary tools to remove excess vertices and ensure your geometry is clean and optimized before computation. This small step can have a significant impact on performance and usability.
These tools automatically detect redundant or closely spaced points, which can lead to mesh generation issues or unexpected errors during analysis.

2. Know When to Use Sensitivity or Probabilistic Analysis
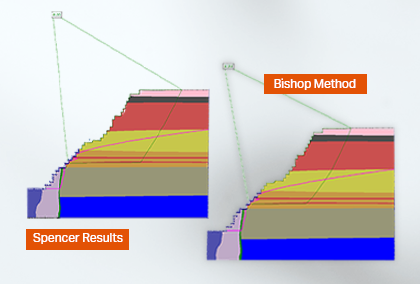
When you're trying to understand how one input affects the Factor of Safety (FS), Slide2's sensitivity analysis is the right tool. Test parameters such as material properties, water table elevation, tension crack depth, or support conditions independently to identify which ones have the biggest influence on your results. Each parameter is varied within a defined range, and the output chart provides a clear visual of FS trends and critical thresholds.
For a broader view of model behavior and to assess overall uncertainty, switch to probabilistic analysis using a Uniform distribution. This allows you to investigate the combined influence of multiple parameters on FS and quantify the range of possible outcomes. It’s especially useful when working with variable site conditions or limited input data. You can define distributions for material strength, pore pressure conditions, and support capacities to simulate realistic variability in geotechnical parameters.
3. Add Hydraulics Queries Before Running Hydraulic Statistics Analysis
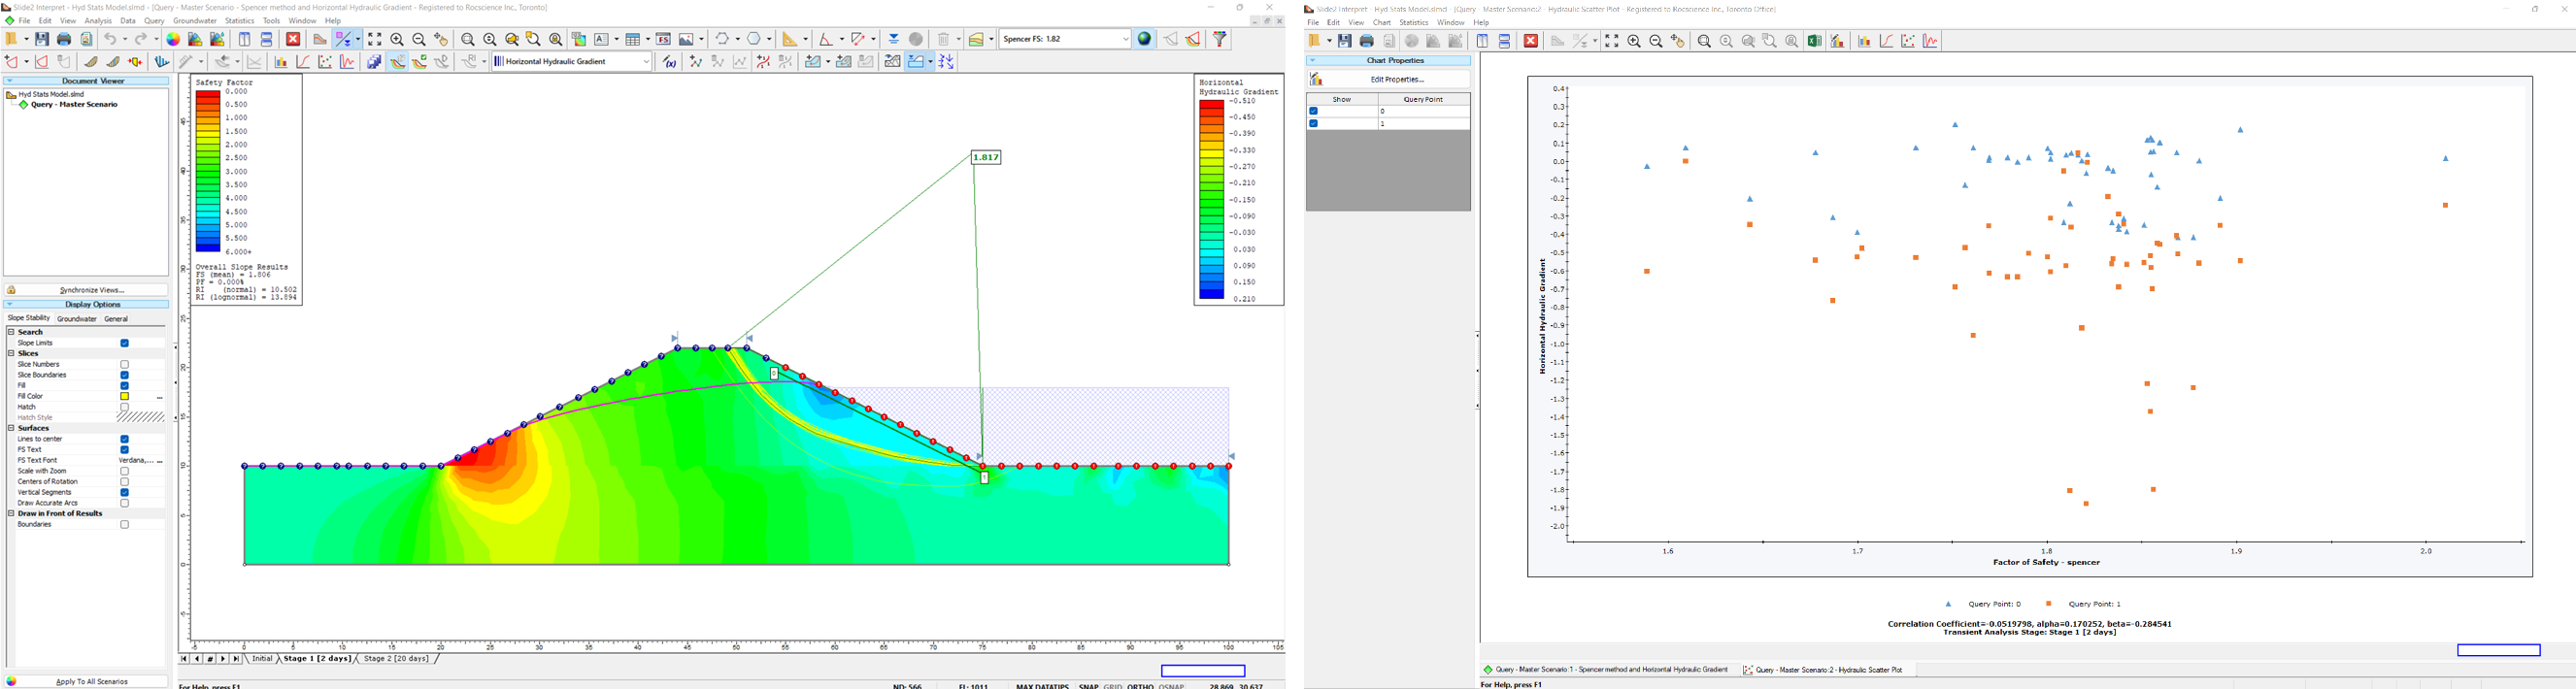
To capture detailed hydraulic data at specific points, use the Add Query for Hydraulic Stats option before computation. This ensures that data — such as hydraulic gradient, velocity, and other output parameters — is stored for those locations during the analysis. Then, you can visualize this data using scatter plots, making it easier to interpret trends in seepage behavior and assess hydraulic risks.
4. Use Material Queries to Inspect Results After Seepage Analysis
Once your seepage analysis is complete, you can define Material Queries to extract seepage outputs like pore pressure, total head, hydraulic gradients and other parameters across specific materials or zones of interest. This makes it easier to interpret results and refine your model. The output includes time-variant and spatial statistics, which can help identify areas with elevated pore pressure or steep hydraulic gradients.
5. Plot Data Along Slip Surfaces for Deeper Insight
If you want to graph values such as pore pressure or strength parameters along a slip surface, go to Project Settings and select either Standard Data or Maximum Data Output (this option enables the ability to store data for all slip surface and plot them at the end of compute instead of just storing data for the most critical slip surface). Then create queries along the slip surface and use the plotting tools to visualize how values vary spatially — great for both QA and reporting.
This approach allows you to identify weak zones, peak pore pressure zones, or abrupt material transitions along the failure plane.
6. Use the Property Viewer to Verify Inputs and Results
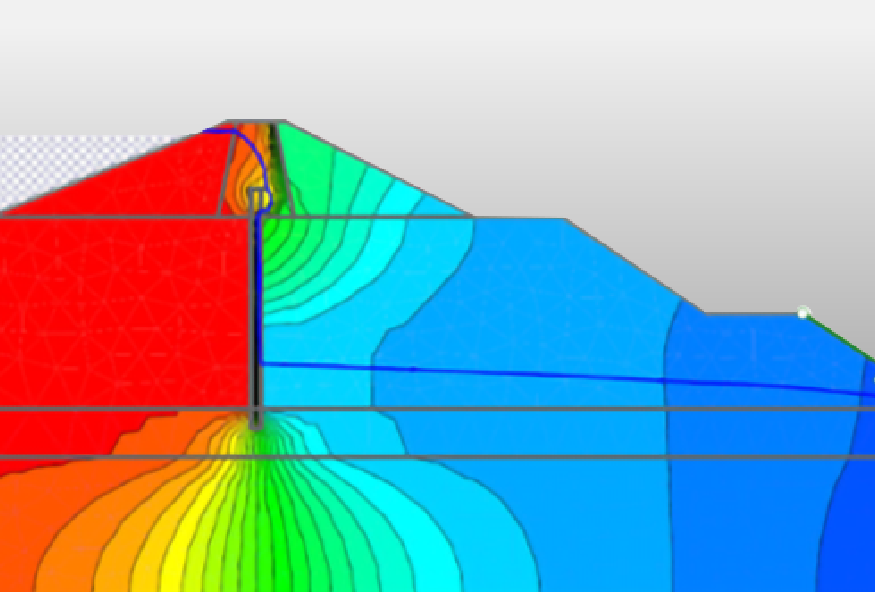
The Property Viewer allows you to inspect spatially variable input data, such as linearly increasing undrained cohesion, spatially variable parameters in spatial statistics and porewater pressure. It’s a powerful way to confirm that your model is behaving as expected before and after computation. You can also scroll through layers and regions to verify consistency in defined properties and detect any modelling anomalies.
7. Target Critical Slip Surfaces for Deeper Investigation
If you identify a slip surface of interest during analysis, right-click it and choose Copy (Slide2 Modeller format) or copy the coordinates directly. In the Modeller, use Add Surface → Paste from Modeller, then change the surface type to User Defined. This allows you to run targeted evaluations on any critical or custom slip surface.
This workflow is especially useful for back-analysis, scenario testing, or comparing different surface geometries under the same loading conditions.
Take Your Slide2 Skills Further
Slide2 brings together powerful 2D limit equilibrium tools with detailed FEA seepage analysis, probabilistic methods, and customizable geometry—making it one of the most versatile platforms for slope stability analysis. These expert-backed tips from Dr. Javankhoshdel are designed to help you improve efficiency, interpret results more clearly, and build models you can trust.