Cracking the Cluster: Understanding Combined Block Failure in 3D with RocSlope3 and RocTunnel3
- Dr Grace Huang, Geotechnical Product Manager
What happens when the ground itself becomes a puzzle? Every joint, every fracture, every unseen boundary in the rock hints at movement waiting to unfold. In a slope or a tunnel, those fractures interact; one block influences another. This creates a complex, three-dimensional pattern of potential instability that challenges even the most advanced analysis.
For decades, engineers have modelled these conditions to understand where failure might initiate and how the geometry of rock masses governs stability. Yet, while traditional tools could assess individual blocks, they often stopped short of capturing how multiple connected blocks might move together as a single removable cluster.
Rocscience advances this understanding with Combined Block Analysis in RocSlope3 and RocTunnel3 — an evolution of 3D limit equilibrium modelling that allows engineers to identify the largest removable block cluster formed by intersecting joints. By combining mapped or synthetic discontinuities with realistic geometries, these programs help practitioners quantify potential failure volumes and refine stabilization design with greater precision and confidence.
Combined Block Analysis in RocSlope3 and RocTunnel3
RocSlope3 and RocTunnel3 stand as the twin powerhouses of 3D limit equilibrium-based block analysis; purpose-built to capture the subtleties of jointed rock behaviour. Both programs employ Rocscience’s advanced 3D limit equilibrium approach to determine the stability of blocks formed by intersecting joints within a given geometry, whether based on as-built conditions or design models.
By incorporating mapped or synthetic discontinuities, engineers can simulate how blocks form, release, or remain stable under gravitational and structural forces. Features such as key block identification and successive failure analysis have long set Rocscience apart. In RocTunnel3, staged excavation and support modelling extend this capability — showing how potential failures evolve through each phase of real excavation.
Now, with the introduction of Combined Block Analysis, both programs are set to transcend traditional single-block modelling. This capability identifies the largest removable block — a cluster of two or more connected unit blocks — for any sliding direction, allowing engineers to assess how neighbouring blocks contribute to overall instability.
A Structured Workflow for Combined Block Analysis
Combined Block Analysis follows a clear in-product workflow that guides users from block generation to evaluating which connected blocks can form the largest removable cluster:
- Compute joint traces on the excavation surface to identify potential daylighting regions where block formation is likely.
- Compute joint intersections to define all potential blocks that can form in the rock mass.
- Compute kinematics to evaluate safety factors for unit blocks, identify key blocks, and assess successive failures. At this stage, potential block clusters containing removable key blocks can also be identified.
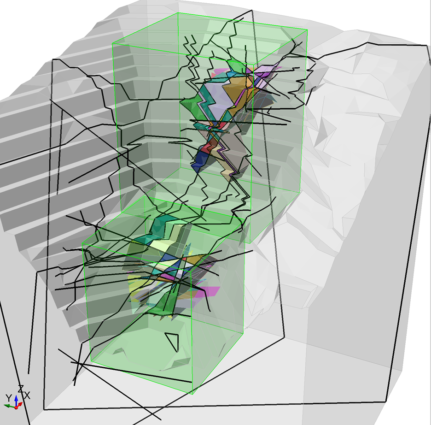
- Place Search Limit Boxes around clusters of interest and potential daylighting zones as indicated by joint traces. These search zones allow engineers to strategically direct analysis, optimizing runtime while maintaining fidelity.
- Re-compute with Combined Block Analysis
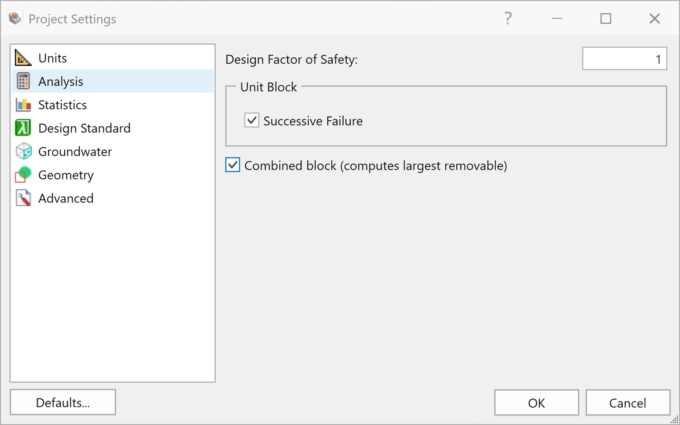
Activating Combined Block Analysis
Once areas of concern are defined, users can easily enable Combined Block Analysis in Project Settings and re-run computations. The engine will still map every unit block, but it now goes further — isolating, for each sliding direction, the largest removable block formed by multiple connected units.
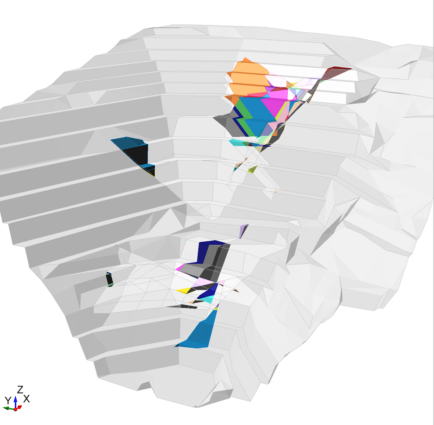
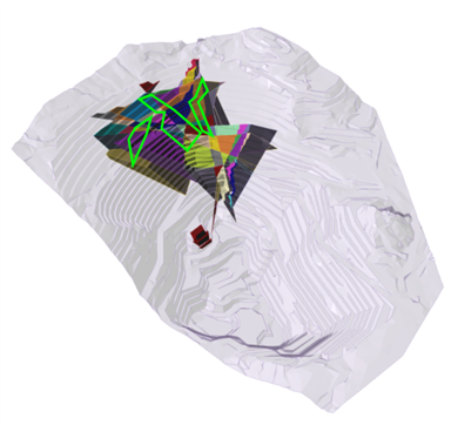
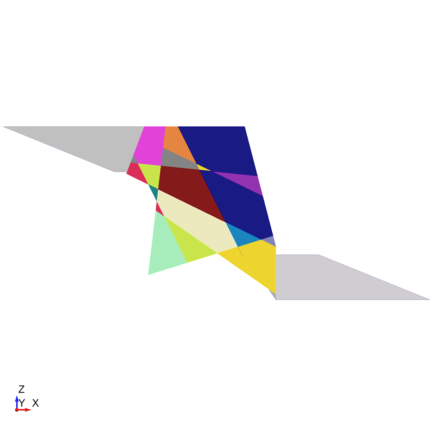
Interpreting Results
Upon computation, users can examine unit and combined blocks within a unified Results Set. This view reveals how small-scale failures relate to broader cluster mechanisms, enabling engineers to interpret stability across multiple scales. Separate Results Sets — Removable Unit Blocks and Failed Combined Blocks — allow detailed inspection of individual components or full systems.
This comprehensive visualization puts structural relationships into perspective, enabling faster diagnosis, more informed stabilization choices, and reduced uncertainty in design.
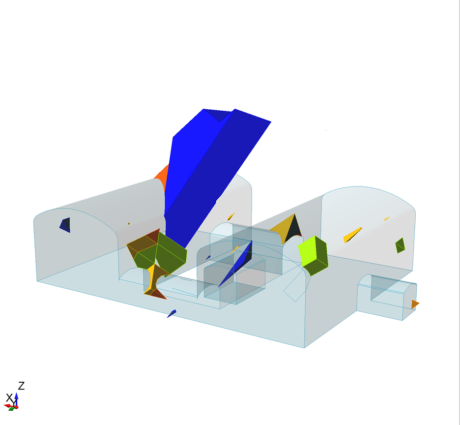
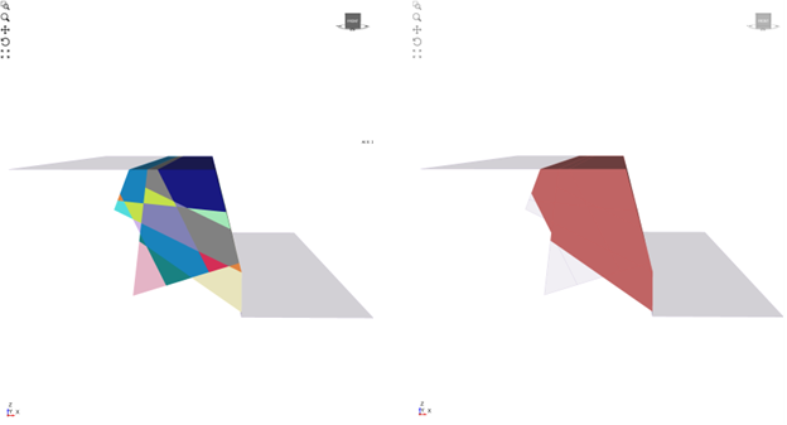
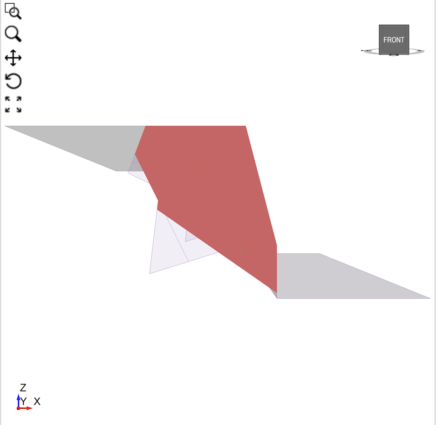
Understanding the Largest Removable Block
At the heart of Combined Block Analysis lies the identification of the largest removable block cluster — formed by the interaction of two or more unit blocks — for each sliding direction. This defines the upper bound of potential failure volume, but it is not always the most critical case. In many designs, the block driving instability may be smaller yet governed by lower safety factors or higher support demands. That’s where Combined Block Search Filters become indispensable.
Refining the Search: Advanced Combined Block Filters
For more nuanced insight, Combined Block Search Filters allow users to refine searches by criteria such as maximum failure depth. By default, the analysis identifies the largest removable block in each sliding direction — an essential indicator of potential failure volume. However, the largest removable block may not correspond to the lowest safety factor or highest required support pressure. These subsets can be isolated using targeted criteria like failure depth, enabling practical design of stabilization measures.
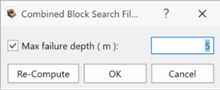
Applying such filters allows engineers to identify blocks most critical to stability and to tailor their design responses accordingly.
Conclusion
Combined Block Analysis represents a practical evolution in 3D stability modelling. With its introduction in RocSlope3 and RocTunnel3, engineers can now identify and evaluate the largest removable block formed by multiple interconnected unit blocks — providing a more complete picture of potential instability within jointed rock masses. By expanding traditional block analysis to account for cluster behaviour, this capability supports more conservative volume assessments, refined stabilization strategies, and stronger confidence in 3D design outcomes.
Combined Block Analysis debuts in RocSlope3 in February 2026, continuing Rocscience’s commitment to advancing 3D limit equilibrium methods; helping engineers see not just blocks, but the systems they form.
Ready to uncover the next dimension in stability design?
Begin your journey today with a trial of RocSlope3 or RocTunnel3 on RocPortal.
Start Your Free Trial