SPT Data on the Log
This page describes all you need to know for SPT data entry and its presentation on the log.
Data Entry
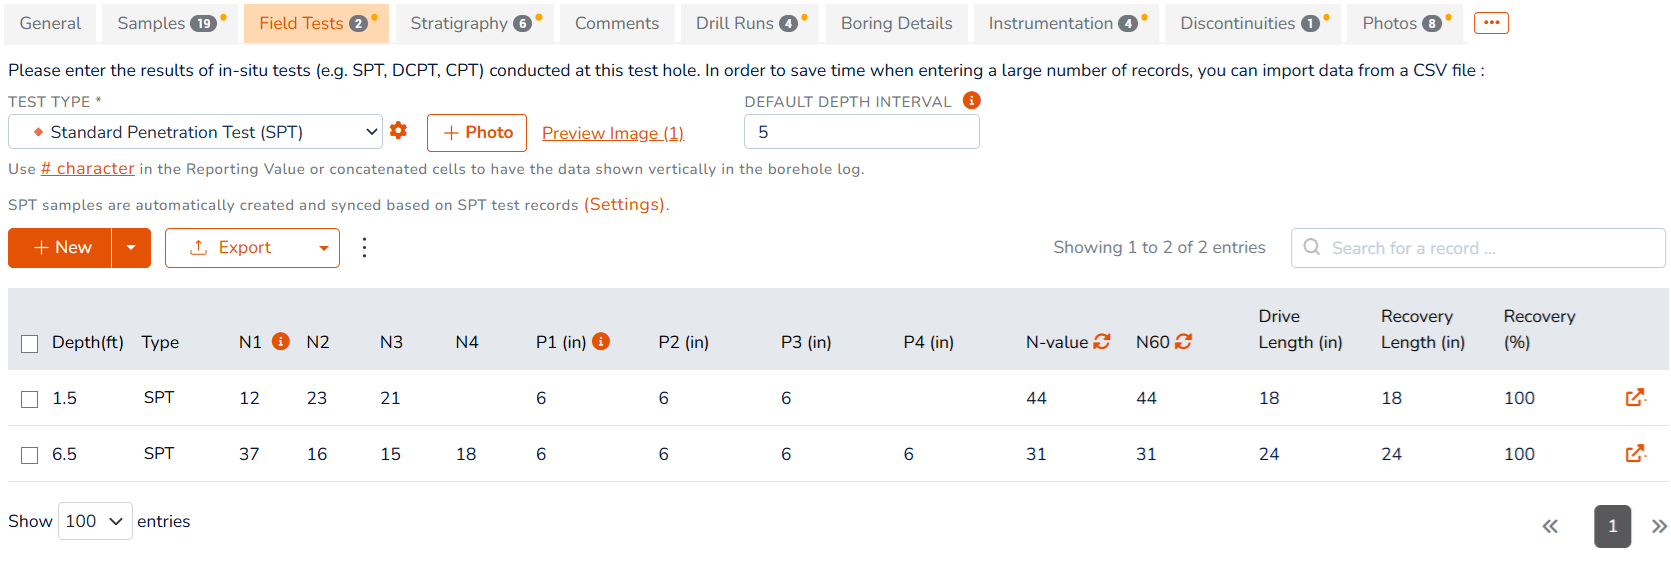
RSLog covers SPT data entry and calculation of N-Value based on ASTM D1586. To enter SPT blow counts, go to Test Holes page and edit the desired test hole. Then navigate to the Field Tests page and select Standard Penetration Test (SPT) from the list. Start entering the number of blows (N1 to N4) and then enter the penetrations (P1 to P4). RSLog automatically calculates the following:
- Type: indicates the type of test: SPT or Modified California
- N-Value: for a full test (i.e. no refusal) the N-Value is calculated from N2+N3. If a refusal was encountered, the N-Value will be presented based on your preferences on the Settings → Engine → SPT Rules tab,
- N60: if the test is not a refusal, the N60 will be calculated from N-Value x (Er÷60) where Er is the hammer energy efficiency level entered on the General tab of borehole data entry page,
- Drive Length: is calculated from P1+P2+P3+P4,
- Recovery (%): is calculated from Recovery Length ÷ Drive Length.
Blow counts may be entered on screen in the Field Tests table, or you can import your data from a CSV file.
SPT Blows in a Column
Showing SPT blow counts in number format on the log can be done in horizontal or vertical format. Customizations related to this feature are handled on Settings page → Engine tab → SPT Rules tab. The following table summarizes various options for displaying SPT blow counts in numerical format in the log:
| Appearance on the Log | Log Template Design | Data Entry Method |
|---|---|---|
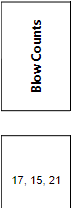 | Add a Text/Number → Field Test Results log column and link it to the Reporting Value of your SPT test. | Use Reporting Value column as shown below. This column allows alphanumeric values (e.g. use of comma etc.) 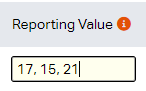 |
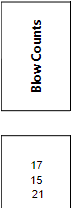
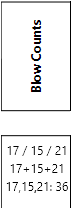 | Add a Text/Number → Field Test Results log column and link it to a Concatenated Column that is formatted based on your SPT data. The concatenation format may include field test columns combined with additional characters. See 3 examples on the left. | On Settings page create a 'Concatenated Column' for your SPT test. This column will be automatically formatted based on other SPT columns. 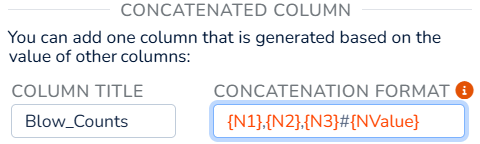 |
 | Add a Text/Number → Field Test Results log column and link it to the N-Value of your SPT test. | Use Reporting Value column as shown below. Use the Split Character between the numbers to force the data to show in multiple rows in the log. 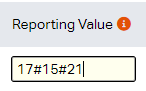 |
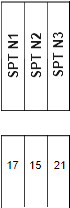 | Add 3 separate Text/Number → Field Test Results log columns and link each one to the corresponding column of your SPT test. | Enter data in separate columns. You can customize the columns of your field tests to accept data in multiple columns. 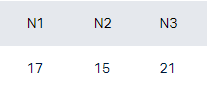 |
SPT Blows on a Graph
SPT blow counts may be shown in the borehole log in different ways depending on the details. The following table summarizes these options:
| Appearance on the Log | Log Template Design | Data Entry Method |
A graph showing SPT blow counts only 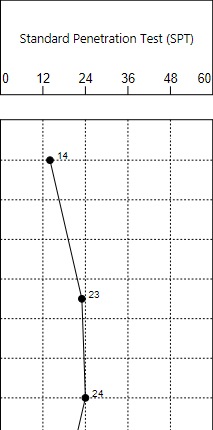 | Add a Graphic → Field Test Results log column and link it to the desired data column (e.g. N60) in your SPT field test. | Enter blow count details in separate columns. You can customize the columns of your field tests to accept data in multiple columns.  |
A graph showing SPT blow counts along with other field / lab tests 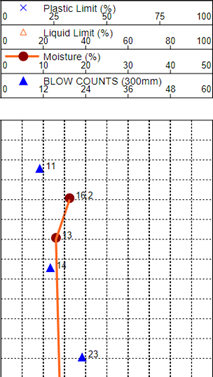 | Add a Graphic → Graph (customizable) log column and add different data series linked to the desired data sources (e.g. various field / lab tests). | Enter blow count details in separate columns. You can customize the columns of your field tests to accept data in multiple columns. |