A Trip Down Memory Lane - Rock Engineering Before Computers By Dr. Evert Hoek
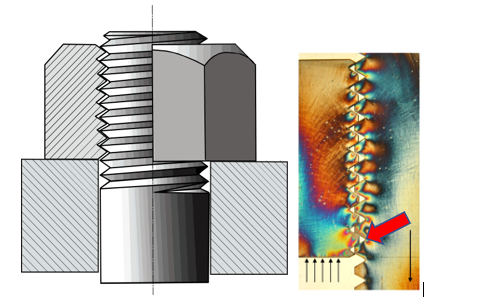
I graduated with a degree in mechanical engineering from the University of Cape Town in 1955. I continued on to a Master of Science degree, with research into the stress distribution in threaded connections (bolts and nuts) using three-dimensional photoelastic techniques, completing this degree in 1957. In those days, long before computers and numerical analyses were available, all investigations into the stresses in mechanical components were done on physical models. Stresses were measured by means of strain gauges, bonded onto the models at appropriate locations, or using two- and three-dimensional photoelastic models.
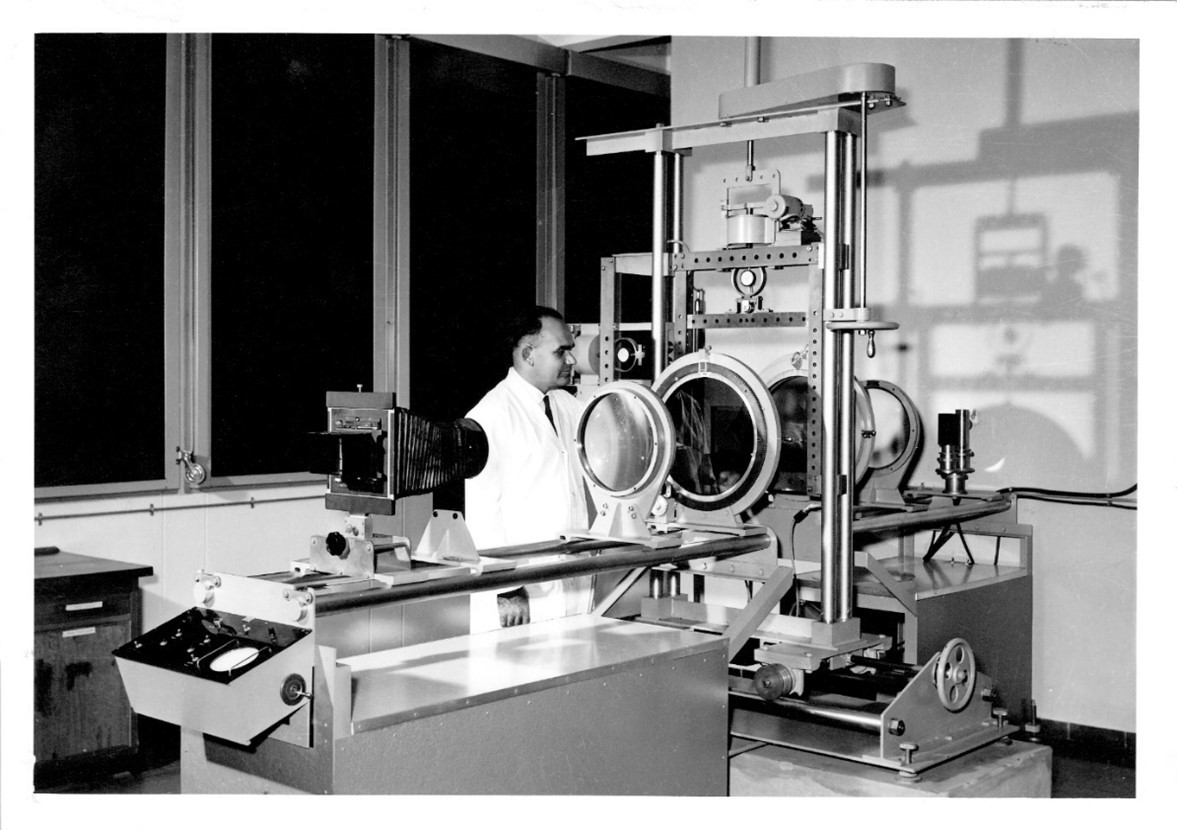
In 1958 I applied for a position with the National Mechanical Engineering Research Institute of the South African Council for Scientific and Industrial Research (CSIR), located in the city of Pretoria. It turned out that I was lucky since a giant photoelastic polariscope, shown in Figure 3, had been constructed in this Institute. The designer and operator of this instrument had resigned shortly before my application was received. Since none of the remaining staff knew how to operate this machine, or very much about photoelastic analysis, I was appointed as a research engineer, responsible for stress analysis and strength of materials projects.
In addition to its work on mechanical engineering components, the CSIR also had a small rock mechanics department in which work on the measurement of in situ stresses in deep level gold mines was being carried out. I worked with this department on brittle fracture problems in the rock in these mines [1]. At mining depths of up to 3 km below surface, the high stress levels cause extensive fracturing in the rock and, in some cases, these fractures took the form of very violent and dangerous rock bursts. I became a member of a team of researchers, from various universities and research organizations, who were attempting to understand and to devise methods for minimizing the danger of rockbursts [2].
The Coalbrook mining disaster was the worst mining disaster in the history of South Africa. The disaster occurred in the Coalbrook coal mine of Clydesdale Colliery on 21 January 1960, when approximately 900 pillars caved in, almost 180 metres underground. About 1,000 miners were in the mine at the time and 437 died after being trapped, while the rest escaped through an incline shaft. The miners were suffocated by methane gas and crushed to death by rockfall.
Following the disaster, the South African government established Coal Mines Research Controlling Council to improve coal mine safety and research pillar strength, supported by the Council for Scientific and Industrial Research and the Chamber of Mines Research Organization [3].
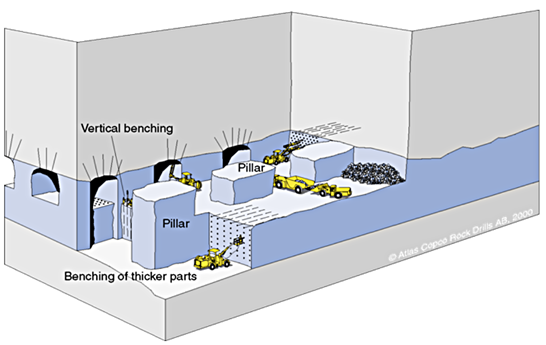
I was involved in the determination of the stress distribution and strength of coal mine pillars, as part of the research program established after the Coalbrook disaster. This program existed for several years and resulted in the publication of several papers and guidelines for coal pillar design and the general safety of underground mines. The layout of an underground room and pillar mine is illustrated in Figure 4.
The three-dimensional photoelastic models used to study the stress distribution in the rock forming and surrounding the pillars were constructed from blocks of epoxy resin, created by heating the component mix to 150⁰C to induce the chemical reaction, followed by slow cooling to ensure that these blocks were free from locked-in stresses. The rooms between the pillars were machined from one of the two blocks used in each model. These blocks were then glued together with an epoxy adhesive to form the complete three dimensional model. The model was loaded uniformly to simulate the gravitational load due to the weight of the overlying rock and, while still under load, the model was heated in an oven to a temperature of 150⁰C and then cooled at 1.5⁰C per hour until the temperature had fallen to below 70⁰C. This process “froze” the three-dimensional stress field into the epoxy resin model which could then be cut into slices, approximately 3 mm thick, to allow the resulting photoelastic pattern to be viewed in polarized light.
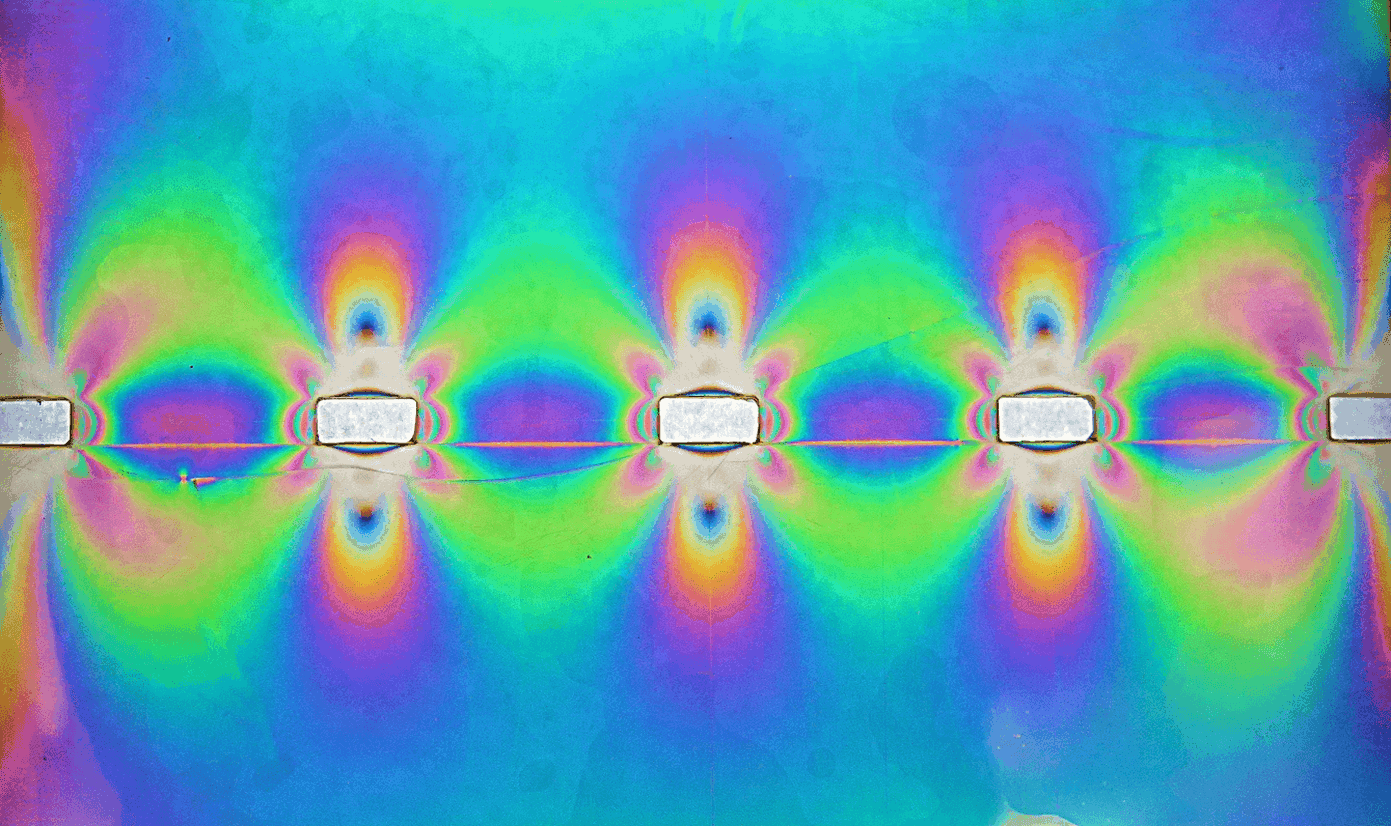
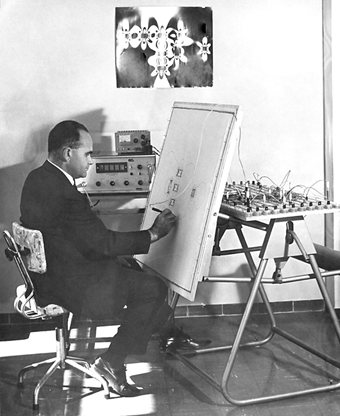
A typical photoelastic image in one of these slices is reproduced in Figure 5. The coloured fringes illustrated represent contours of principal stress difference (σ1 –σ3) in the model. To separate the principal stresses, an electrical analog model was used, as illustrated in Figure 6. This model uses the voltage distribution in a sheet of uniformly conducting material to represent the distribution of the principal stress sum (σ1 + σ3). These two stress distribution patterns permit separation of the individual principal stresses s1 and s3 throughout the model.
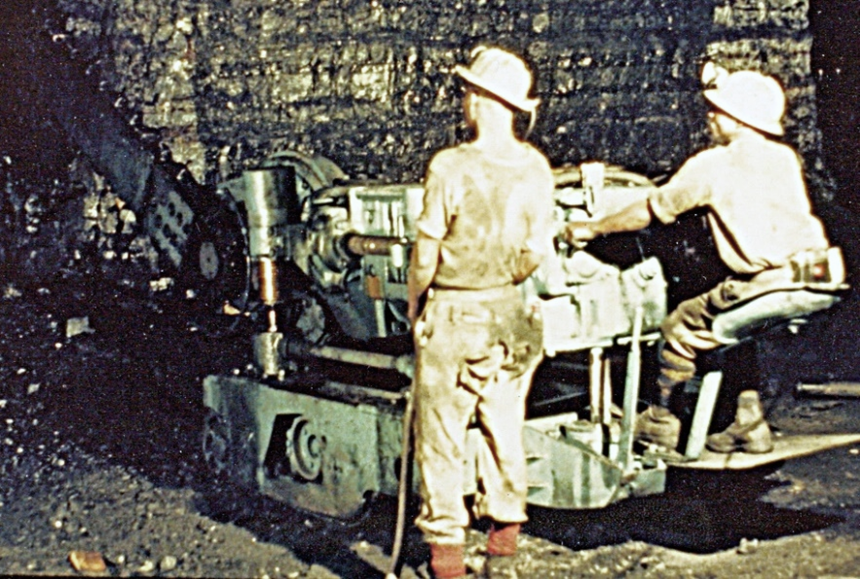
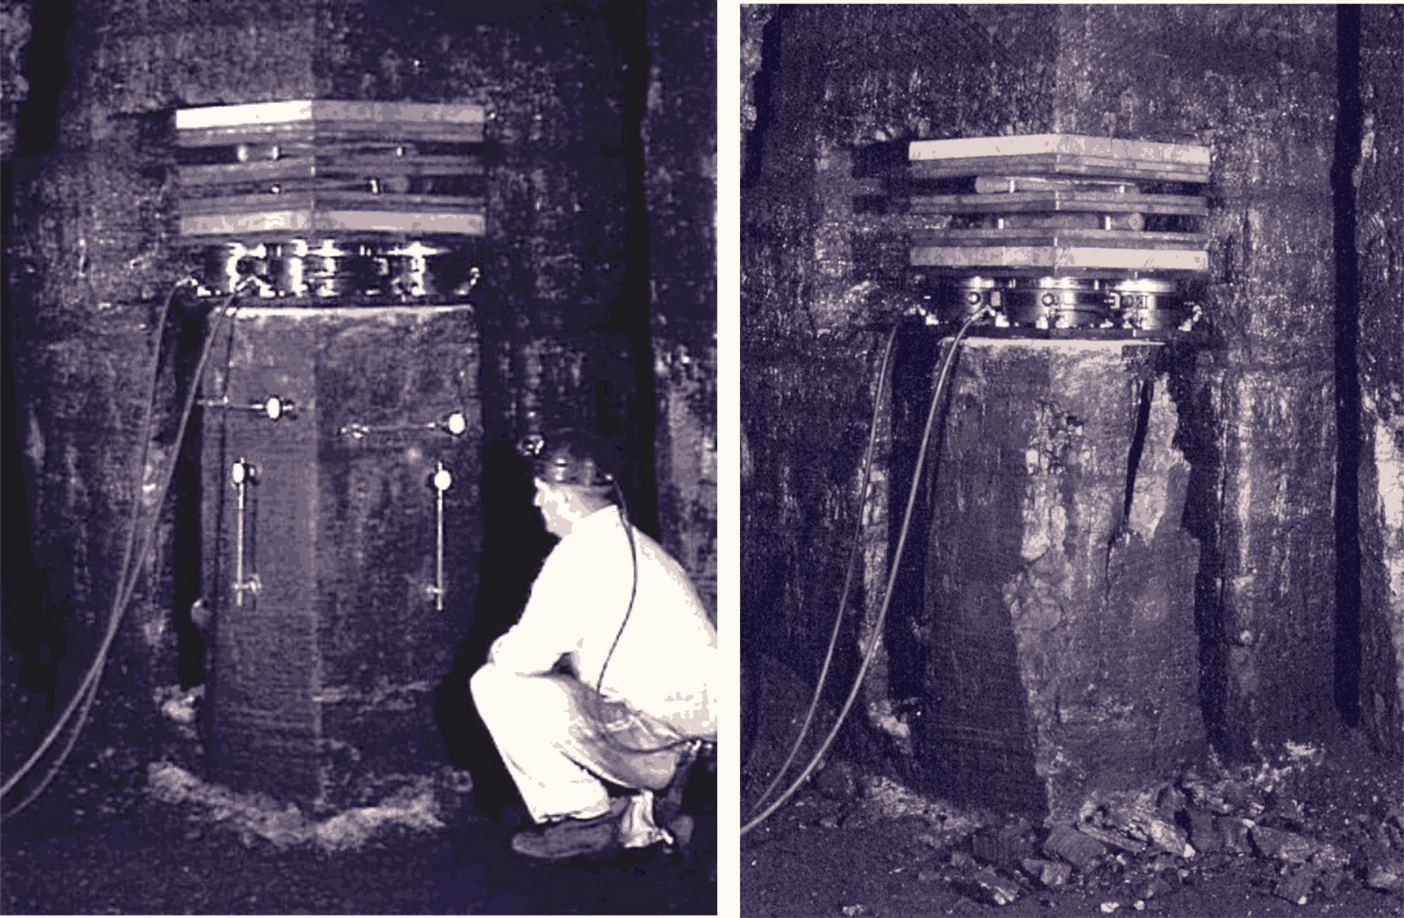
The design of pillars in a room and pillar mine requires a knowledge of both the stresses in the pillar and the strength of the rock mass forming the pillars. I was involved in designing and managing the first phase of a program to determine the strength of large specimens of coal in situ. Preparation and testing of these specimens are illustrated in Figures 7 and 8. After my departure from the CSIR in 1966, this project was continued under the direction of Dr. Z.T. Bieniawski [5].
In 1966, I was appointed to the academic staff of the Imperial College of Science and Technology, which is one of the colleges of the London University in England. I worked in the Royal School of Mines, but I had close associations with the Departments of Civil Engineering and Geology. The Department of Civil Engineering had a strong soil mechanics division and engineering geology was an important division in the Department of Geology. The purpose of my appointment was to establish a division of rock mechanics in the Royal School of Mines to offer introductory and graduate courses as well as research opportunities in this field.
My arrival at Imperial College in 1966 coincided with the creation of the postgraduate Centre for Computing and Automation. This centre incorporated work in computing by the Department of Mathematics which, in the early 1950s, had built a digital relay computer named the Imperial College Computing engine. My postgraduate students had access to this new computing centre and were soon preparing their own Fortran punched cards and delivering stacks of these cards to the computing centre; returning the next day to receive the results. While this was a clumsy and time-consuming process, it played a critical role in the development of the powerful programs that we take for granted today. One of the first papers published on this work was by Peter Cundall in 1971 [6].
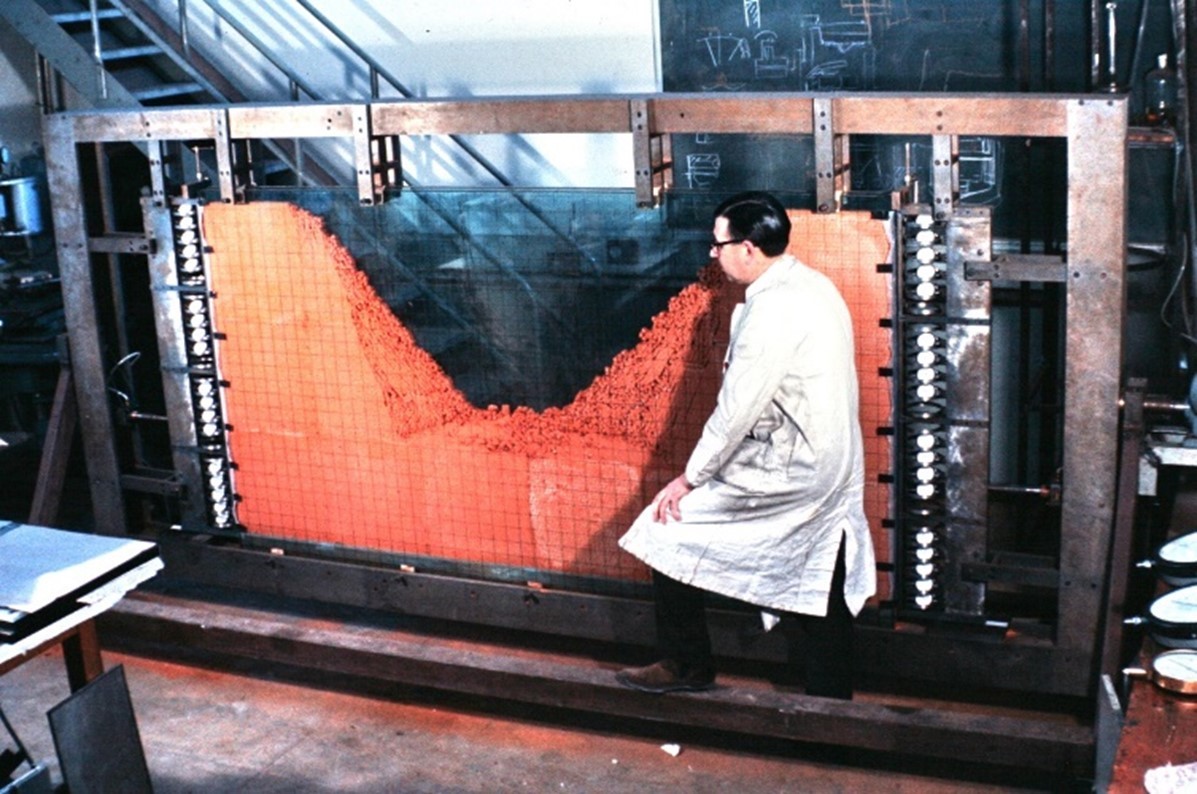
This shift to numerical analysis also resulted in the decline of the use of physical models such as photoelasticity since problems could be analysed numerically in a fraction of the time and with a significantly higher level of accuracy. However, physical models, such as that illustrated in Figure 9, still played an important role in helping us understand some of the failure mechanisms in jointed rock masses. In this model, designed by Nick Barton for his work on jointed rock masses, small pre-cast plaster blocks, representing the intact rock, were set in place on a large horizontal glass plate. Once the assembly of the model had been completed, a second parallel glass plate was added to keep the blocks in place. The frame was then rotated into the vertical position, thereby activating the gravitation load on each block. The resulting slope failures were important components of the development of our understanding of rock mass behaviour.
-------
[1] I was awarded a PhD by the University of Cape Town in 1965 for my work on brittle failure in intact rock.
[2] Cook, N.G.W., Hoek, E., Pretorius, J.P.G., Ortlepp, W.D. and Salamon, M.D.G. 1966. Rock mechanics applied to the study of rockbursts. J. S. Afr. Inst. Min. Metall. 66, 436-528.
[3] https://en.wikipedia.org/wiki/...
[4] https://miningandblasting.file...
[5] Bieniawski, ZT and Van, HW L (1975). The significance of in situ tests on large rock specimens. Int. J. Rock Mech. Min. Sci. Geomech. Abstr. 12(4):101-113.
[6] Cundall, Peter (1971): A Computer Model for Simulating Progressive, Large Scale Movements in Blocky Rock Systems, Proceedings International Symposium on Rock Fractures, Nancy, France, Paper II-8