4 - Driven Pile Analysis
1.0 Introduction
This tutorial demonstrates how to analyze a single driven pile in multiple soil layers under various conditions in RSPile. Before proceeding with the tutorial, make sure you’ve gone through Tutorial 01 - RSPile Quick Start so you’re familiar with the product’s basic functions and features.
Topics Covered in this Tutorial:
- Multi-layer model
- Soil types for driven piles
- Pile properties
- Export data to Excel
Finished Product:
The finished product of this tutorial can be found in the Tutorial 4 Quick Start – Driven Pile Analysis.rspile2 data file. All tutorial files installed with RSPile can be accessed by selecting File > Recent Folders > Tutorials Folder from the RSPile main menu.
2.0 Model
When the RSPile program is started, a new blank document is already opened, allowing you to begin creating a model immediately.
2.1 PROJECT SETTINGS
The Project Settings is where you can change the analysis type, tolerance, number of iterations allowed, and the number of pile segments to be used in the analysis. To open the Project Settings:
- Select Home > Project Settings
 (CTRL + J).
 - In the General tab, set the Units to SI (Metric) and Program Mode Selection to Capacity Calculations.
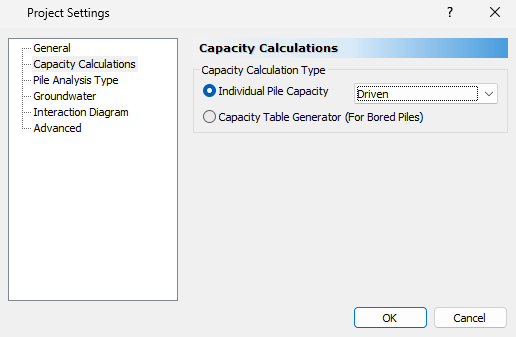
- In the Capacity Calculations tab, set Capacity Calculation Type to Driven.
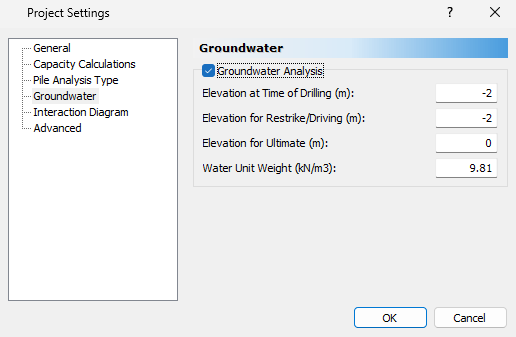
- Select the Groundwater tab.
- Check the Groundwater Analysis box.
- Define the following elevations:
- Elevation at Time of Drilling (m) = -2
- Elevation for Restrike/Driving (m) = -2
- Elevation for Ultimate (m) = 0
2.2 SOIL PROPERTIES
- Select Soils > Define Soil Properties
 (CTRL + 8).
In this dialog you can define the properties related to the Q-z, t-z, and p-y curves. There is a tab for the analysis type you selected in the Project Settings as well as for datum dependency. The Datum Dependency tab allows users to control linearly varying properties.
Define the material properties as shown in the table below:
Name
Unit Weight (kN/m3)
Soil Type
Undrained Shear Strength (kPa)
Adhesion Type
Skin Friction Angle (degrees)
End Bearing Angle (degrees)
Driving Strength Loss (%)

Cohesive
18
Cohesive
100
General Adhesion for Cohesive Soils (Tomlinson 1979)
-
-
17

Cohesionless 1
18.5
Cohesionless
-
-
32
32
8

Cohesionless 2
18.5
Cohesionless
-
-
36
36
8

Cohesionless 3
19
Cohesionless
-
-
38
38
20
There are two ways to define the friction angle in RSPile: manually input the Skin Friction Angle, or check the Use SPT N Values option and enter a table of SPT values from which the friction angle will be calculate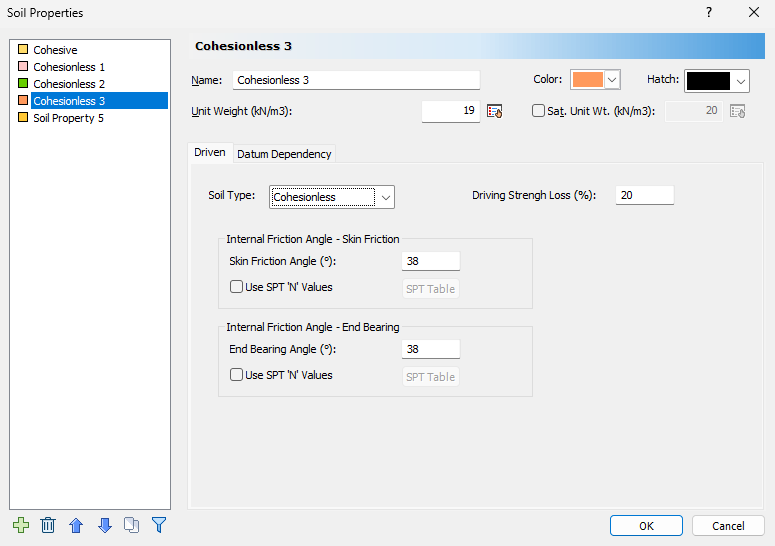
- Click OK to close the dialog.
2.3 SOIL LAYERS
RSPile supports multiple boreholes and non-horizontal soil strata. When multiple boreholes are defined, the program will automatically interpolate between the boreholes. In this tutorial, we will model horizontal soil strata with a single borehole. To begin:
- Select Soils > Edit All
 to open the Edit Borehole dialog.
The default soil column has a single layer and is located at (0, 0). To change the location, enter coordinates for X and Y. We will keep it (0,0) here.
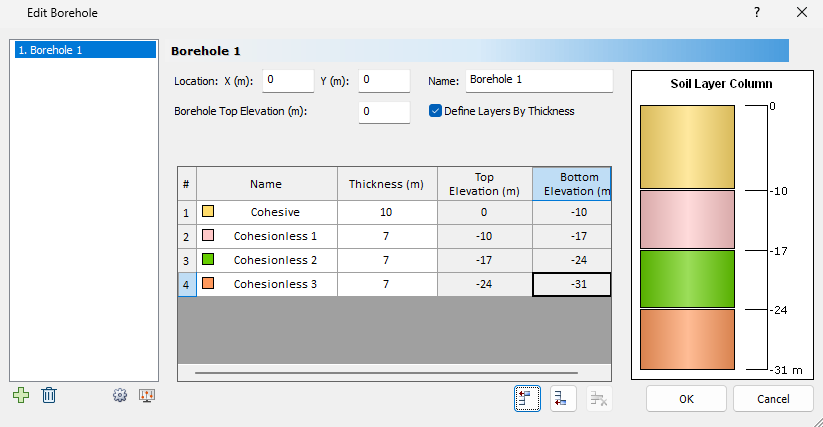
- Click on Insert Layer Below
 icon to add another layer below the first. For this tutorial, we will do this four times. The name column will fill in by soil property sequence. Layers are defined by thickness by default but may be defined by top and bottom elevation. This may be changed by toggling Define Layers by Thickness.
 Specify the following layer thicknesses:
#
Name
Thickness
Top Elevation
Bottom Elevation
1
Cohesive
10
0
-10
2
Cohesionless 1
7
-10
-17
3
Cohesionless 2
7
-17
-24
4
Cohesionless 3
7
-24
-31
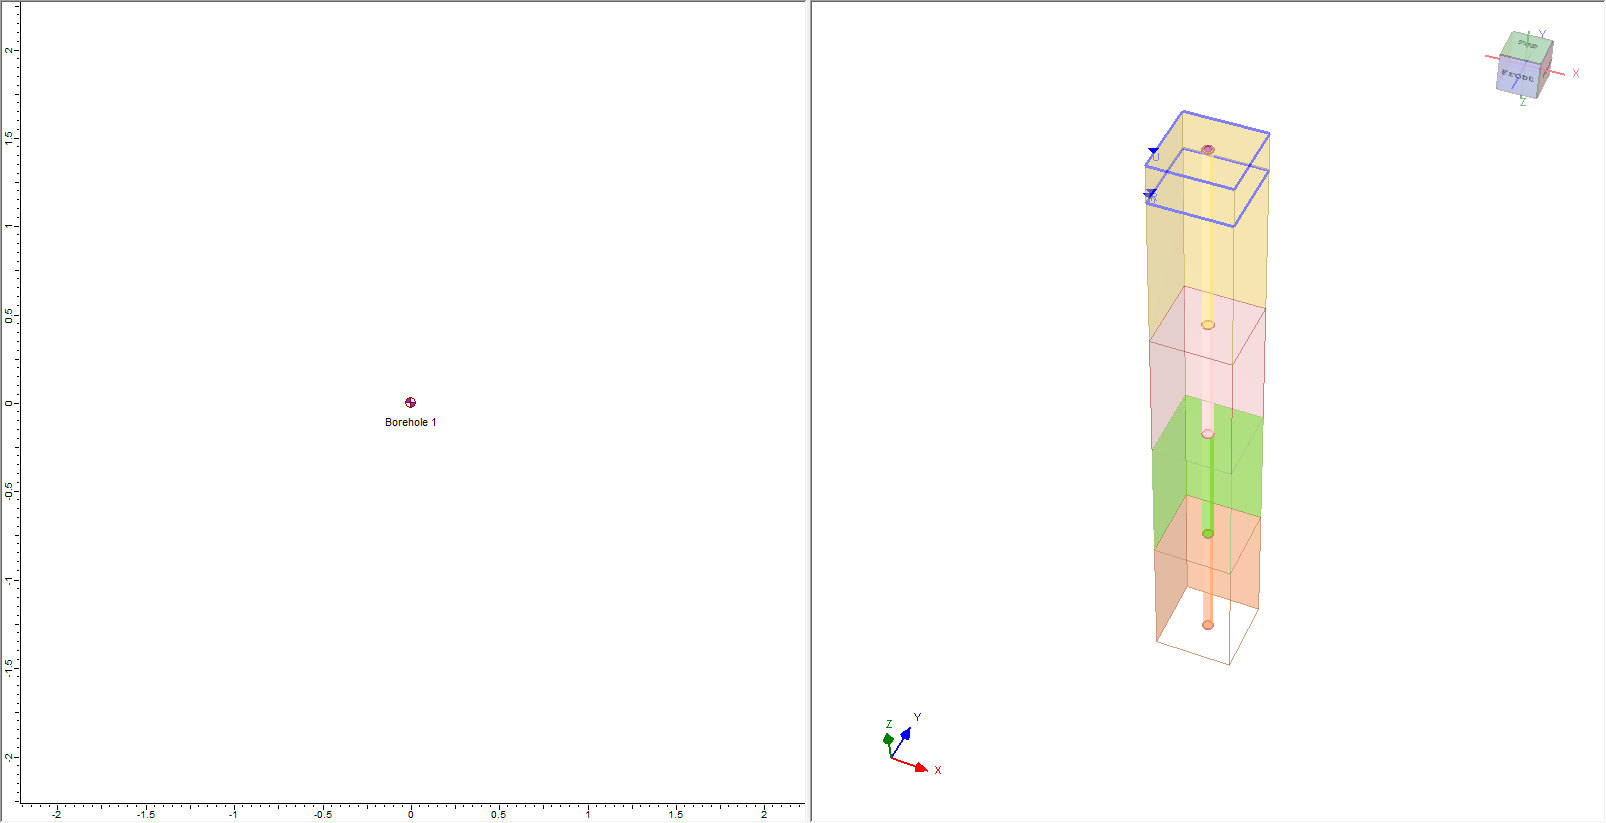
The Soil Layer Column on the right side of the dialog will update automatically as layer thicknesses are defined
- Click OK to save your input and exit the dialog.
2.4 OPTIONAL CAPACITY CONSIDERATIONS
- Select Home > Optional Capacity Considerations

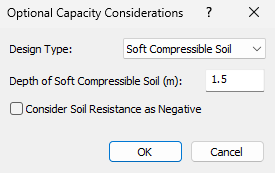
In the Optional Capacity Considerations dialog you can define additional parameters that will affect the Ultimate Capacity Analysis.
- Enter the following properties:
- Design Type = Soft Compressible Soil
- Depth of Soft Compressible Soil (m) = 1.5
2.5 DEFINE PILE SECTION PROPERTIES
- Select Piles > Pile Sections
 to open the Define Pile Section Properties dialog.
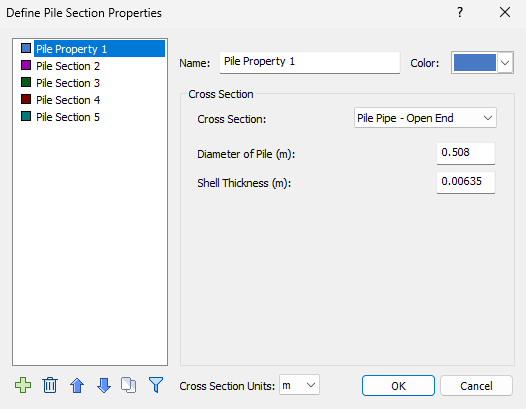
 - Select Pile Section 1 and enter the properties displayed below:
- Pile Cross Section = Pile Pipe - Open End
- Diameter of Pile (m) = 0.508
- Shell Thickness (m) = 0.00635
2.6 ADDING A PILE
To add a pile:
- Select Piles > Single
 to open the Add Pile dialog.
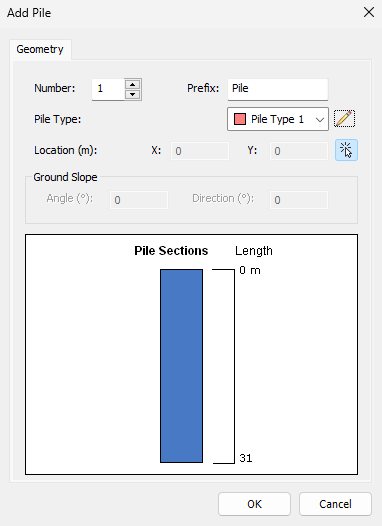
- Click on the Edit
 icon for the Pile Type and enter the following properties for Pile Type 1:
- Name = Pile Type 1
- Pile Head Elevation (m) = 0
- Length (m) = 31

You will be prompted to enter the (x,y) coordinates of the new single pile. You may enter the location manually in the bottom right of the screen, or click a point on the Plan View to place it.

Notice that the soil column has now been updated to reflect the strata.
3.0 Results
3.1 RESULTS VISUALIZATION
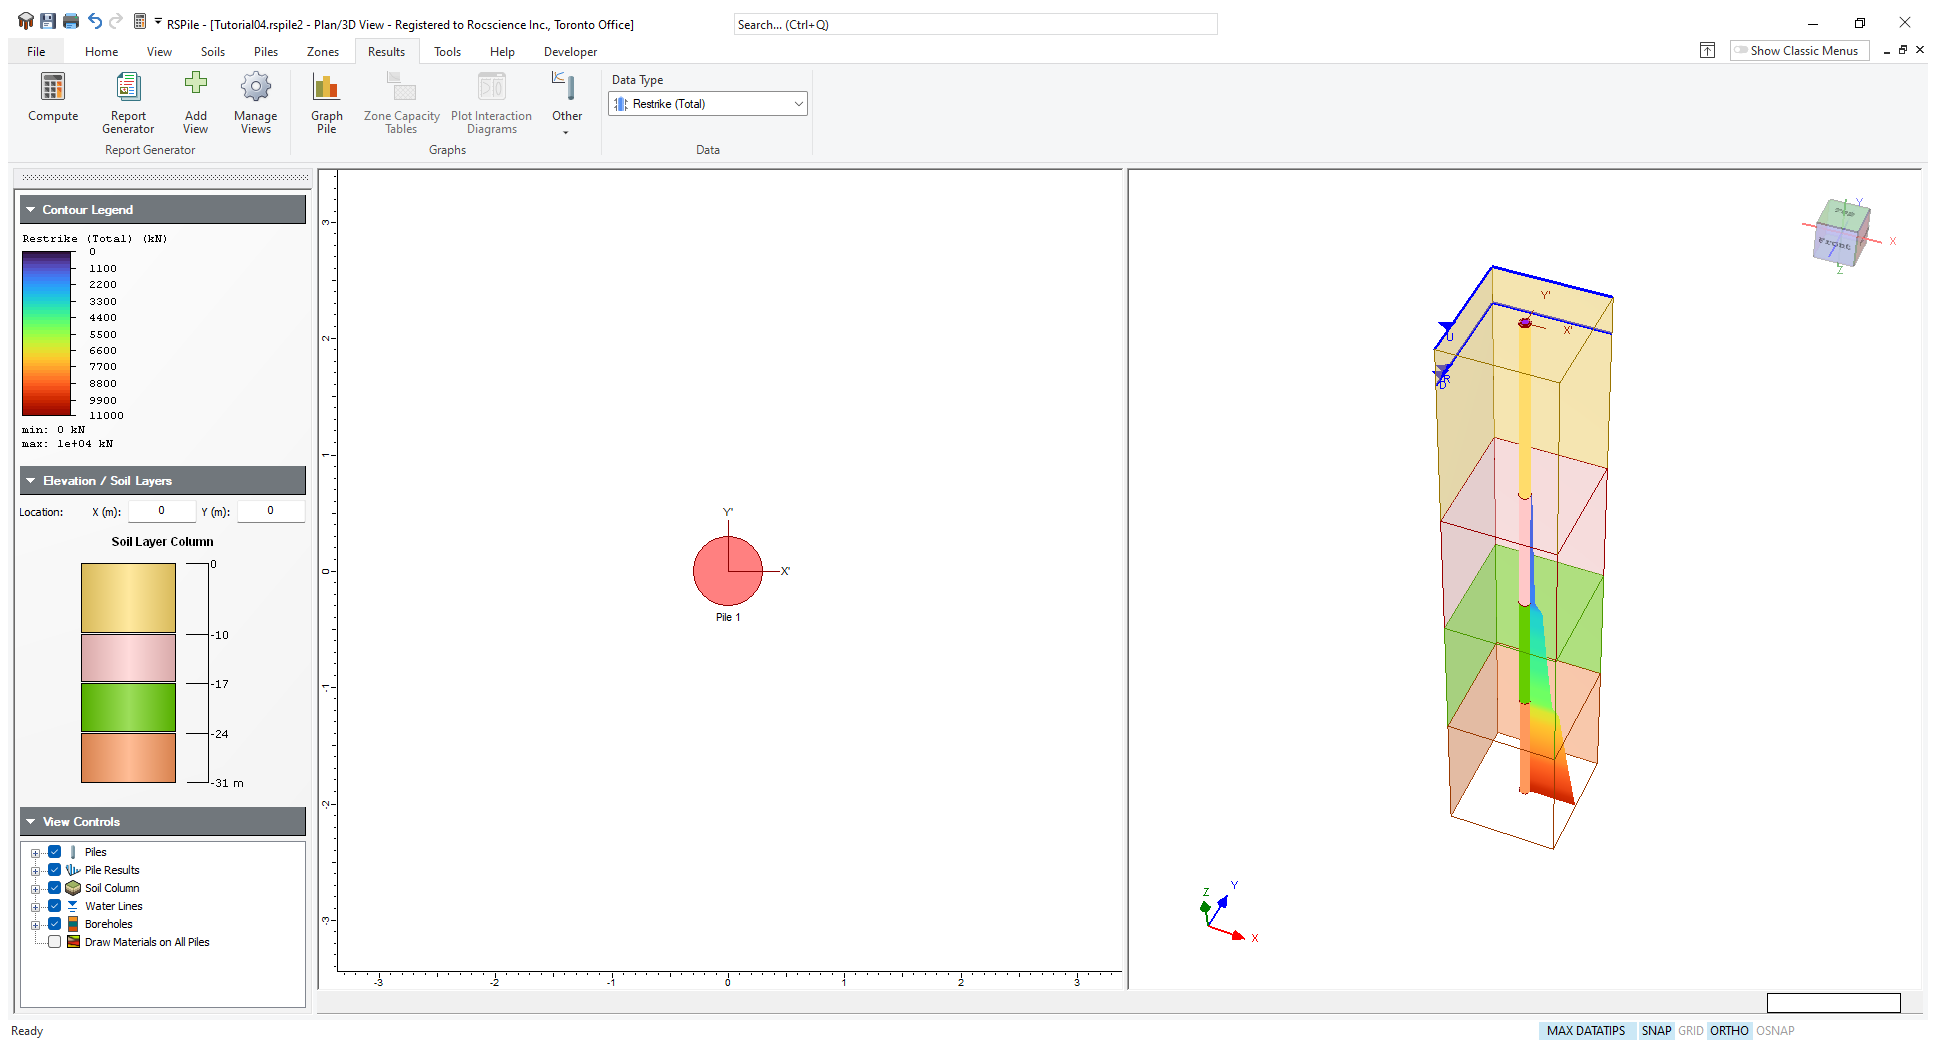
After clicking the Compute button, the Restrike Capacity is shown along the length of the pile by default. In the Results tab, use the Data Type dropdown to control what results are shown.

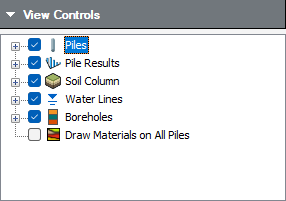
Pile Results may be toggled on or off using the View Controls in the sidebar.
3.2 GRAPHS
- In the Plan View, right-click on the pile and select Graph Pile

You will see the following results:
- Restrike (Total) vs Depth
- Driving (Total) vs Depth
- Ultimate (Total) vs Depth
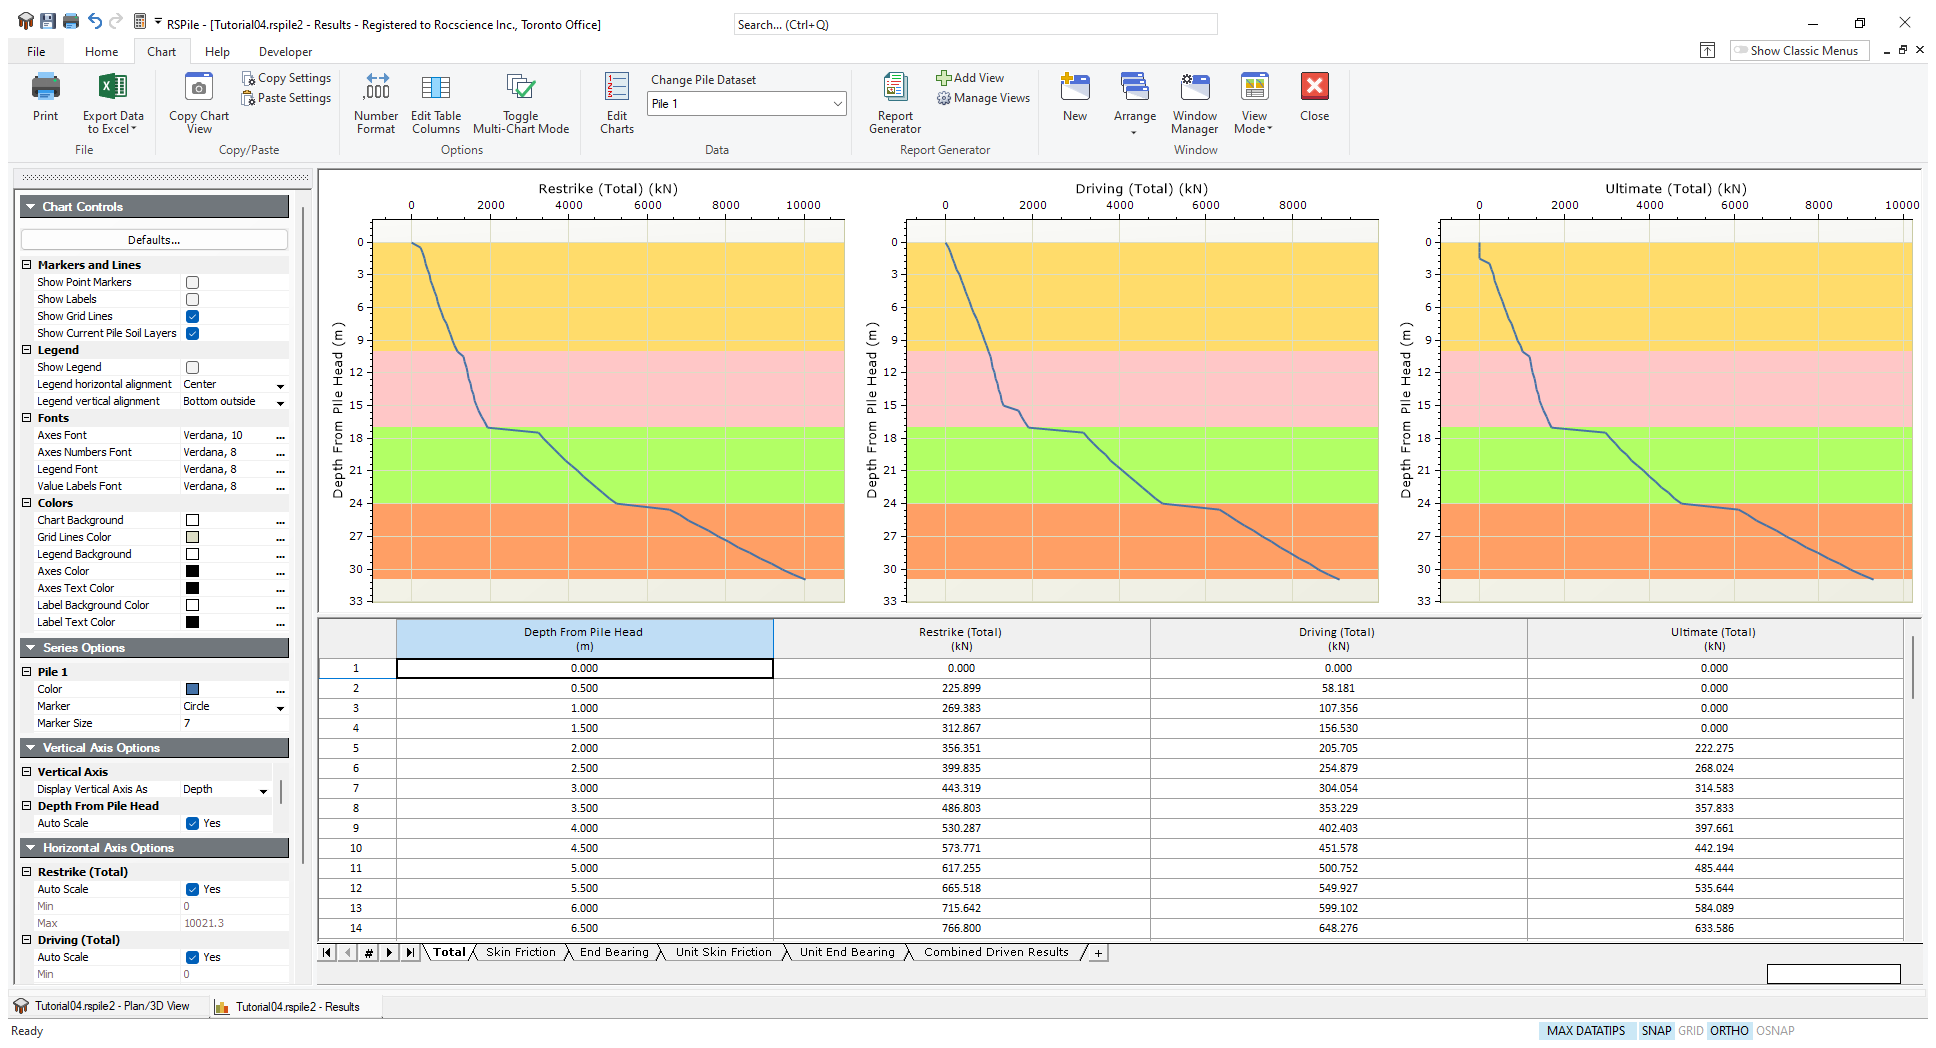
The sidebar contains the Chart Controls, which allow you to select what information is displayed and customize the appearance. The charts that are displayed, as well as the displayed tables, can be changed by right-clicking in the chart area and selecting what data you would like to edit in the dropdown menu.
You can use the tabs on the bottom of the Results window to switch between the following sets of results:
- Driven (Total) Results
- Driven (Skin Friction) Results
- Driven (End Bearing) Results
- Combined Driven Results
- Custom (+)
3.3 EXPORT TO EXCEL
From the Chart tab, you can export your data to Excel. To do so
- Click on the Export Data to Excel
 icon in the toolbar.
Each data type is exported to its own Sheet in the Excel file.
4.0 Report Generator
The Report Generator presents a formatted summary of input data and analysis results.
- Go back to the model view and select on the Results > Report Generator

The Report Generator contains a summary of the model input data:
- Project Summary
- Soil Layers
- Soil Properties
- Pile Section Properties
- Pile Types
- Pile Settings
The toolbar contains the Report Generator Controls, which allow you to select what information is displayed, and customize the appearance.
The data can be exported in a variety of ways: it may be manually copied, viewed in a browser, printed, or the information may be saved as a .pdf file. Prior to printing the file, results may be formatted to your specifications.
- Click on the Close
 icon in the Report Generator toolbar to close the viewer and return to the model view.
This concludes the Driven Pile Analysis Tutorial. You may now exit the RSPile program.