Slide3 and RS2 : The Tools of Choice for Back-Analysis of an Open Pit Mine Highwall Failure
Rocscience Slide3 and RS2 are widely known for their reliable and robust limit equilibrium and finite element slope stability analysis . It comes as no surprise, then, that they were the tools of choice for J.M. Kabuya et. al. in a paper presenting a numerical back-analysis of a highwall slope failure that occurred in an open pit mine in Canada.
The highwall was over 125 m high and 200 m wide, with the overall slope angle being 44°. The instability was detected by slope stability radar resulting in a multi-bench failure consisting of approximately 3,000,000 t of rock.
The Methodology
The methodology of the back-analysis consisted of three steps:
Step 1 – Base case models were developed and analysed using Slide3.
Step 2 – Iterative calibration of the base case model reproduced the observed failure characteristics.
Step 3 – Finite element back-analysis using RS2 to verify the results of Slide3.
The Inputs
Several data sources and assumptions were used in the preparation of the base (pre-calibration) modeling inputs for the slope failure back-analysis:
Geological Model
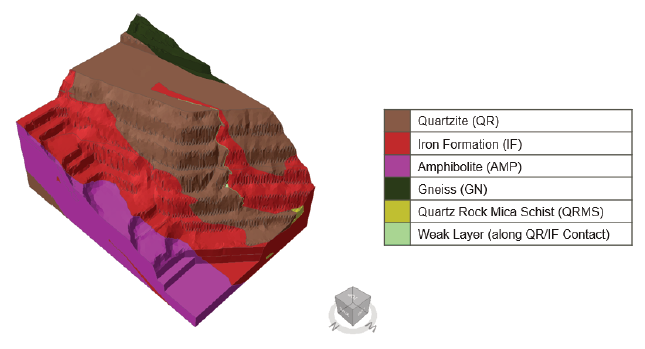
The mine geological block model was used as the basis for developing 3D geology solids to be used for the back-analysis modeling. These 3D solid files were clipped to the area of interest for Slide3 import and sectioned for use in RS2. Figure 1 depicts the geometrical model, including the geological model, used in the initial iteration of the base case model.
Geotechnical Model
A previous geotechnical characterization for the open pit as well as data presented specific to the highwall failure location were used for the base case modeling.
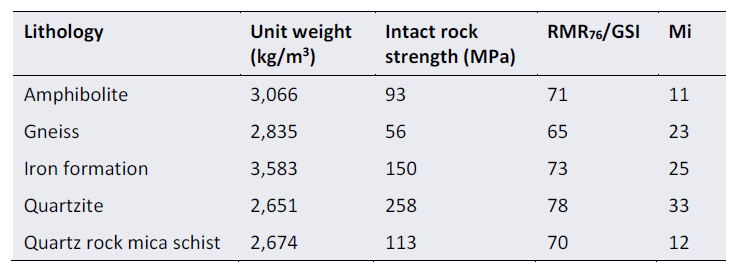
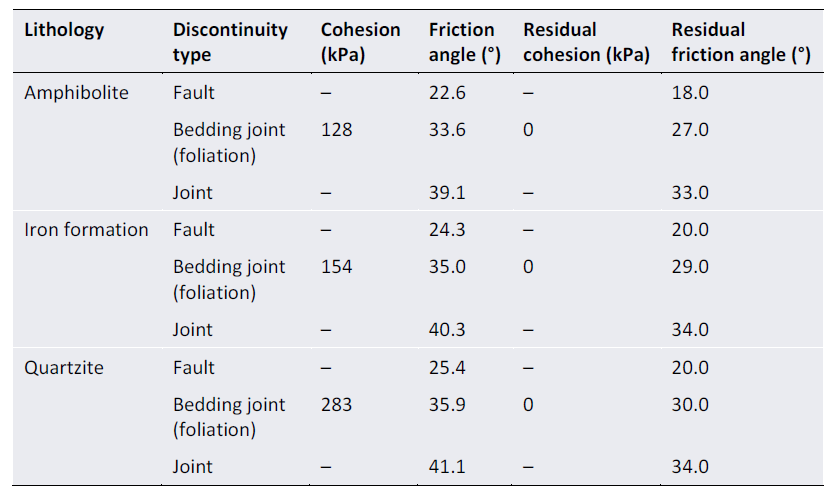
Rock mass strength – Base case rock mass strength and quality parameters for the five lithological rock units that were present in the southeast area of the open pit studied, were sourced from reported 35th percentile strength parameters used for 2D limit equilibrium analyses by Piteau Associates Engineering Ltd. (2016), as shown in Table 1 and were used as the input parameters for the base case finite element and limit equilibrium numerical models.
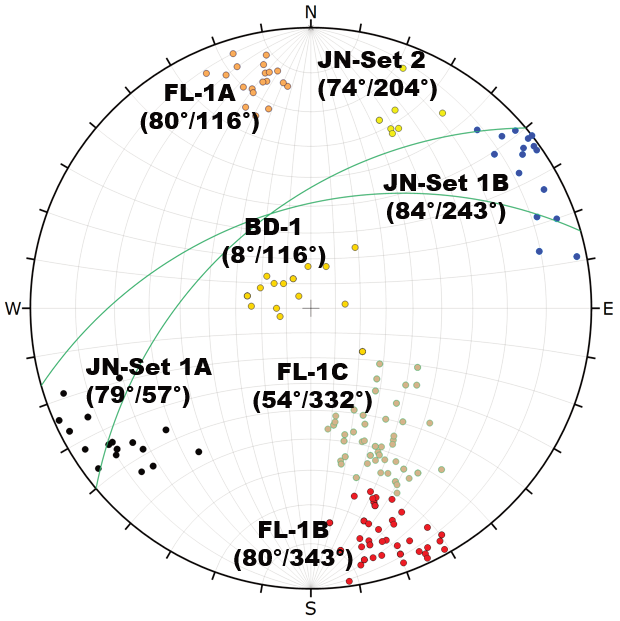
Orientations of discontinuities - Structural data was collected from photogrammetry mapping of the highwall. Figure 2 presents a stereonet representative of the discontinuity sets and orientations. Discontinuities along foliation in the region of the failure were typically moderately to steeply dipping, with strike near-parallel to the northwest-facing pit wall (FL-1B, FL-1C, and FL-1A). Cross joints oriented orthogonally to the foliation were also present (JN Set 1A/1B, BD-1).
Shear strength along discontinuities – For back-analysis modeling of the highwall failure, where photos indicated highly persistent foliation discontinuities, strengths based on 5% rock bridging were assumed for the orientations of bedding joints and other joints in the base case models. These strength parameters are summarized in Table 2 for discontinuities in AMP, IF, and QR.
Slide3 Limit Equilibrium Back-Analysis
Slide3 was the primary tool for back-analyzing the open pit highwall failure. The potential sliding mass is divided into vertical columns for analysis. An overall FOS for the sliding mass is calculated based on the forces and moments acting on each column, and this calculation is performed iteratively to search for the most critical potential failure surface, i.e., the slip surface with the lowest overall FOS.
Slide3 Model Development
The base case Slide3 model was developed progressively, beginning with an assumption of homogenous isotropic rock units and incrementally introducing anisotropic strength and discrete structures based on the input parameter assumptions. Complexity was added gradually to the models to understand the effects of each assumption on the stability analysis. In all cases, reported minimum FOSs were determined using the Janbu simplified force-equilibrium method and Cuckoo Search for ellipsoidal surfaces followed by surface altering optimization (SAO).
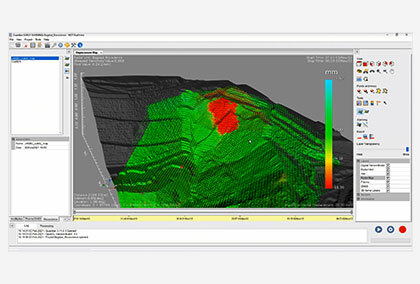
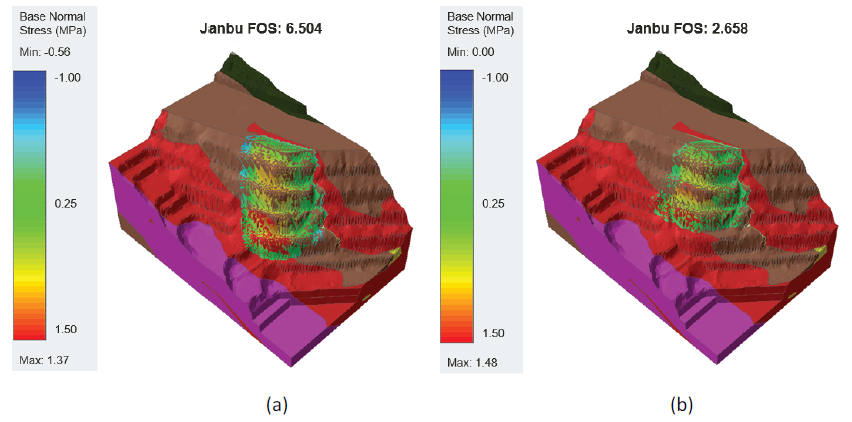
Base model (V1) – The geometrical model, including the geological model used in the initial iteration of the base case model, is depicted in Figure 1. The results of the isotropic rock mass model indicated that the slope was stable (minimum FOS = 6.5), suggesting that the estimated rock mass strengths alone do not effectively simulate the directional weakness that can control stability when persistent discontinuities are aligned with a direction of potential sliding. Nonetheless, the geometry of the lowest FOS slip surface did match well with the observed extents of the failure detected by the mine’s GroundProbe slope monitoring radar, as shown in Figure 3a.
Anisotropic strength added (V2) – With the aim of reducing the slope FOS and to better represent the directionally-dependent strength of the jointed rock mass, anisotropic strength windows representative of the average orientation of Foliation 1B and 1C (67°/338°) and joint sets JN-1A (79°/57°) and JN-1B (84°/243°) were added to all rock units in the model, which resulted in a reduced slope FOS of 4.8. When anisotropic strengths representative of JN-2 (74°/204°) and BD-1 (8°/116°) were also added, FOS was further reduced to approximately 2.7 (Figure 3b).
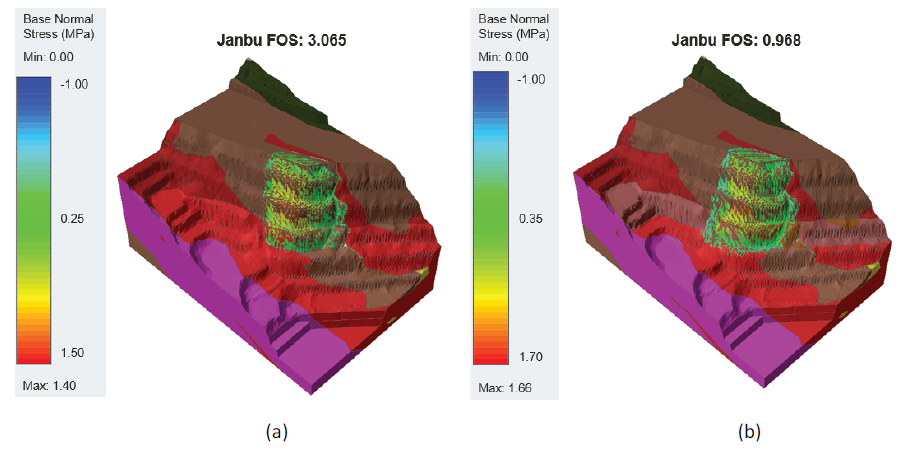
Elevation-dependent foliation (V3) – To further define the foliation structure present in the immediate area of the highwall instability, and in an attempt to adjust the predicted failure geometry, separate structural regimes were defined for the upper and lower slopes in the failure area. Figure 4a depicts two sections within the V3 limit equilibrium model, denoted by the colour variation in QR. Analysis of the V3 model did not significantly alter the predicted failure geometry from V2 and indicated a slightly increased critical FOS (3.1). Despite this, the V3 model was considered the best estimate of the geometric and structural features of the highwall failure.
Slide3 Model Calibration
A calibration of strength parameters and groundwater conditions was performed on the V3 model to reduce the estimated FOS to approximately 1.0 and to match the observed extents of failure and interpreted mechanisms of failure. To do so, variations of parameters related to shear strengths, discontinuities, and groundwater conditions were tested.
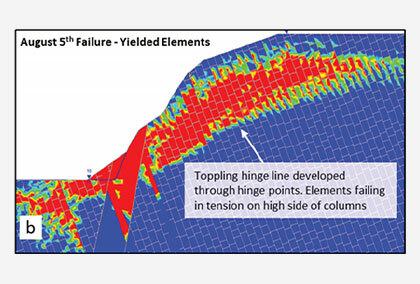
Results of the tests produced a model with a minimum slope FOS of 0.97 for a failure surface that slides along the weakened QR-IF contact, exiting the slope at a minimum toe elevation of approximately 642 m, exploiting the weakened BD-1 joint set at the toe. Figure 4b shows an image of this failure surface. The same model, run without the influence of groundwater, indicated a slope FOS of 1.3. Equivalent models run using the 2015 and 2017 pit topography surfaces produced FOS values of 8.2 and 1.2 under wet conditions, respectively.
RS2 Finite Element Back-Analysis
A section through the highwall failure mass was analyzed in RS2 to verify the results of the Slide3 modeling exercise and to explore the possibility of failure mechanisms not simulated in Slide3’s limit equilibrium calculation.
In RS2, the stability of a slope is quantified using the shear strength reduction (SSR) method. With this approach, the shear strength of the simulated rock mass and joints is incrementally reduced until instability occurs. The factor by which the strengths must be reduced to cause the instability, called the critical strength reduction factor (SRF), is analogous to an FOS calculated in Slide3. Critical SRF values were obtained for numerous variations of the RS2 model, mostly targeted at evaluating the influence of BD-1 strength parameters below 646 m elevation, groundwater conditions, and strain softening assumptions. Selected cases are presented in Table 3.
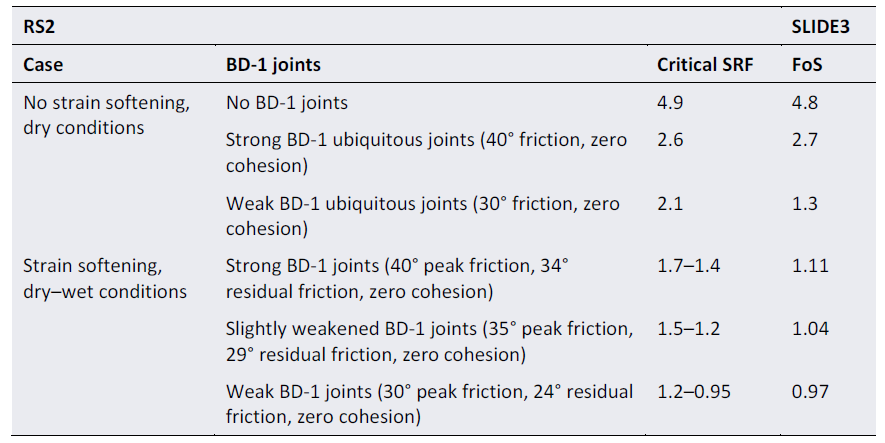
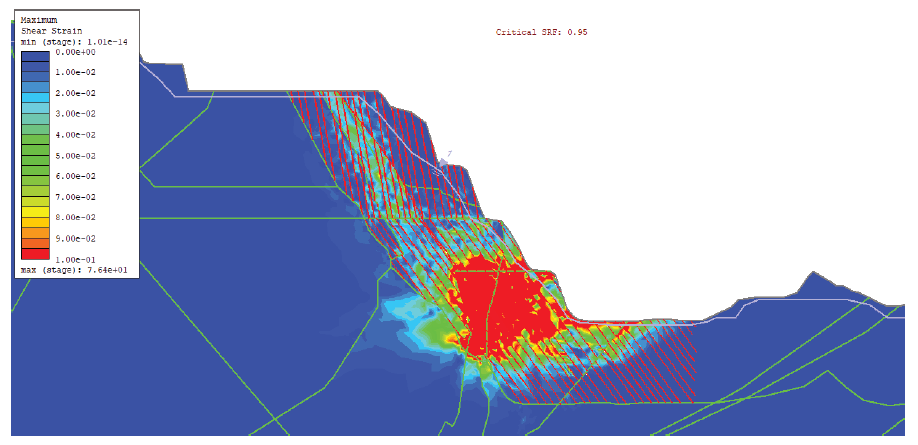
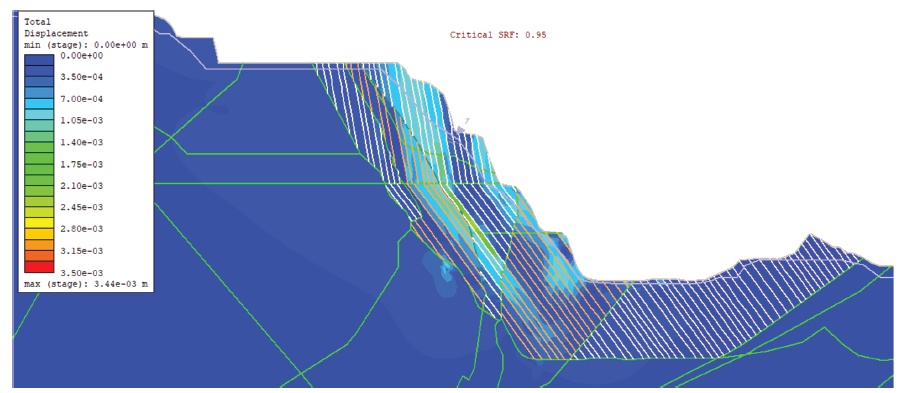
Figure 5 depicts the critical SRF state of the RS2 case 10 final model showing contours of maximum shear strain. The contact between QR and IF forms a significant portion of the upper failure surface and the sub-horizontal BD-1 joint set forms the lower portion of the failure surface. Figure 6 depicts the critical SRF state of the RS2 case 10 final model showing contours of total displacement.
Conclusion
The results of this simple calibration study were judged to reproduce the observed failure mechanism satisfactorily and may be referenced for future geotechnical design analyses for the open pit studied as well as other mine pits of a similar magnitude or where similar geotechnical conditions or features exist. In addition, the back-analysis highlights that understanding the geological variability associated with complex structural environments requires an excellent understanding of the orebody genesis and the regional geologic environment.
Reference
J.M. Kabuya, R. Simon, J. Carvalho, and D. Haviland. Numerical back-analysis of highwall instability in an open pit: a case study. Slope Stability 2020 - PM Dight (ed.). Australian Centre for Geomechanics, Perth, ISBN 978-0-9876389-7-7. https://papers.acg.uwa.edu.au/p/2025_62_Kabuya/.