FEM Modelling: Piled Raft Foundation Analysis in 2D and 3D
A common use for deep foundation piles is to increase foundation stability and to increase the bearing capacity of structural systems. To analyze these deep foundation piles, Finite Element programs like Rocscience’s RS2 and RS3 provide a variety of 2D and 3D tools for both design and analysis. The following example looks specifically at two similar piled raft foundations, performing analyses in both RS2 and RS3 to show both the advantages and differences between 2D and 3D analyses of deep foundation piles.
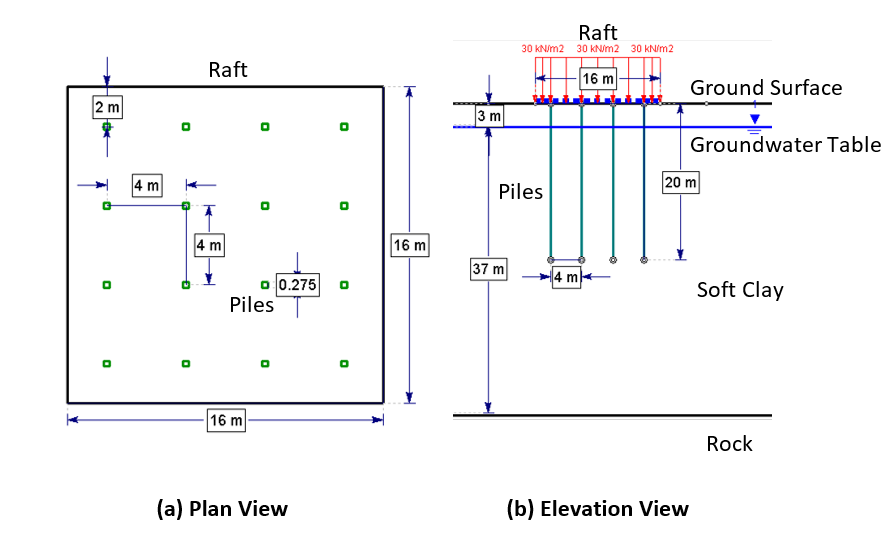
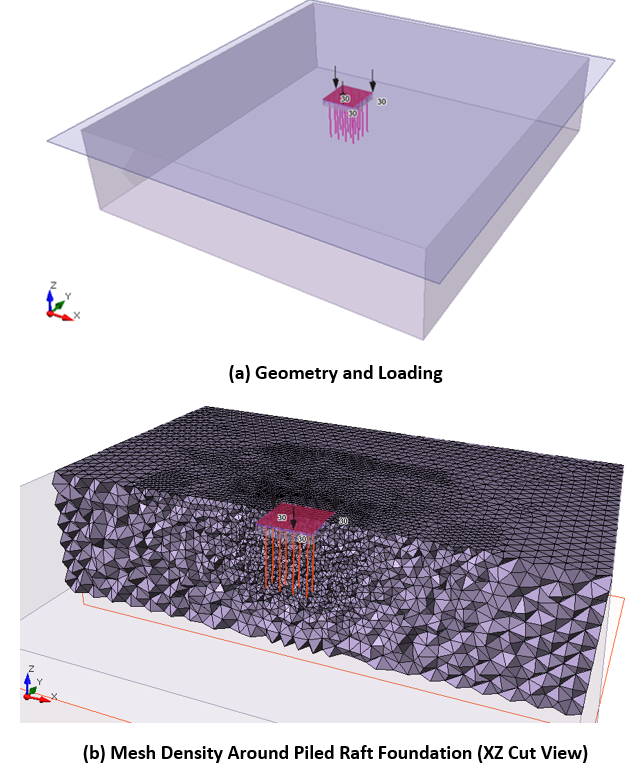
The approach used for the 2D and 3D analysis of these piled raft foundations was based on the study by Ryltenius (2011). As shown below in Figure 1, a uniform distributed load of 30 kN/m2 was applied to the piled raft built on a single soft clay layer. A firm rock layer is located directly under the soft clay, 40 m from the ground surface. A groundwater table is located 3 m below the ground surface. The square pre-cast concrete piles are 275 mm in width and are installed with a 16 x 16 m2 raft. The piles are evenly spaced at 4 m.
2D Piled Raft Foundation
Analysis Overview
A plane strain model was analyzed using RS2 where the out-of-plane rows of piles were simplified as liner (wall) elements defined using equivalent properties per 1 m out-of-plane. The raft was modelled as a liner support and the piles were modelled as structural interfaces which contain a liner sandwiched between two joints. For the structural interfaces, the liner modelled the pile structural behaviour while the joints modelled the soil-pile interface. The groundwater table was modelled using a piezometric line.
Geometry
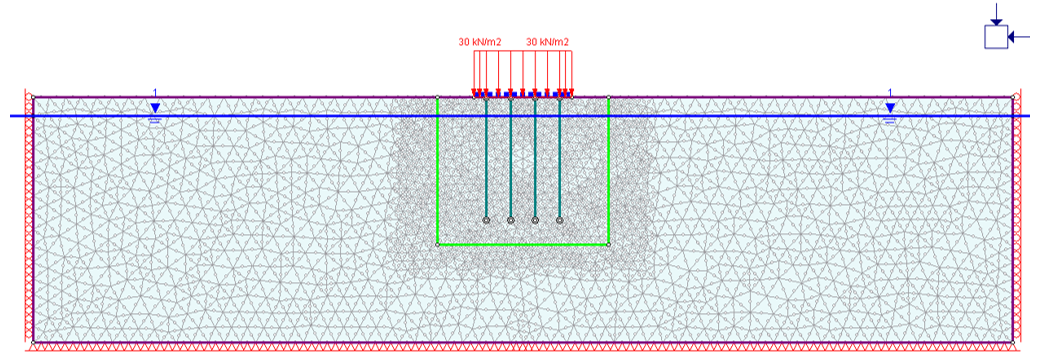
The 160 × 40 m2 model was restrained in both the x and y direction on the bottom and in the x direction only at the sides. A mesh refinement region was used around the pile raft, as high stress gradients are expected in that location. (Figure 2)
Material Properties
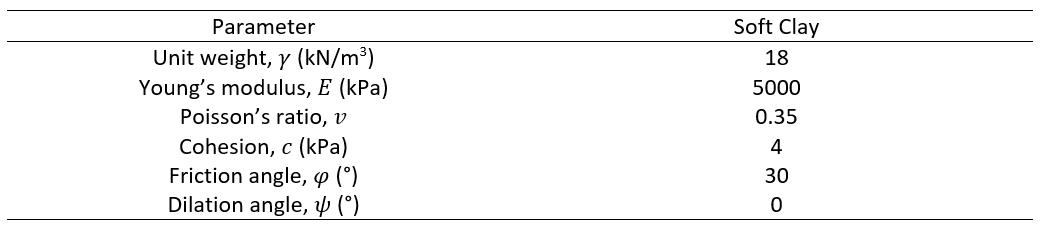
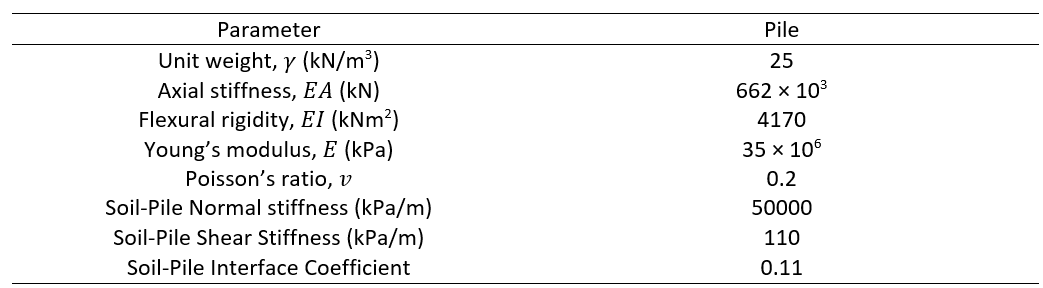
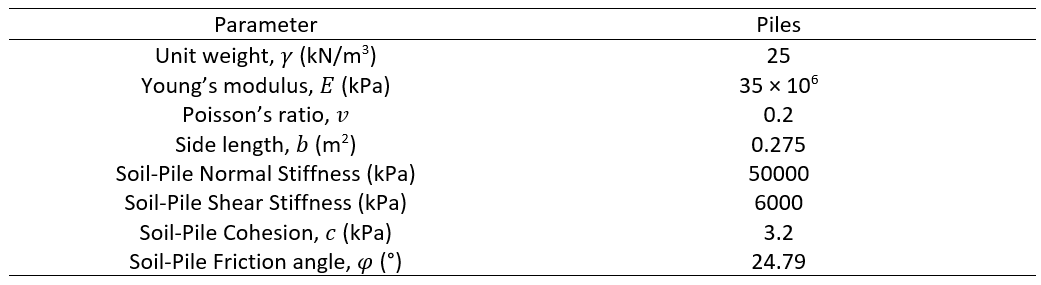
The soft clay was modelled as a Mohr-Coulomb model with the parameters in Table 1. The parameters used for the raft are shown in Table 2. The pile and soil-pile interface parameters to model each row of piles are shown in 3.

Results
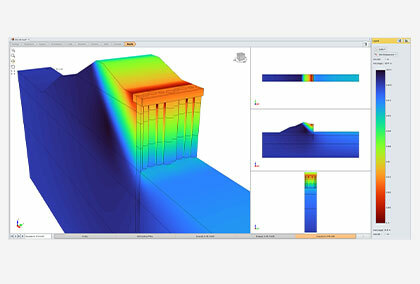
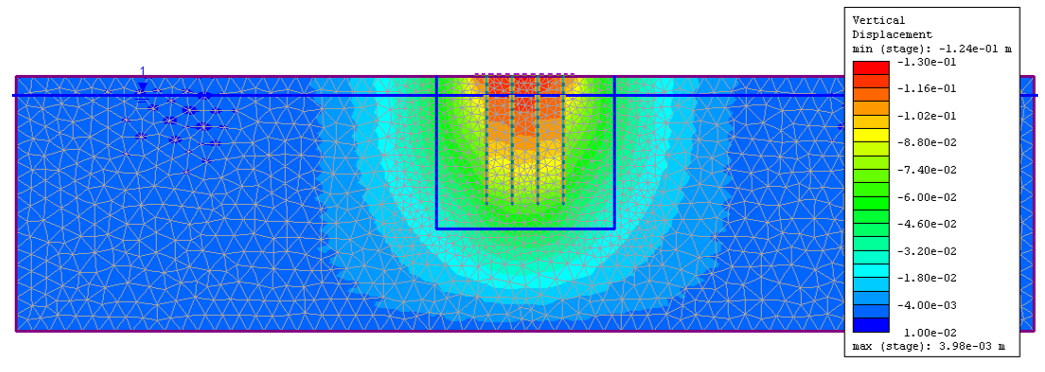
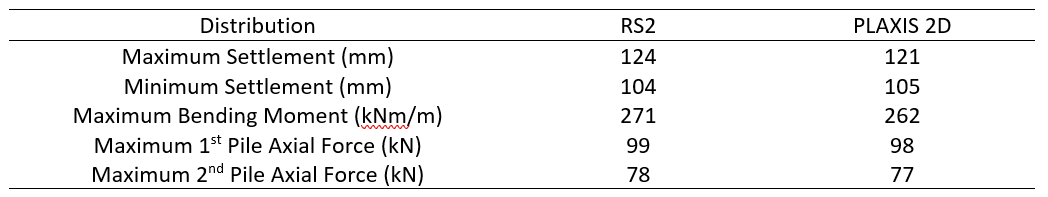
The maximum settlement of the piled raft is 124 mm, and the minimum is 104 mm. The differential settlement is 20 mm. The vertical displacement contours are shown in Figure 3 below and the deformed mesh in Figure 4.
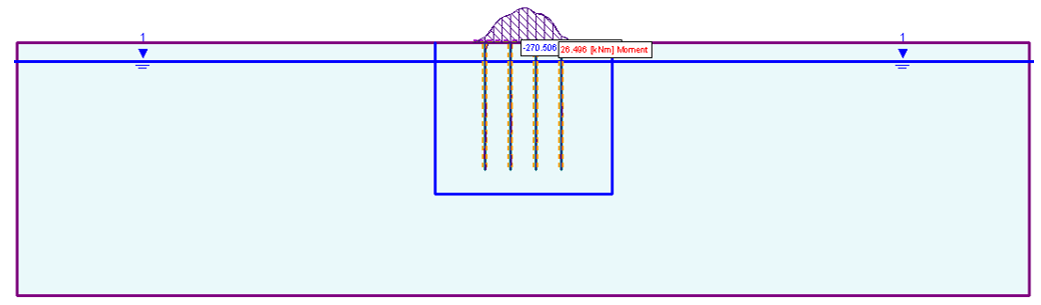
The maximum bending moment distribution for the raft is -271 kNm. The distribution is seen in the Figure 4 below.
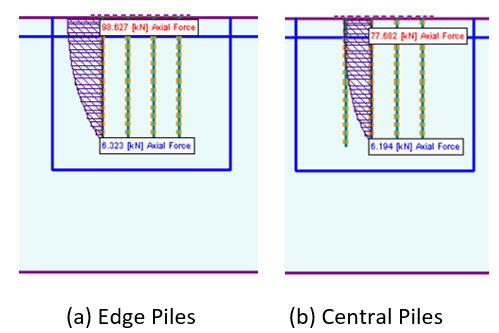
The maximum axial forces are located at the top of the pile and are 99 kN for edge piles and 78 kN for central piles. The distribution of the axial forces for the two piles are shown in Figure 5 below. Only the first two piles are shown due to symmetry.
The RS2 results compare well with the PLAXIS 2D results from Ryltenius (2011) as shown in Table 4 below.
3D Pile Raft Foundation
Analysis Overview
A 3D analysis was conducted in RS3. The raft was modelled as a liner support and the piles were modelled as pile supports. The groundwater table was modelled using a water surface.
Geometry
The 160 × 160 × 40 m3 model was restrained in the x, y and z directions on the bottom and in the x and y directions on the sides. A mesh refinement region was used around the piled raft foundation, as high stress gradients are expected in that location. Figure 6 presents the model and mesh density around the piled raft foundation.
Material Properties
The soft clay was modelled as a Mohr-Coulomb model with the parameters in Table 1. The raft parameters are the same as is used in Table 2. The pile and soil-pile interface parameters to model each pile support are presented in Table 5 below.
Results
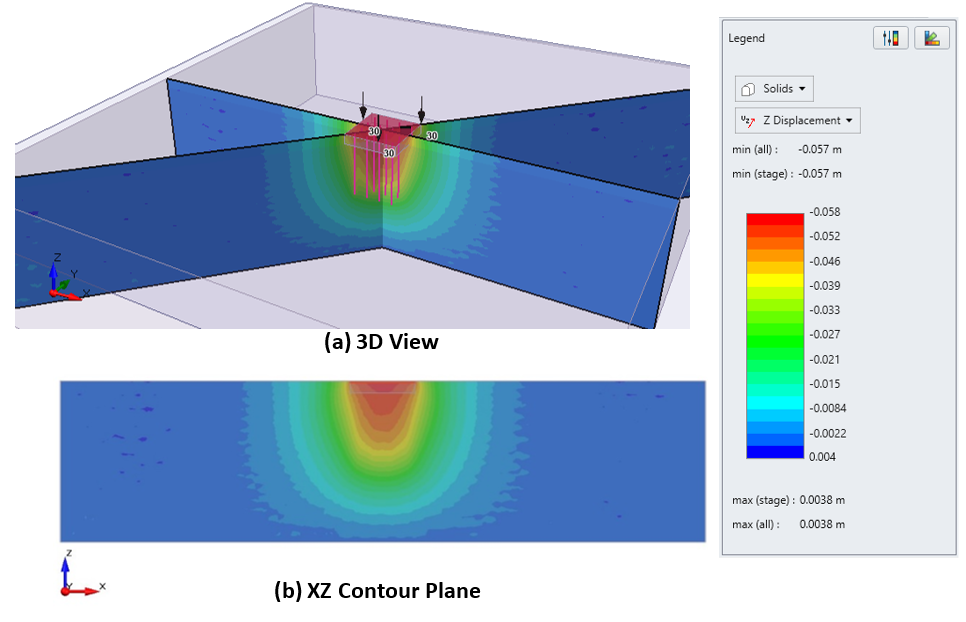
The vertical displacement contours are shown in Figure 7 below. The maximum settlement of the piled raft is 57 mm, and the minimum is 45 mm. The differential settlement is 12 mm.
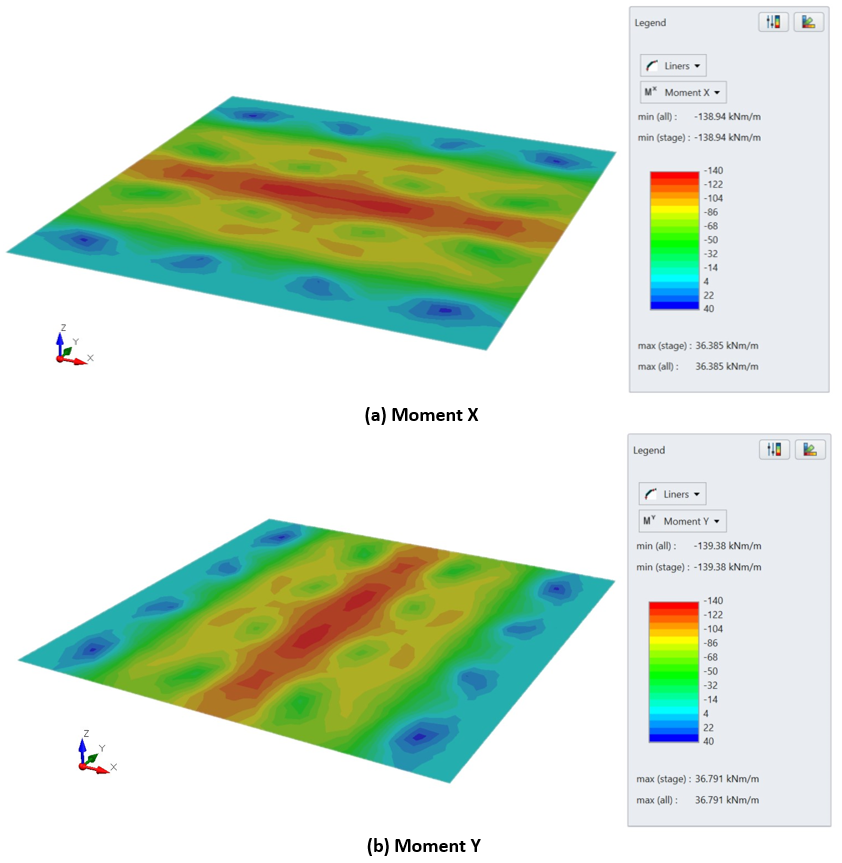
The bending moment distribution in the x and y directions are shown in Figure 8 below. Due to symmetry, the values for the two directions are equal. The maximum bending moment distribution is -139 kNm/m and the minimum is +36 kNm/m.
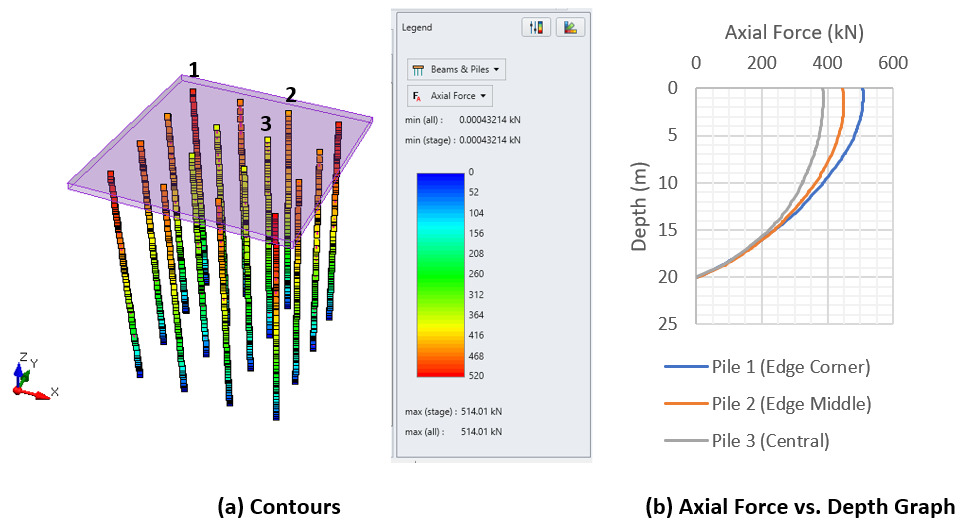
The distribution of axial force along the piles are shown in Figure 9. The maximum axial forces range between 372-514 kN.
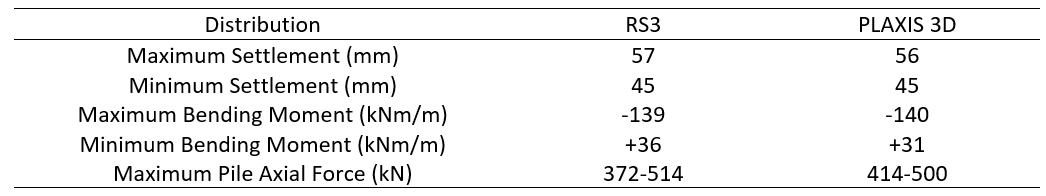
The RS3 results compare well with the PLAXIS 3D results from Ryltenius (2011) as shown in Table 6 below.
Reference
Ryltenius, A. (2011) FEM Modeling of Piled Raft Foundations in Two and Three Dimensions. Master’s Dissertation, Department of Construction Sciences, Lund University, Sweden.