Analysis of a Circular Pile Group Supporting a Heavy Alumina Storage Silo
By Ahmed Mufty, Ph.D.,P.Eng.
Rocscience's RSPile is a powerful tool that can be used to study the behaviour of piles in a group to obtain their required lengths and assess their load settlement relations. To demonstrate the pile design capabilities and flexibility of the program, this article presents the results of an analysis conducted on a circular pile cap with a heavy load.
The pile cap was 28 m in diameter and was designed to hold a cylindrical silo 38 m in height intended for Alumina storage. The results of the structural analysis showed that the most critical silo load combination, taking into consideration all wind and earthquake load conditions, was a total vertical load of 240000 kN, and that the load could generate a turning over moment of 1100000 kN.m, with a horizontal load on the pile cap equal to about 10% of the vertical load.
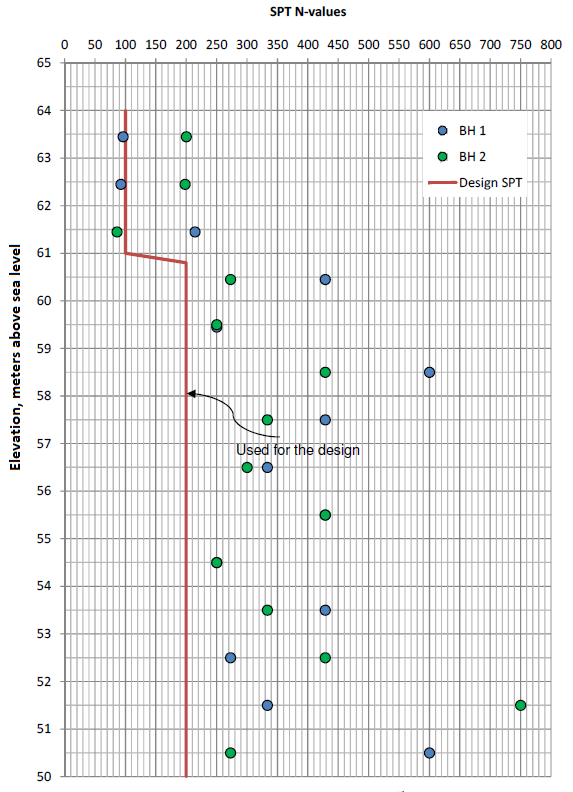
The ground layers at the site consisted of about 3 m of sandy gravel of high density overlaying even denser sandy gravel with cobbles and rock pieces that turned into conglomerates at a depth below the expected depth of the pile tips. A standard penetrometer test (SPT) was conducted on the site, and blow counts were recorded from two boreholes and extrapolated. Figure 1 below shows the blow counts plotted against depth.
Using RSPile to compute axial load, the Drilled Sand method to simulate load settlement behaviour was chosen, with the load settlement curve following the Reese Suggestion for piers drilled in sand (see the RSPile Axially Loaded Piles manual). This method depends on the ultimate unit skin friction and ultimate unit end bearing of the pile at each layer, showing that smaller diameter piles reach their ultimate capacity at less settlement than larger piles. Based on local experience and previous tests, the method by Reese and Wright (1977) was adopted to estimate the skin resistance and the end bearing, where:
Fsult = 150+2(N-53) in kPa for N>53
Fbult = 57.5N limited to 4300kPa
These correspond to values of 244 kPa and 444 kPa, for skin resistance for the two layers, respectively, while the ultimate end bearing was capped at 4300 kPa. These values were entered into the Axial tab of the RSPile Soil Properties dialog. In addition, Kpy values of 60 MN/m3 and 80 MN/m3 for the two layers, respectively, were entered in the Lateral tab.
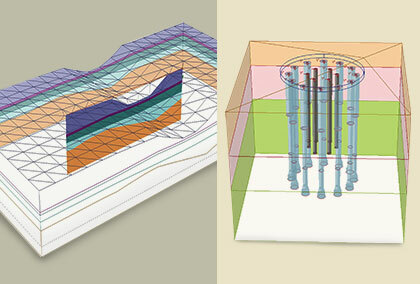
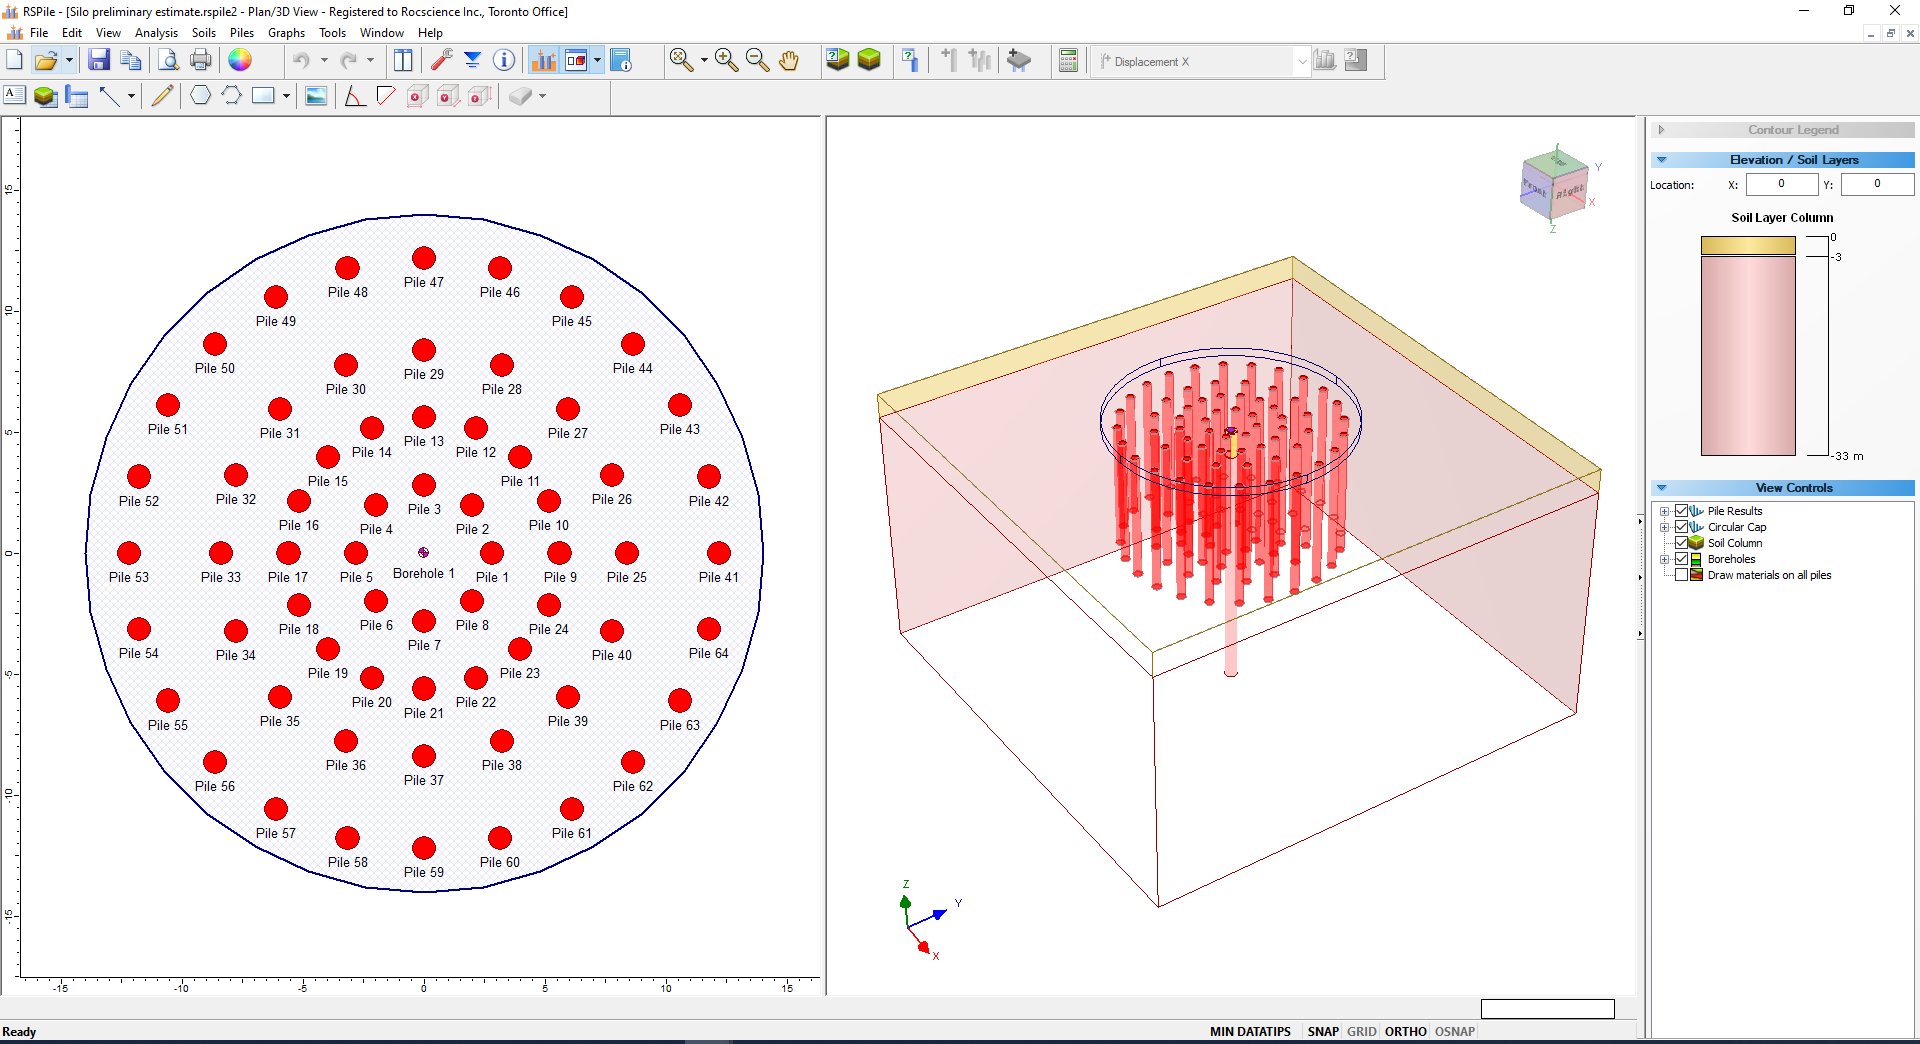
Based on the silo wall location, a preliminary trial layout was chosen for the piles to receive loads, with piles 1 m in diameter and 15 m in length, and a cylinder strength of 50 MPa and 0.6% reinforcement in their section along the length (see Figure 2).
A grouped pile analysis of the preliminary trial layout was performed, with Pile Analysis Type in the Project Settings Analysis tab set to Grouped Pile Analysis. Resulting load distributions for piles 1, 9, 25, and 41 (the piles that received the highest load) are shown in Figure 3. The accuracy limit was fixed to 0.001 and the number of iterations was limited to 200.
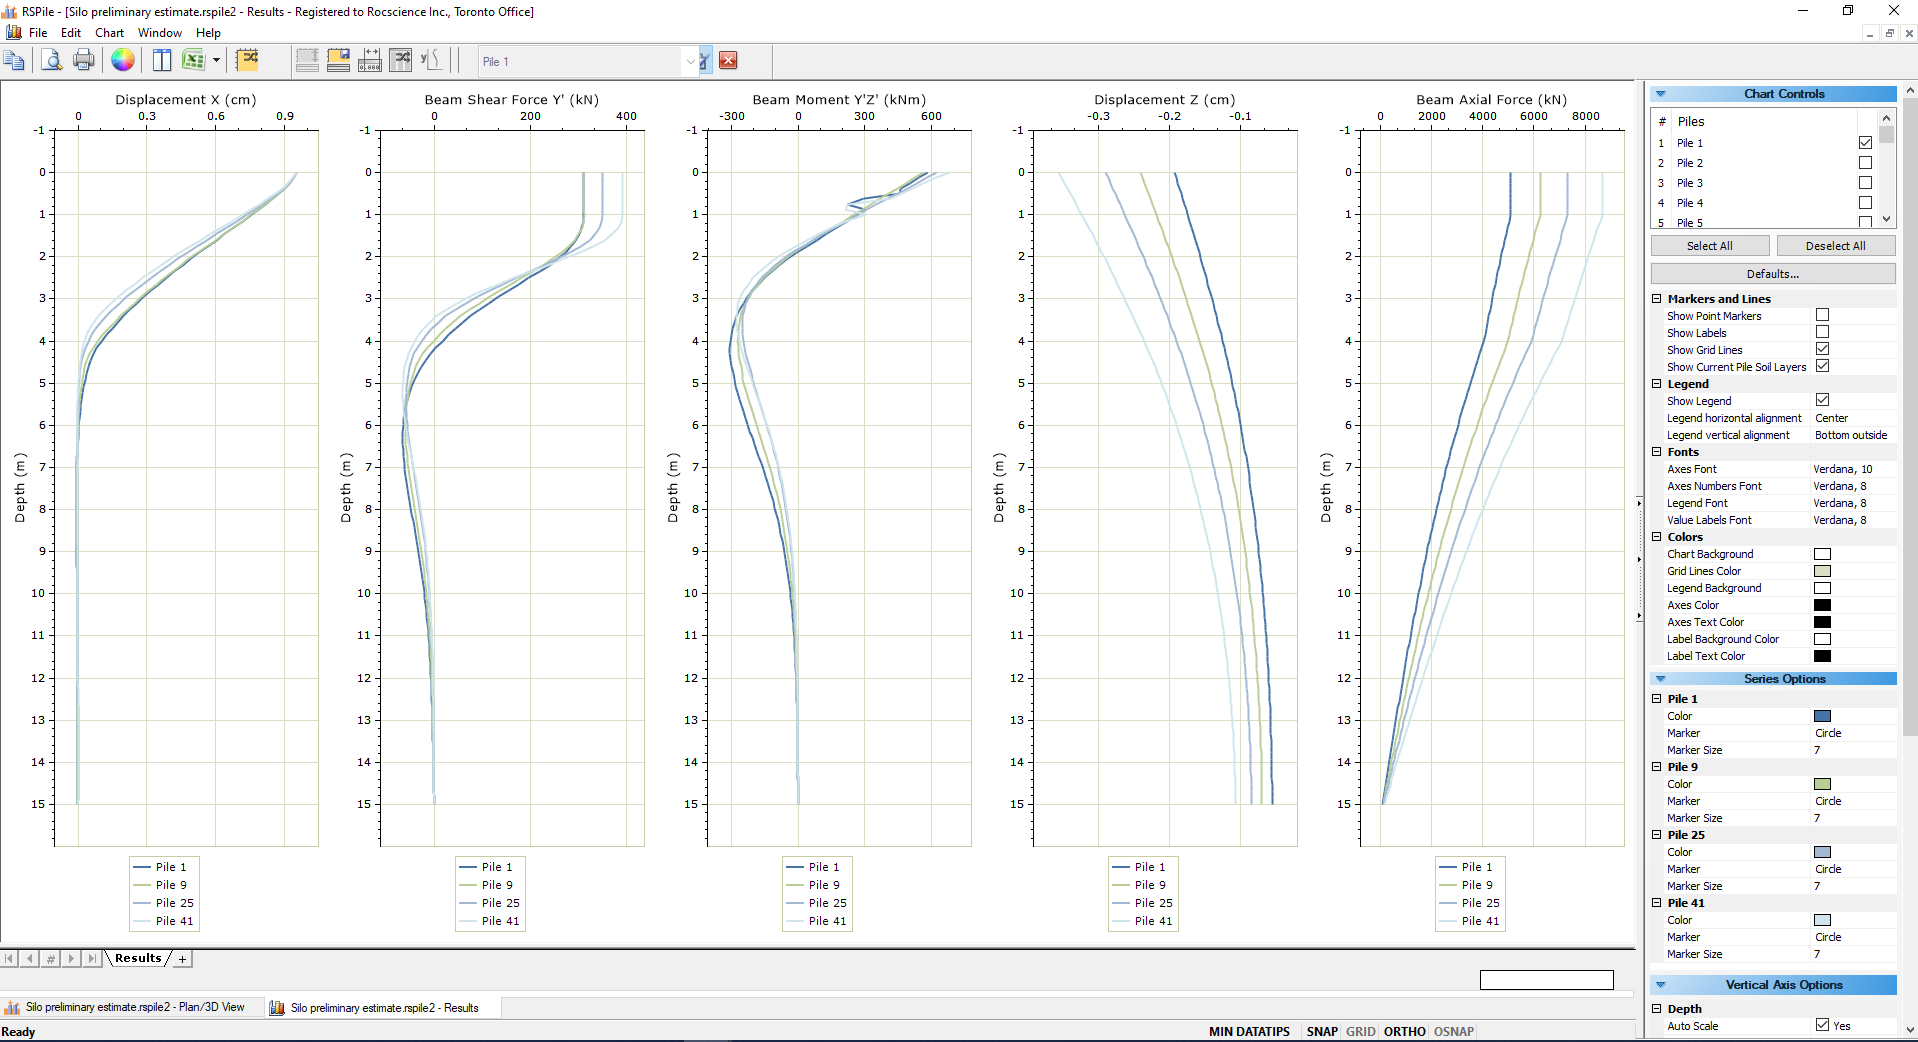
Results showed that the piles at the outer ring received a higher load than those at the inner rings, and that the shear force for the two inner rings was almost the same. According to the results, the piles in the layout were altered to types A, B, C, and D, as shown in Table 1.
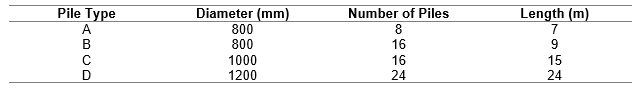
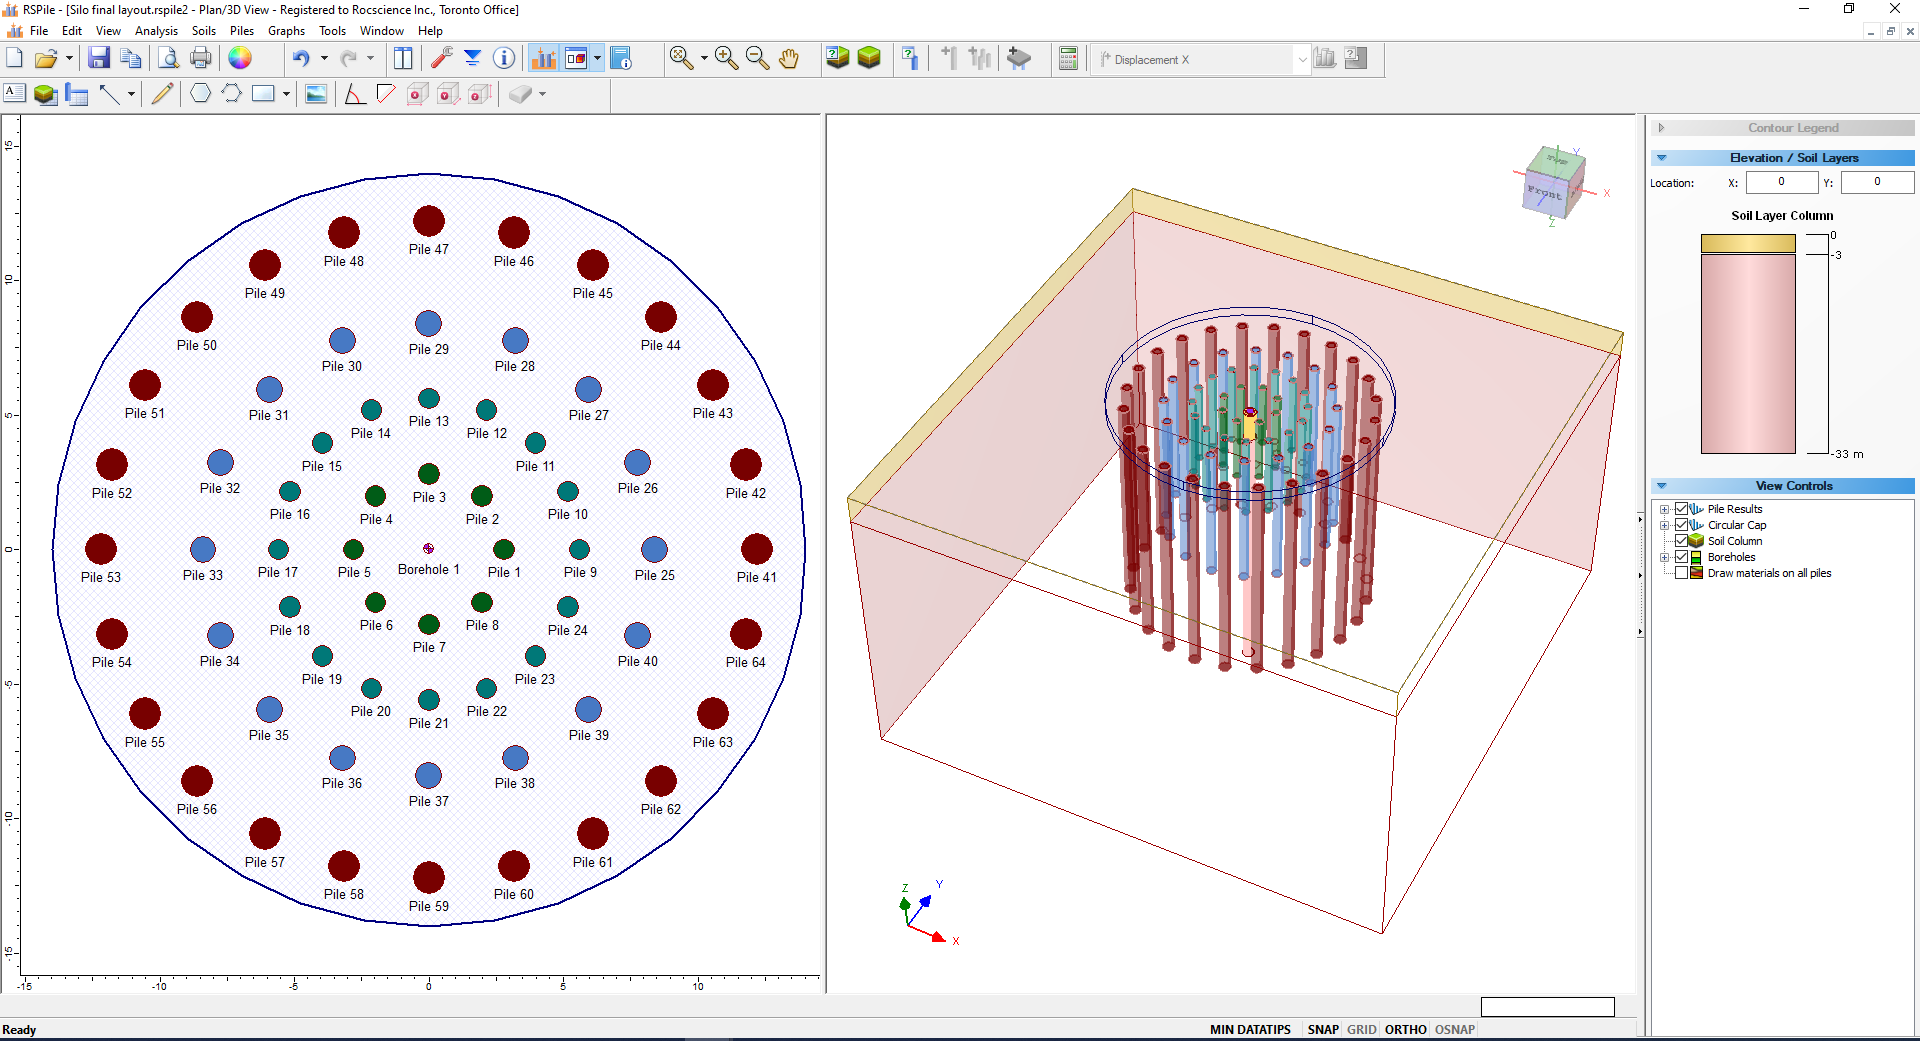
The distribution of the piles was kept unchanged, but the piles were given different diameters and lengths, based on their ring position. Shorter piles with smaller diameters were placed at the inner rings while longer piles with bigger diameters were placed at the outer rings. The revised and final pile layout in RSPile is shown in Figure 4.
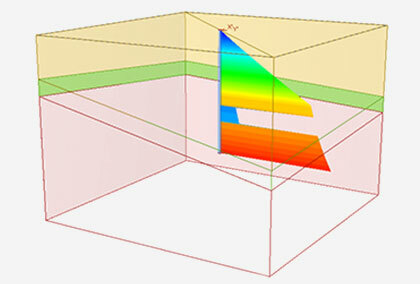
In order to calculate the load settlement for the different pile types, several analysis runs were performed on each pile type with different load levels. To accomplish this, another RSPile model was created for the same pile types in which the pile types were added as patterns, and the piles were then ungrouped and given different loads until an excessive settlement was reached. The model for this load settlement analysis can be seen in Figure 5.
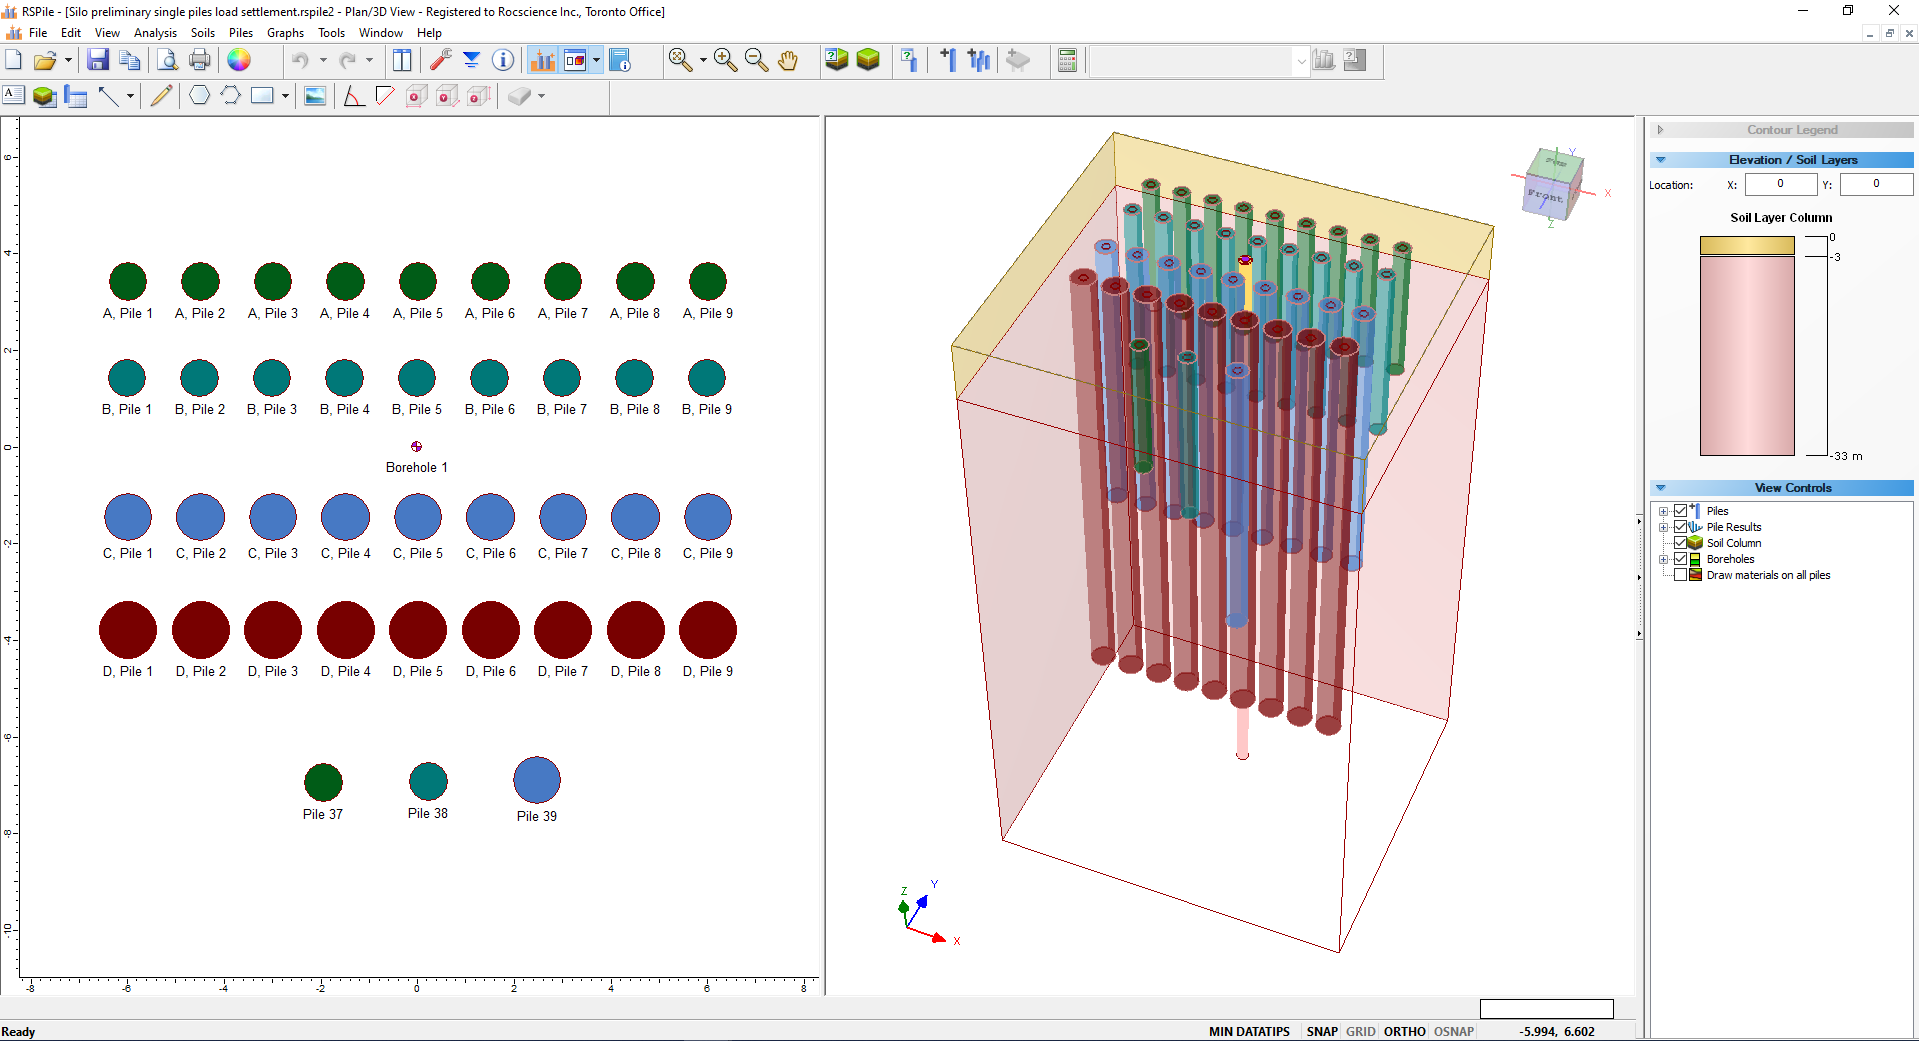
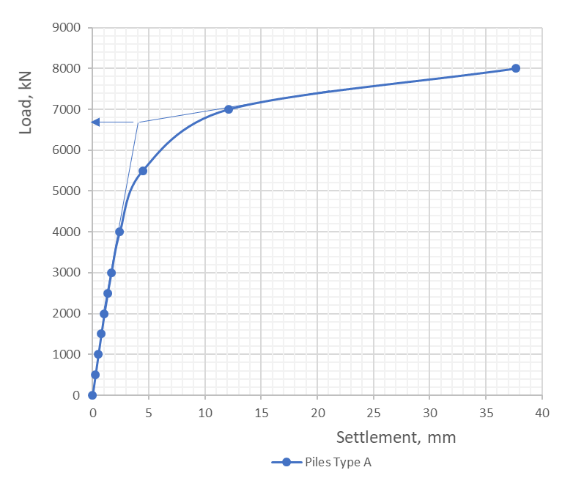
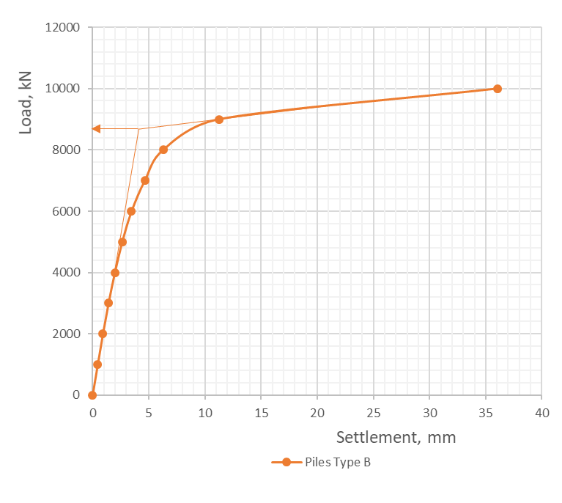
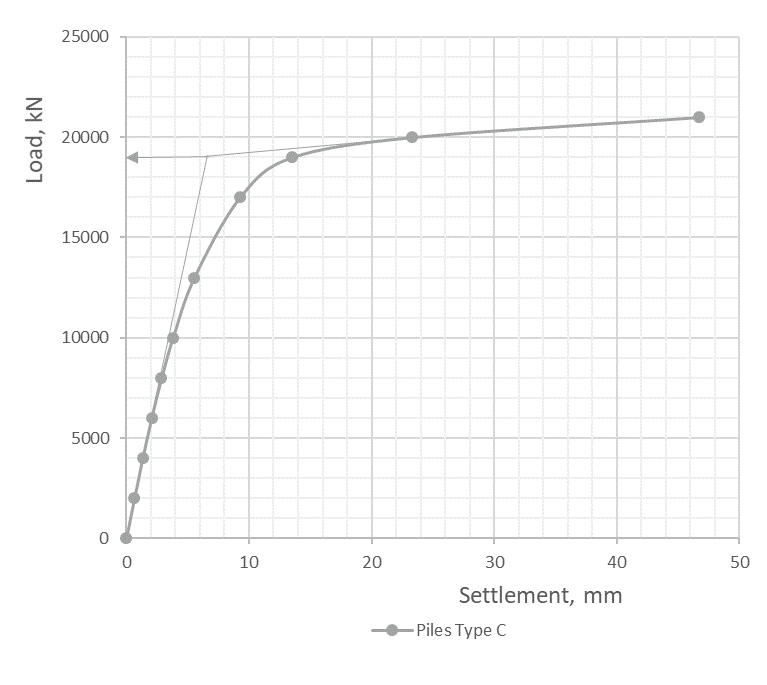
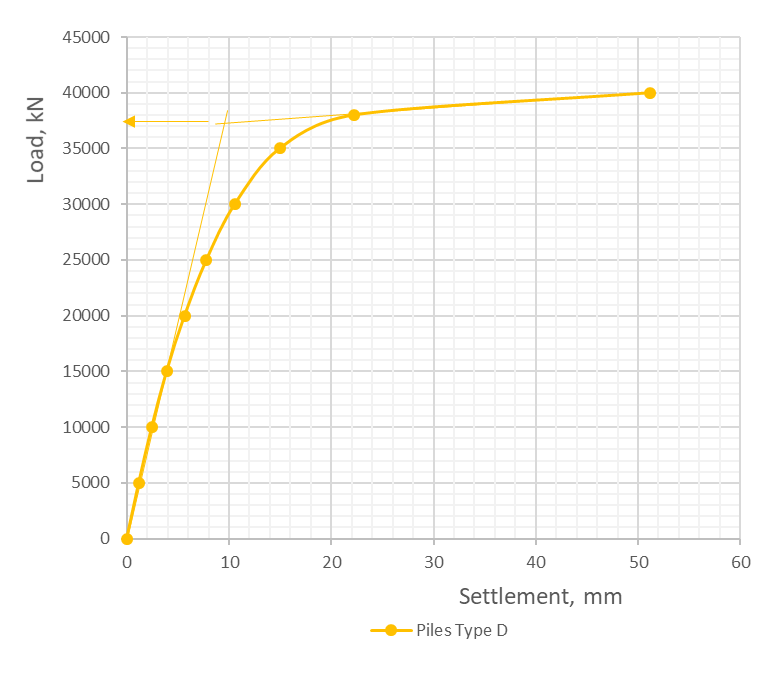
As can be seen, nine load steps were used to calculate the load settlement curves, and the last three piles at the bottom were added to smoothen the curves further by adding intermediate points. The resulting load settlement curves for each pile type are displayed in Figure 6, Figure 7, Figure 8, and Figure 9.
The analysis conducted on the final pile layout resulted in actions and displacements on the four piles: 1, 9, 25, and 41, as shown in Figure 10.
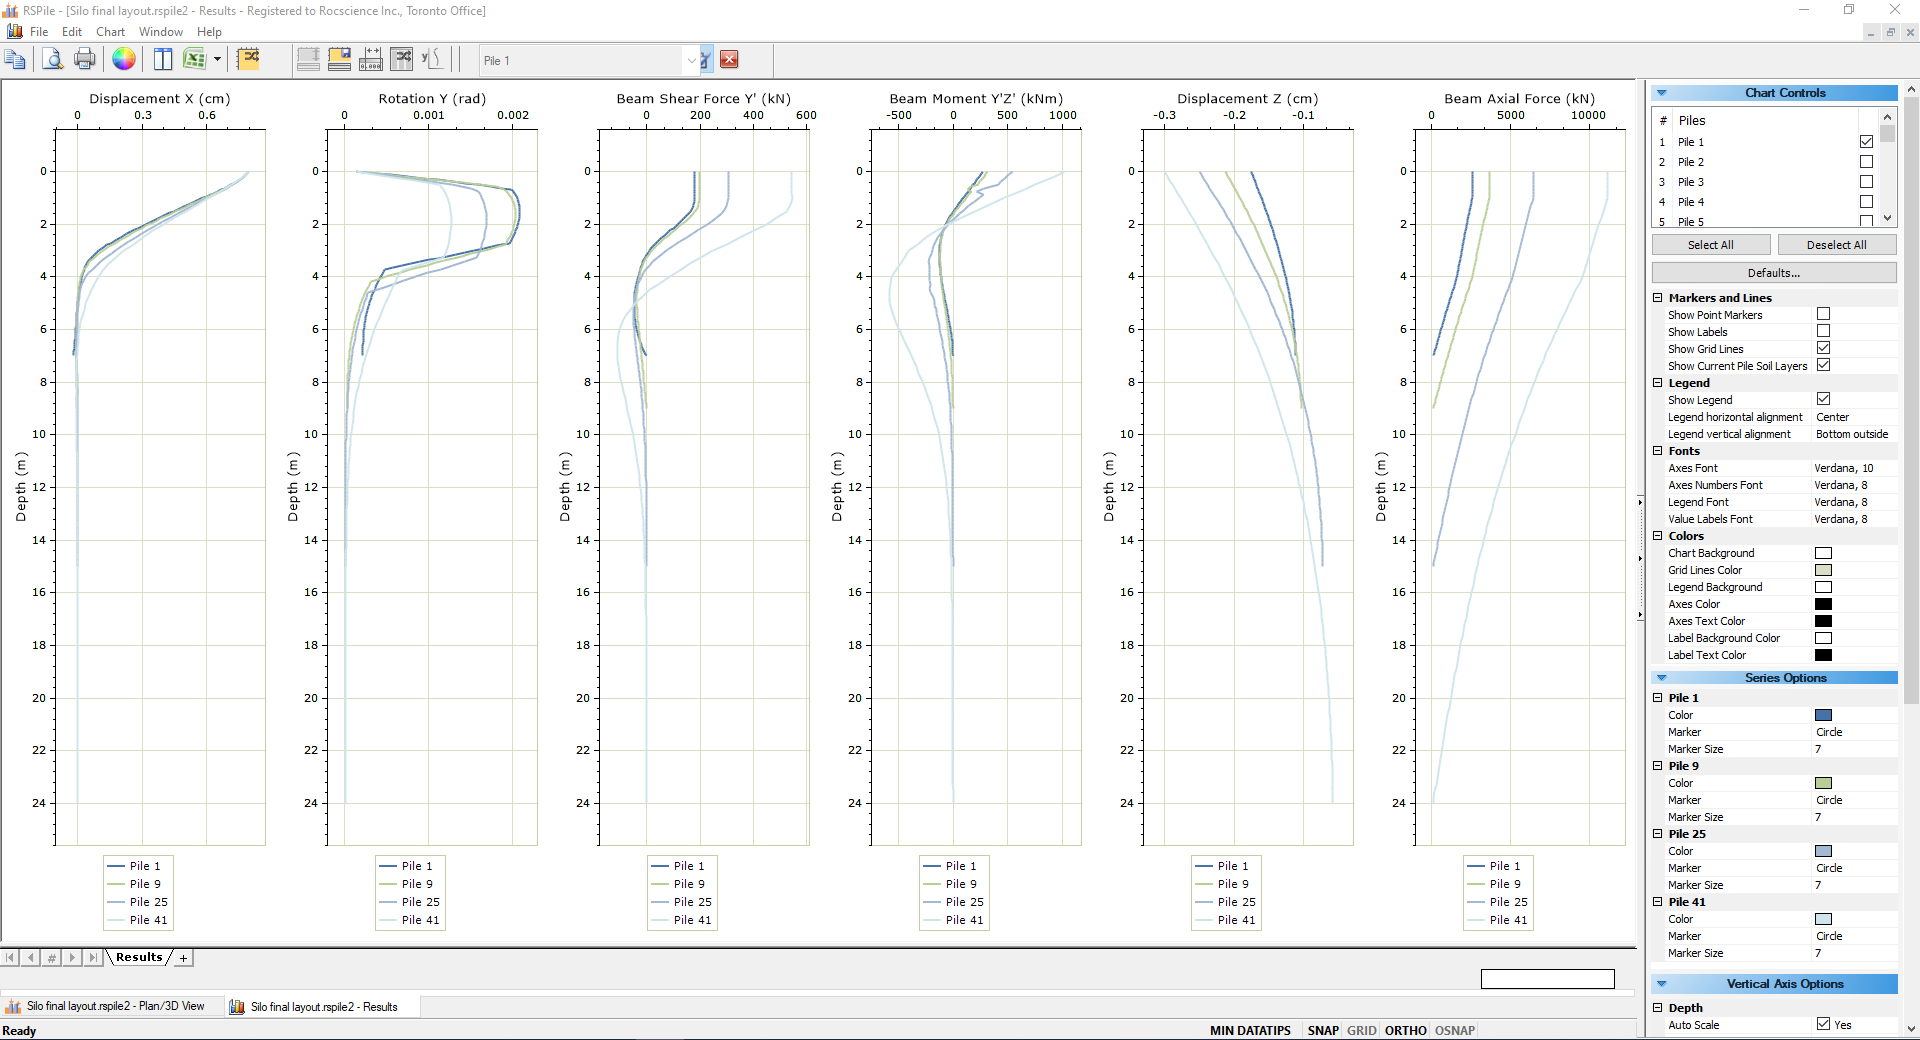
As can be seen, loads on the heads of the four piles were 2583 kN, 3658 kN, 6430 kN, and 11148 kN, with a factor of safety of 2.58, 2.38, 2.95, and 3.37 for pile types A, B, C, and D, respectively.
--
Published Sep 16, 2019