3D Slope Stability Analysis of an Open Pit Mine in Minas Gerais, Brazil
By Thiago Bretas and Felipe Vilela, BVP Engenharia.
Two-dimensional (2D) limit equilibrium analysis is the most common method of slope stability analysis in geotechnical engineering practice. That’s not surprising given that the method is relatively easy to understand, has low computation needs, and requires minimum material input. However, 2D analysis is limited to 2D cross-sections and therefore cannot model complex failure mechanisms or complex geometries in which it is difficult to select a typical 2D section.
Advancements in computing performance and user interfaces, however, are facilitating a shift toward the routine use of three-dimensional (3D) slope stability analysis. 3D limit equilibrium analysis extends the 2D method of slices to a 3D method of columns in which force and moment equilibrium are solved in two orthogonal directions. This enables failures to be calculated in any direction such that you’re solving a 3D problem with a 3D solution. The outcome is a more realistic analysis that is therefore more reliable and economic.
This article presents a 3D limit equilibrium slope stability analysis of an open pit mine located in the Iron Quadrangle in Minas Gerais, Brazil. The analysis was performed with Rocscience Slide3 using an import of a geomechanical model designed and created by BVP Engenharia using Seequent Leapfrog. For comparison, the paper also presents a 2D analysis of a section of the 3D model using Rocscience Slide2 functionality integrated in Slide3. Both analyses demonstrate the ease and speed with which Slide3 and Slide2 can model and analyze even the most complex 3D geologic structures.
The Site
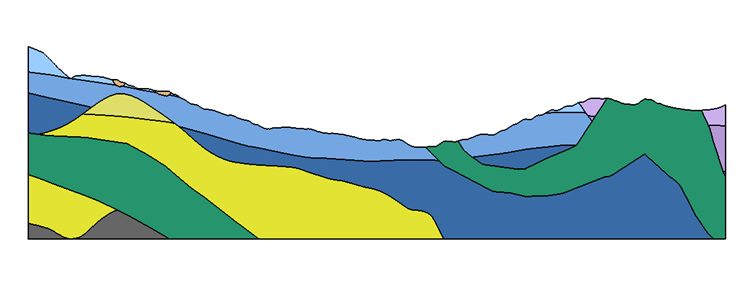
The geology of the region where the mine is located was mapped by several geologists starting in 1946 and became a strategic area for Brazilian iron and gold production. Four types of iron formation are found in the area: itabirite, dolomitic itabirite, amphibolite itabirite, and compact hematite. In 1969, the geology of the area was divided into the Moeda and Batatal formation (Caraça Group), the Cauê and Gandarela formations (Itabira Group), and the Cercadinho formation (Piracicaba Group), all of which belong to Minas Supergroup.
Using field mapping on the open pit mine, the following rocks were identified: dolomitic itabirite, dolomite, itabirite, compact hematite, metabasic intrusion, tertiary deposit, and colluvium. The main structural feature was identified as the compositional banding (Sn) with general direction NNW-SSE and medium to higher dip to ENE. In addition, two deformational structures were noted. The first was the cleavage Sn+1 (ductile-ruptile), with general direction W-E and higher dip to S. The second was a cleavage Sn+2 (ruptile-ductile) with general direction N-S and low dip.
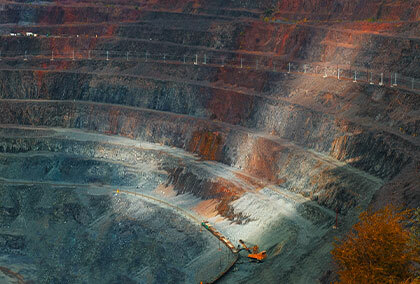
Opening and exploitation of the pit has led to a considerable level of deepening, with a height of 340 meters and an overall slope angle of 38°. It’s important to note that the slopes have higher angles than the dip foliation, such as a small bench width. It is therefore possible to identify instability of local benches in all parts of the pit (inter-ramp), particularly on the west side where wedge sliding on itabirite and metabasic rocks occurs.
The Model
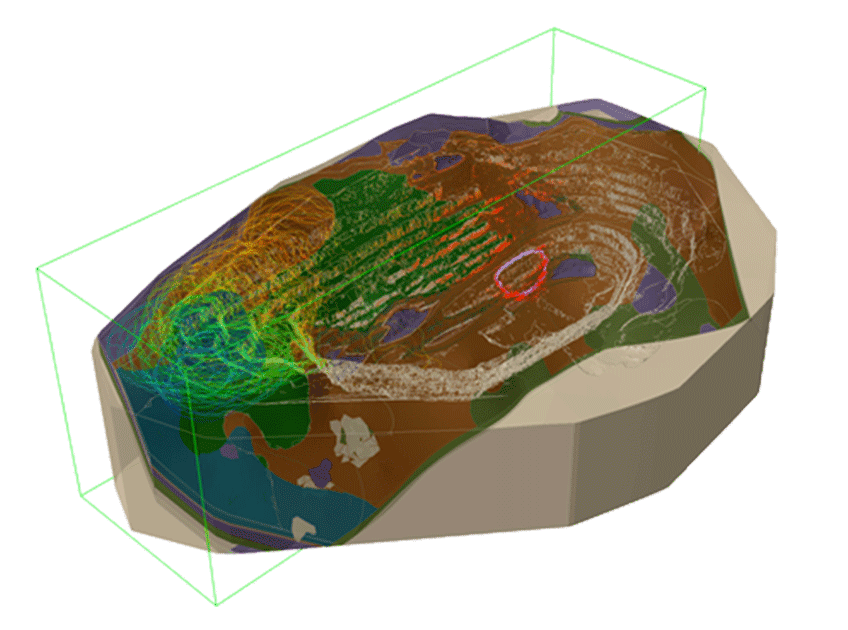
As noted earlier, the model used to perform the analyses in Slide3 was an import of a geomechanical model of an open pit mine designed and created by BVP Engenharia using Seequent Leapfrog.
Four different types of material properties were used in this model: Generalized Hoek-Brown, Mohr-Coulomb, Anisotropic Strength, and Generalized Anisotropic. As shown in Figure 1, the material properties were assigned to different pieces of the geometry.
The 3D Analysis
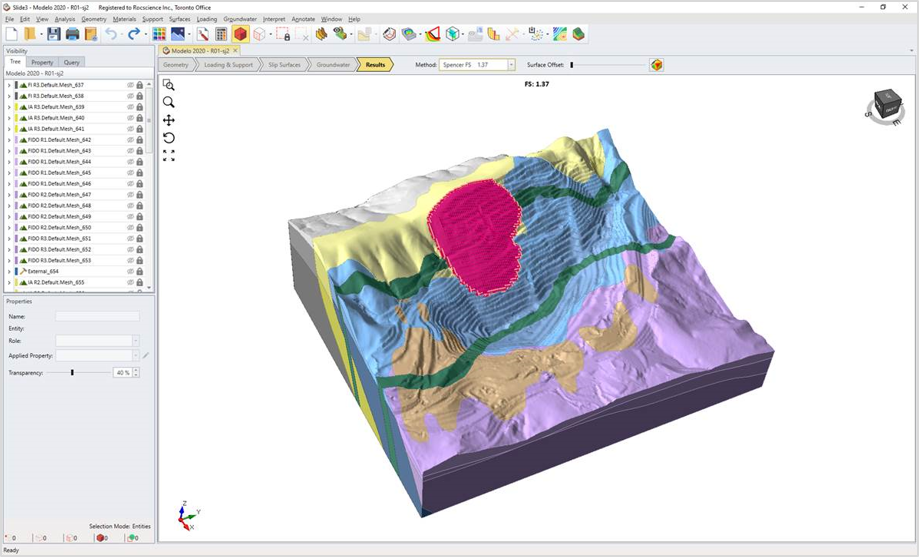
Janbu Simplified and Spencer were selected as the limit equilibrium methods. Janbu Simplified was selected because it gives the lower bound factor of safety value, while Spencer was chosen because it is the most rigorous method.
The ellipsoid slip surface type was selected as well as the Cuckoo Search method with Surface Altering Optimization (SAO) enabled. These methods are designed to find the best critical slip surface and are unique to Slide3.
The analysis using the Janbu Simplified method gave a factor of safety of 1.331 while the factor of safety of the Spencer method was 1.37 (Figure 2).
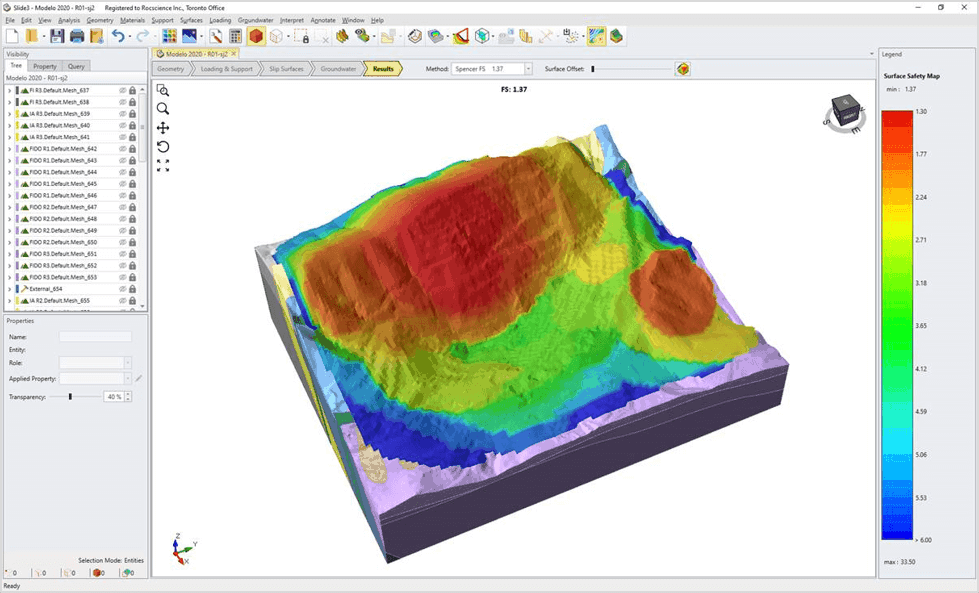
Looking at the contour of the friction angle for the critical slip surface shows that the difference in the factors of safety is explained by the passing of the critical slip surface through different layers of materials with different friction angles.
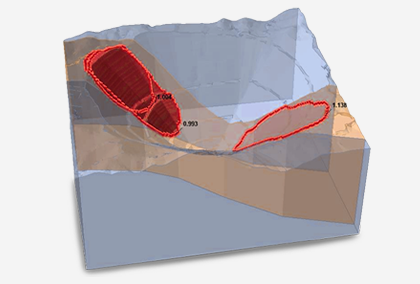
As shown in Figure 3 below, the Safety Map in Slide3 shows the critical and safe regions based on the computed factors of safety. The critical slip surface that the analysis found is part of this region.
The 2D Analysis
For comparison purposes, a 2D section of the 3D model was created in Slide3 using the Slide2 Section Creator. A 2D limit equilibrium analysis was then performed on the slice using the built-in Slide2 engine. The resulting global minimum surface and minimum factor of safety were then overlaid on the 3D model for comparison.
Results of the 2D analysis can also be seen in Slide2 by accessing the Slide2 Interpreter directly from Slide3 (Analysis > Slide2 Integration > Open Slide2 Interpret).
For the 2D analysis, the Simplified Janbu method gave a factor of safety of 1.2 while the Spencer method gave 1.24. When comparing 2D and 3D results, we can see that the 3D results are about 10% higher. This comparison allows us to validate the findings.
Conclusion
When the geometry being analyzed is inherently 3D, as in the case of an open pit mine with a complex geological structure, a 2D approach to modeling and analysis is not sufficient. In other words, a 3D problem requires a 3D solution. As demonstrated by this paper, software programs like Rocscience Slide3 and Slide2 make it possible to conduct 3D limit equilibrium analyses more realistically and efficiently but also as a matter of routine.