30+ years of DIPS – The Development Continues
Long before the powerful stereographic projection software that it is today, DIPS was initially known as ‘StdPlot’. The program was renamed DIPS - an acronym for Data Interpretation using Projected Stereonets, based on its core functionality.
Let’s have a look at the evolution of the software over the years.
1988 – 1999 – The DOS Days (v1-v4)
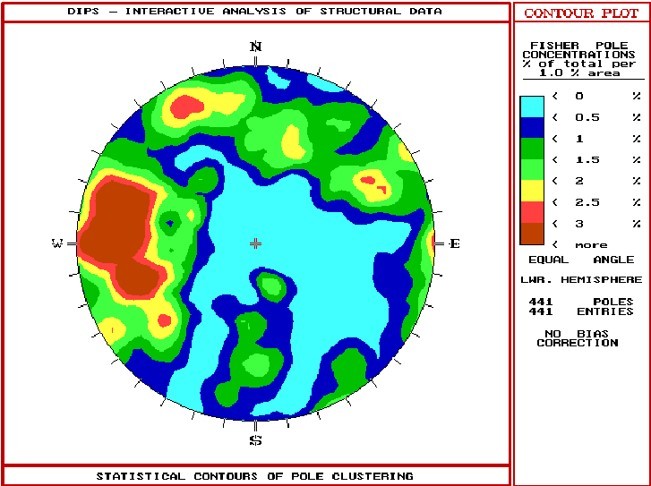
DIPS was developed in 1988 based on the thesis by Dr. Mark Diederichs’ on "An interactive graphical approach to the analysis of orientation based data" and was the first stereonet software for rock engineering, designed for the IBM PC and was a big leap forward from the manual pencil, onion skin paper, and thumbtack! The software was not only capable of numerous applications but was designed for both the novice as well as an experienced user. The many computational features available to users included statistical contouring of orientation clustering, mean orientation and confidence calculation, cluster variability, and qualitative and quantitative feature attribute analysis.
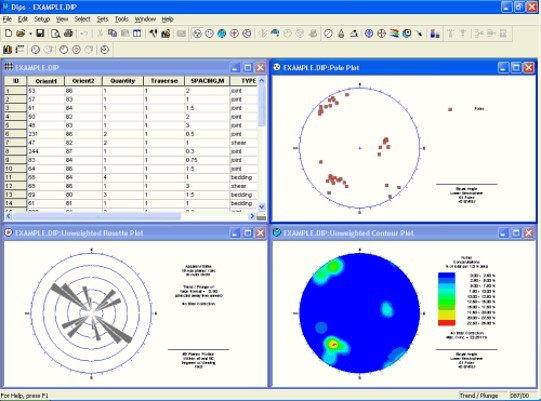
1999 – 2012 – DIPS for Windows OS (v5)
In 1999, DIPS was revamped and relaunched to run on Microsoft Windows OS. The program was optimized to handle data input via a grid, modelled after Microsoft Excel versus the earlier DOS version that would only accept a user-defined text file.
During this period, all the DOS functionalities were also made available to the Windows version that included scatter plots, contour plots, rosette plots, sets, traverses, oriented core analysis, quantitative and qualitative attribute data at each pole, histograms of data attributes, daylight envelopes for sliding analyses, friction circles.
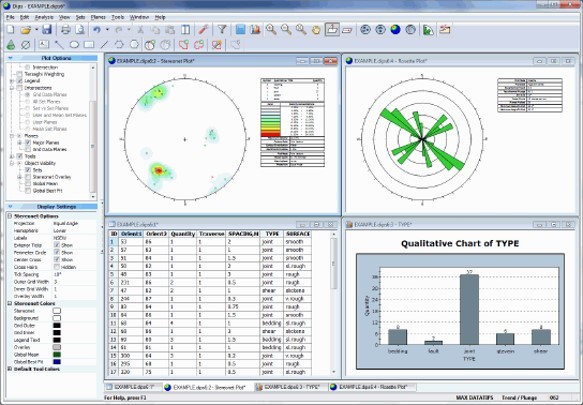
2012 – 2015 – Kinematic Analysis Toolkit (v6)
With the introduction of the Kinematic Analysis toolkit in DIPS, users now could easily analyze Planar Sliding, Wedge Sliding, and Toppling failure. Exporting of analysis results into an Excel file as well as comprehensive intersection plotting options was also made available to users in this version.
2015 – 2020 – 3D Sterosphere (v7)
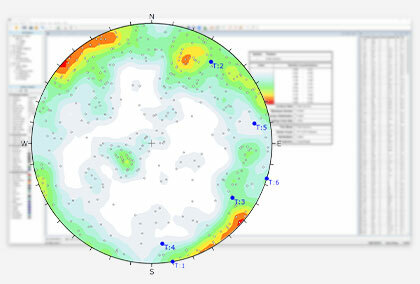
In version 7 of DIPS, 3D Sterosphere, as well as Curved Borehole Analysis, was made available to the users; and the Kinematic Sensitivity Analysis allowed users to create Sensitivity plots of slope dip, dip direction, lateral limits, for planar sliding, wedge sliding, and toppling analyses. Users could also use DIPS to perform Joint spacing analysis, RQD analysis, Joint Frequency analysis from this version on.
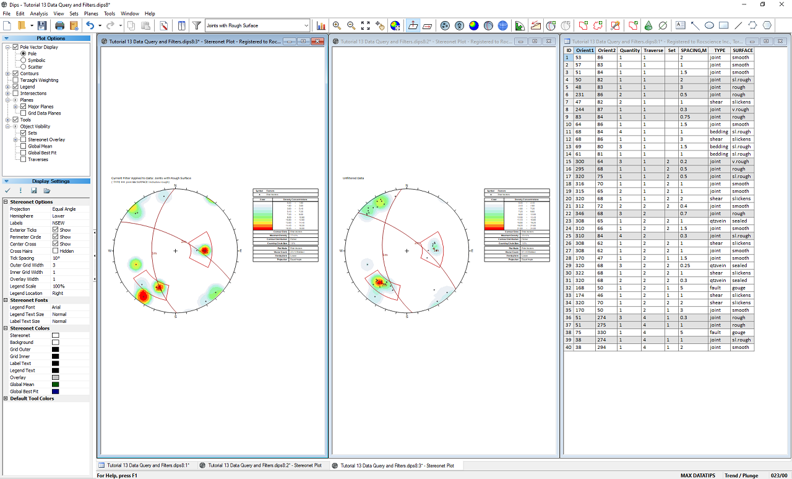
2020 – DIPS M+ - Dynamic Data Filter
The first Maintenance+ update of DIPS saw the addition of the Dynamic Data Filter. Users could now look at subsets of any dataset, apply filters to any view and analyses type as well as apply different filters in multiple open views. The Kinematic Sensitivity Analysis was also enhanced with an option to perform Set vs. Set analyses. Preset 2D Stereonet view templates were also made available to users in this release.
2021 - DIPS in 2021 – DIPS Import Wizard
April 2021 will see a new DIPS Import Wizard. With these features, users will easily be able to import any columnized Excel data into DIPS Traverse Information and Grid Data, append or overwrite imported data to existing DIPS document. The versatile import settings for import of generalized column, row, and the sheet would be able to format over 1 or more Excel files at a time. Users will also be able to save and manage import settings as a template to quickly import Excel data of the same format.
Learn more about the new features coming to DIPS.