13 - Automate Probabilistic Analysis
1.0 Introduction
The Automate Compute option helps users quickly generate results for several SWedge analysis cases at a time by reading in various model inputs from Excel. In this tutorial, we will familiarize you with the Automate Compute feature by automating the computation of 13 Probabilistic analysis cases, each case with 10,000 samples (i.e., 13 x 10,000 = 130,000 wedges).
Topics Covered in this Tutorial:
- Probabilistic Analysis SWedge Model
- Input Excel File Format
- Pre-processing Input Excel File for Bench Analysis
- Adding Input Excel File(s) to Automate Compute File Queue
- Output SWedge Automate Compute Results File
Finished Product:
The finished products of this tutorial can be found in the Tutorial 13 Automate Compute - Probabilistic Analysis folder, located in the Examples > Tutorials folder in your SWedge installation folder. Inside, you will find:
- Tutorial 13 Automate Compute - Probabilistic_base file.swd7 SWedge model file setup for automation
- Tutorial 13 Automate Compute - Probabilistic_inputs.xlsx Excel input file
- Tutorial 13 Automate Compute - Probabilistic_inputs folder containing the computed results files
- Tutorial 13 Automate Compute - Probabilistic_post-process.xlsx Excel file with all raw combined results data, Excel formula computations, and Excel graph
2.0 Creating a New File
- If you have not already done so, run the SWedge program by double-clicking the SWedge icon in your installation folder or by selecting Programs > Rocscience > SWedge > SWedge in the Windows Start menu.
When the program starts, a default model is automatically created. If you do NOT see a model on your screen:
- Select: File > New

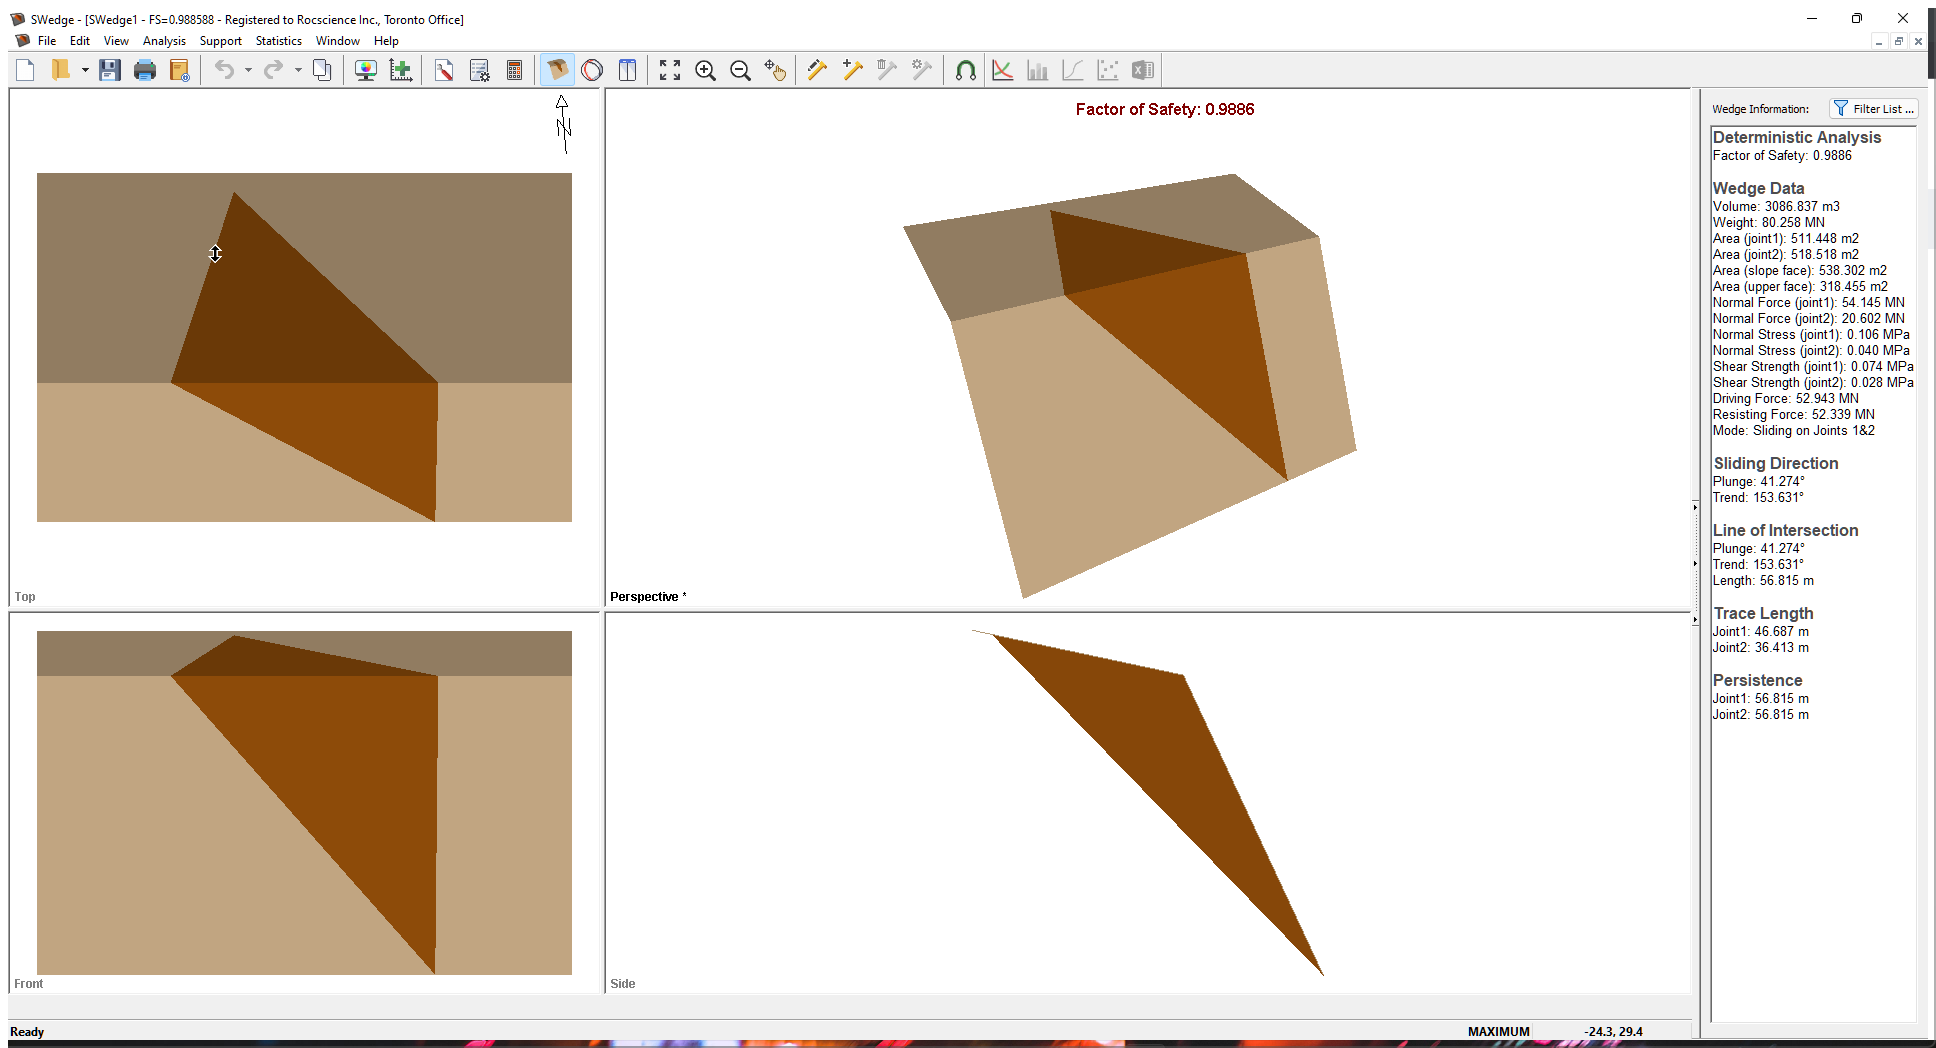
Whenever a new file is created, the default input data forms valid slope geometry, as shown in the image below.
If the SWedge application window is not already maximized, maximize it now so that the full screen is available for viewing the model.
Before we are ready to run Automate Compute, we must first set up the model environment in the following dialogs:
- Project Settings
- Input Data
- Scale Wedge
3.0 Project Settings
First, set the model Units, Analysis Type, and Block Shape.
- Select Project Settings
 from the Analysis menu to open the Project Settings dialog.
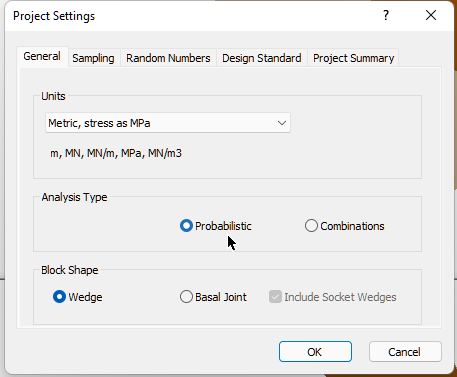
 - Set the Units = Metric, stress as MPa
- Set the Analysis Type = Probabilistic
- Set the Block Shape = Wedge
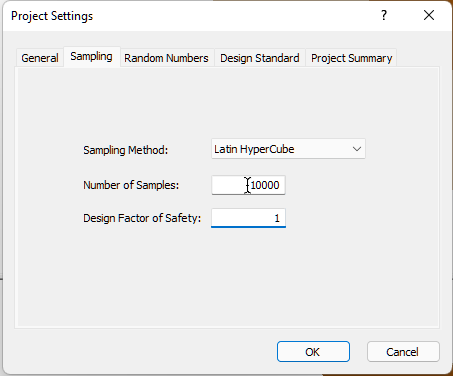
- Set the Number of Samples = 10000
- Select OK to close the dialog.
4.0 Input Data
Next, set the optional input data.
- Select Input Data
 from the Analysis menu to open the Probabilistic Input Data dialog.
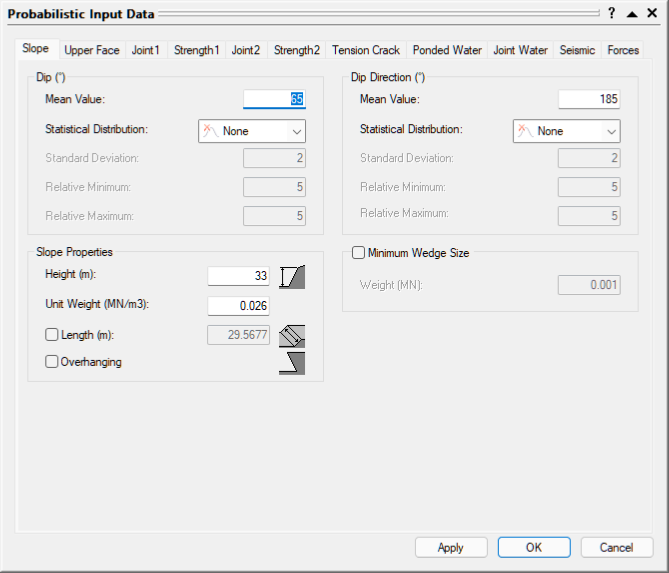
 - Navigate to the Slope page.
Keep all the Statistical Distributions = None and check box controls in the default state. Keep in mind that the following are required input parameters that have to be specified later on in the Input Excel File:- Slope Dip Mean
- Slope Dip Direction Mean
- Slope Height
- Rock Unit Weight
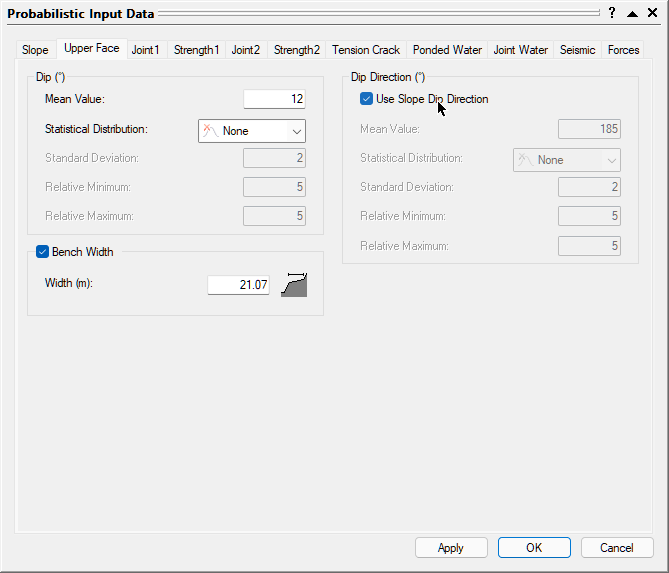
- Open the Upper Face tab.
- Check the Bench Width check box control.
- Check the Use Slope Dip Direction check box control.
- Keep all the Statistical Distributions = None.
- Upper Face Dip Mean
- Bench Width
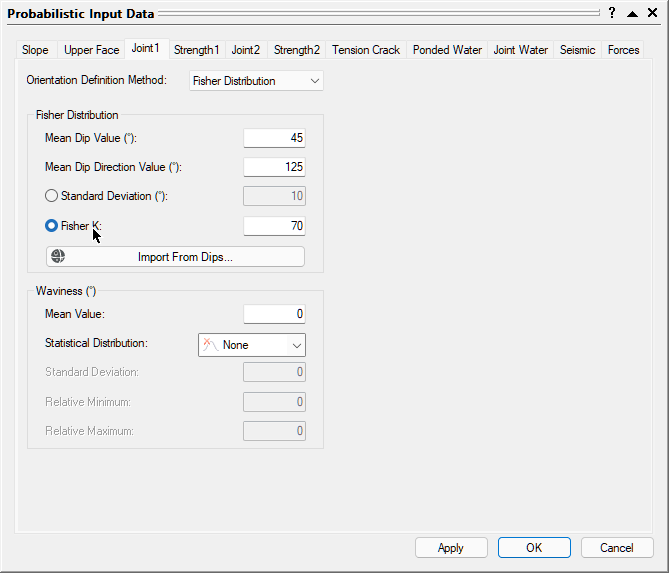
- Open the Joint 1 tab.
- Set the Orientation Definition Method = Fisher Distribution.
- Toggle the radio control to Fisher K.
- Keep Waviness Statistical Distributions = None.
- Joint 1 Dip Mean
- Joint 1 Dip Direction
- Joint 1 Fisher K
- Joint 1 Waviness Mean
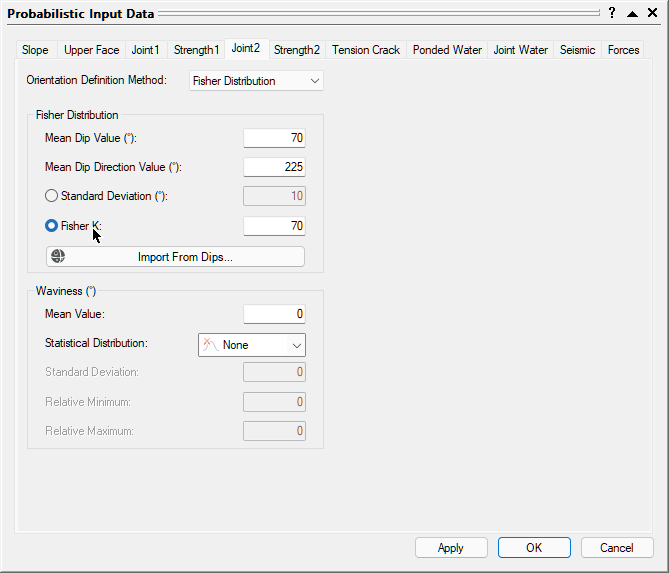
- Open the Joint2 tab.
- Set the Orientation Definition Method = Fisher Distribution.
- Toggle the radio control to Fisher K.
- Keep Waviness Statistical Distributions = None.
- Joint 2 Dip Mean
- Joint 2 Dip Direction
- Joint 2 Fisher K
- Joint 2 Waviness Mean
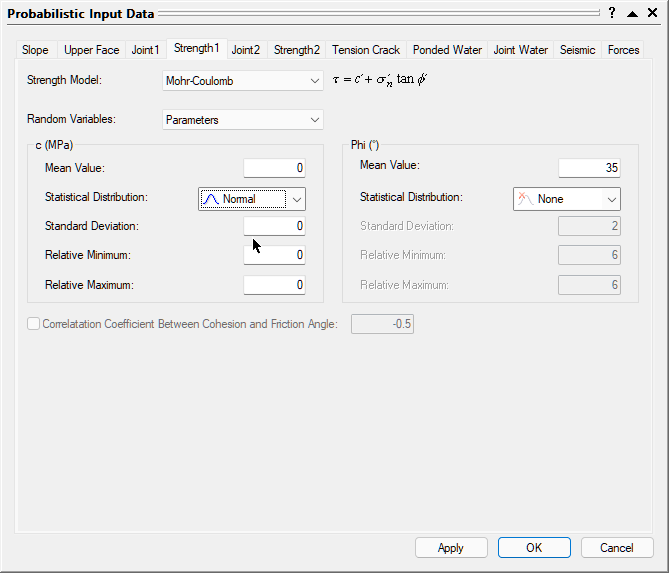
- Open the Strength1 tab.
- Set the Strength Model = Mohr-Coulomb.
- Set the Random Variables = Parameters.
- Set the Cohesion Statistical Distribution = Normal
- Keep the friction Angle Statistical Distribution = None.
- Joint 1 Cohesion Mean, Standard Deviation, Relative Minimum, and Relative Maximum
- Joint 1 Friction Angle Mean
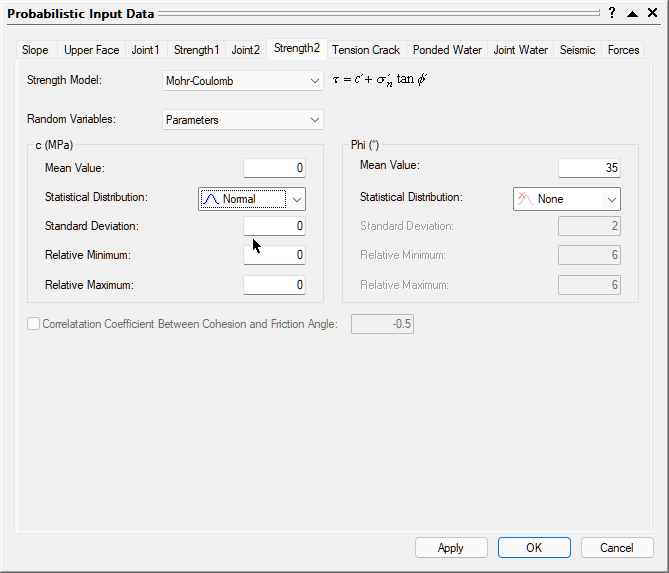
- Open the Strength2 tab.
- Set the Strength Model = Mohr-Coulomb.
- Set the Random Variables = Parameters.
- Set the Cohesion Statistical Distribution = Normal
- Keep the friction Angle Statistical Distribution = None.
- Joint 2 Cohesion Mean, Standard Deviation, Relative Minimum, and Relative Maximum
- Joint 2 Friction Angle Mean
- We will not apply Tension Crack, Ponded Water, Joint Water, Seismic Force, or External Forces.
- Select OK to close the dialog.
Keep in mind that the following are required input parameters that have to be specified later on in the Input Excel File:
Keep in mind that the following are required input parameters that have to be specified later on in the Input Excel File:
Keep in mind that the following are required input parameters that have to be specified later on in the Input Excel File:
Keep in mind that the following are required input parameters that have to be specified later on in the Input Excel File:
Keep in mind that the following are required input parameters that have to be specified later on in the Input Excel File:
5.0 Input Excel File
Now, let's take a look at the structure of the input Excel file.
- Obtain the SWedge Probabilistic Excel Template by selecting Analysis > Automate Compute > Probabilistic Excel Template .
- Create a folder called Tutorial 13 Automate Compute - Probabilistic.
- Navigate to the SLOPE worksheet.
- Under the Wedge ID column, provide the names of the wedges. We will name them according to Bench Face Angle (i.e., Slope Dip). Each row in the input Excel file represents one Probabilistic Analysis case in SWedge. We will run a case for each Bench Face Angle ranging from 30 to 90 degrees, by 5-degree increments.
- Enter the following:
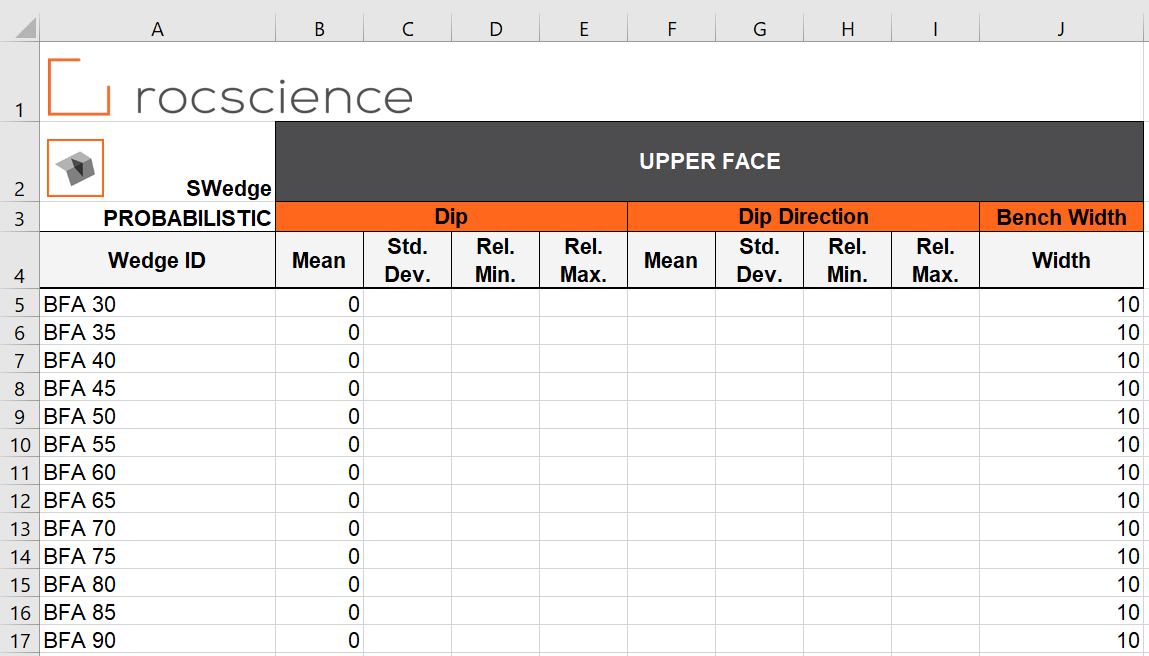
- Navigate to the UPPER FACE worksheet.
- Under the Wedge ID column, provide the names of the wedges.
- Enter the following:
- Navigate to the JOINT 1 worksheet.
- Under the Wedge ID column, provide the names of the wedges.
- Enter the following:
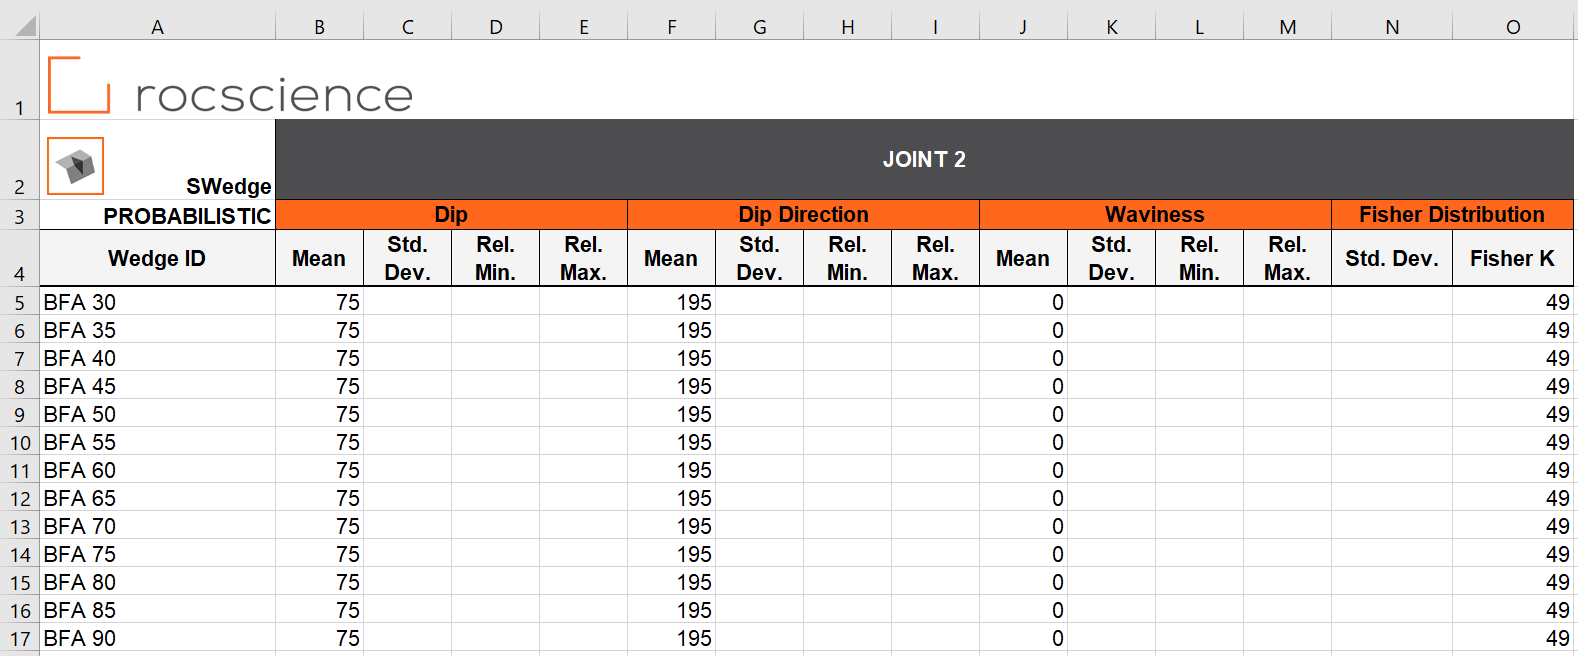
- Navigate to the JOINT 2 worksheet.
- Under the Wedge ID column, provide the names of the wedges.
- Enter the following:
- Navigate to the STRENGTH 1 worksheet.
- Under the Wedge ID column, provide the names of the wedges.
- Enter the following:
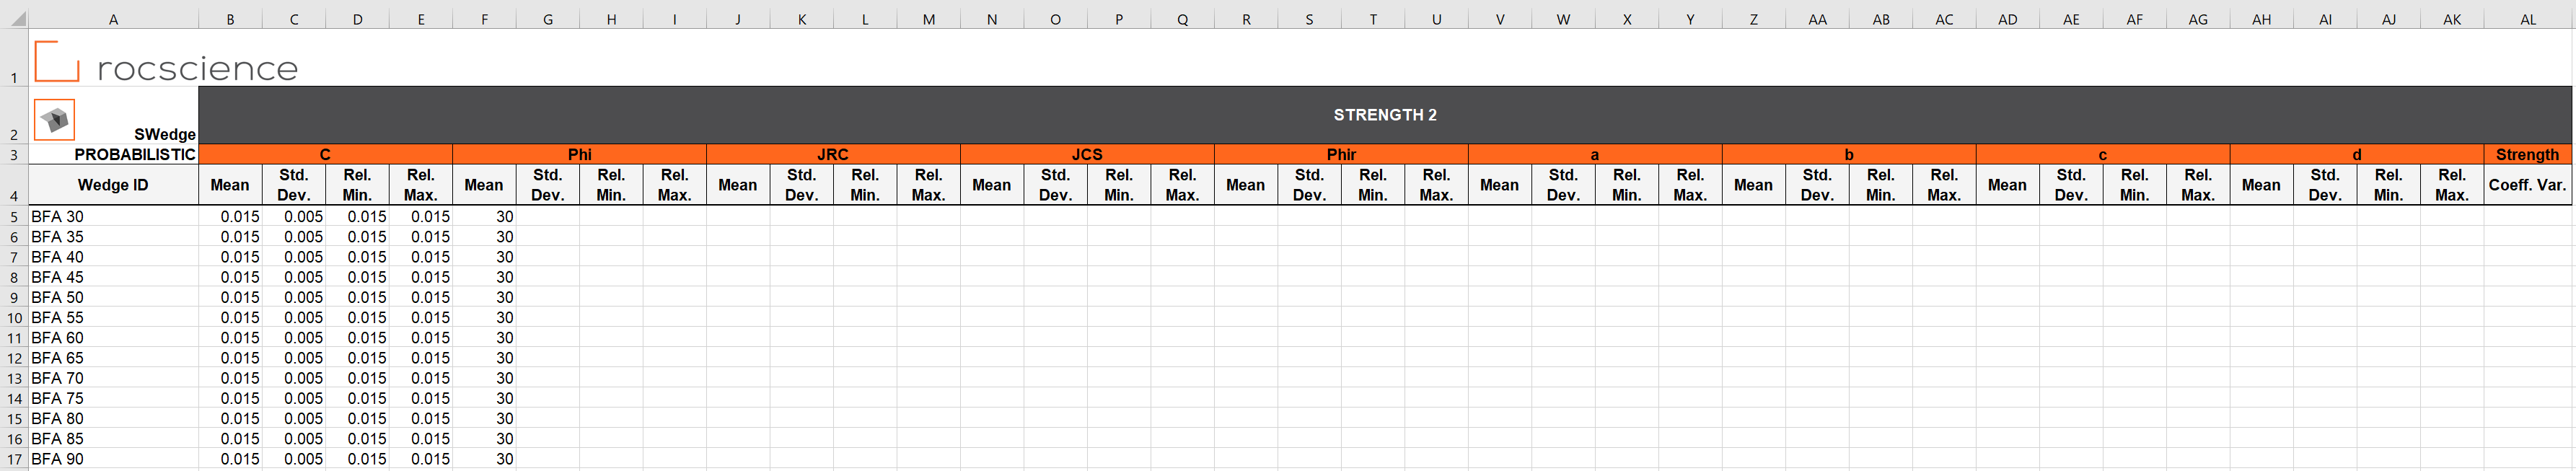
- Navigate to the STRENGTH 2 worksheet.
- Under the Wedge ID column, provide the names of the wedges.
- Enter the following:
- Save the Excel file as Tutorial 13 Automate Compute - Probabilistic_inputs.xlsx to the Tutorial 13 Automate Compute - Probabilistic folder previously created.
A Read-Only Excel workbook titled SWedge Automation Template_Probabilistic.xlsx will be automatically opened (if you have Excel installed on your local machine).
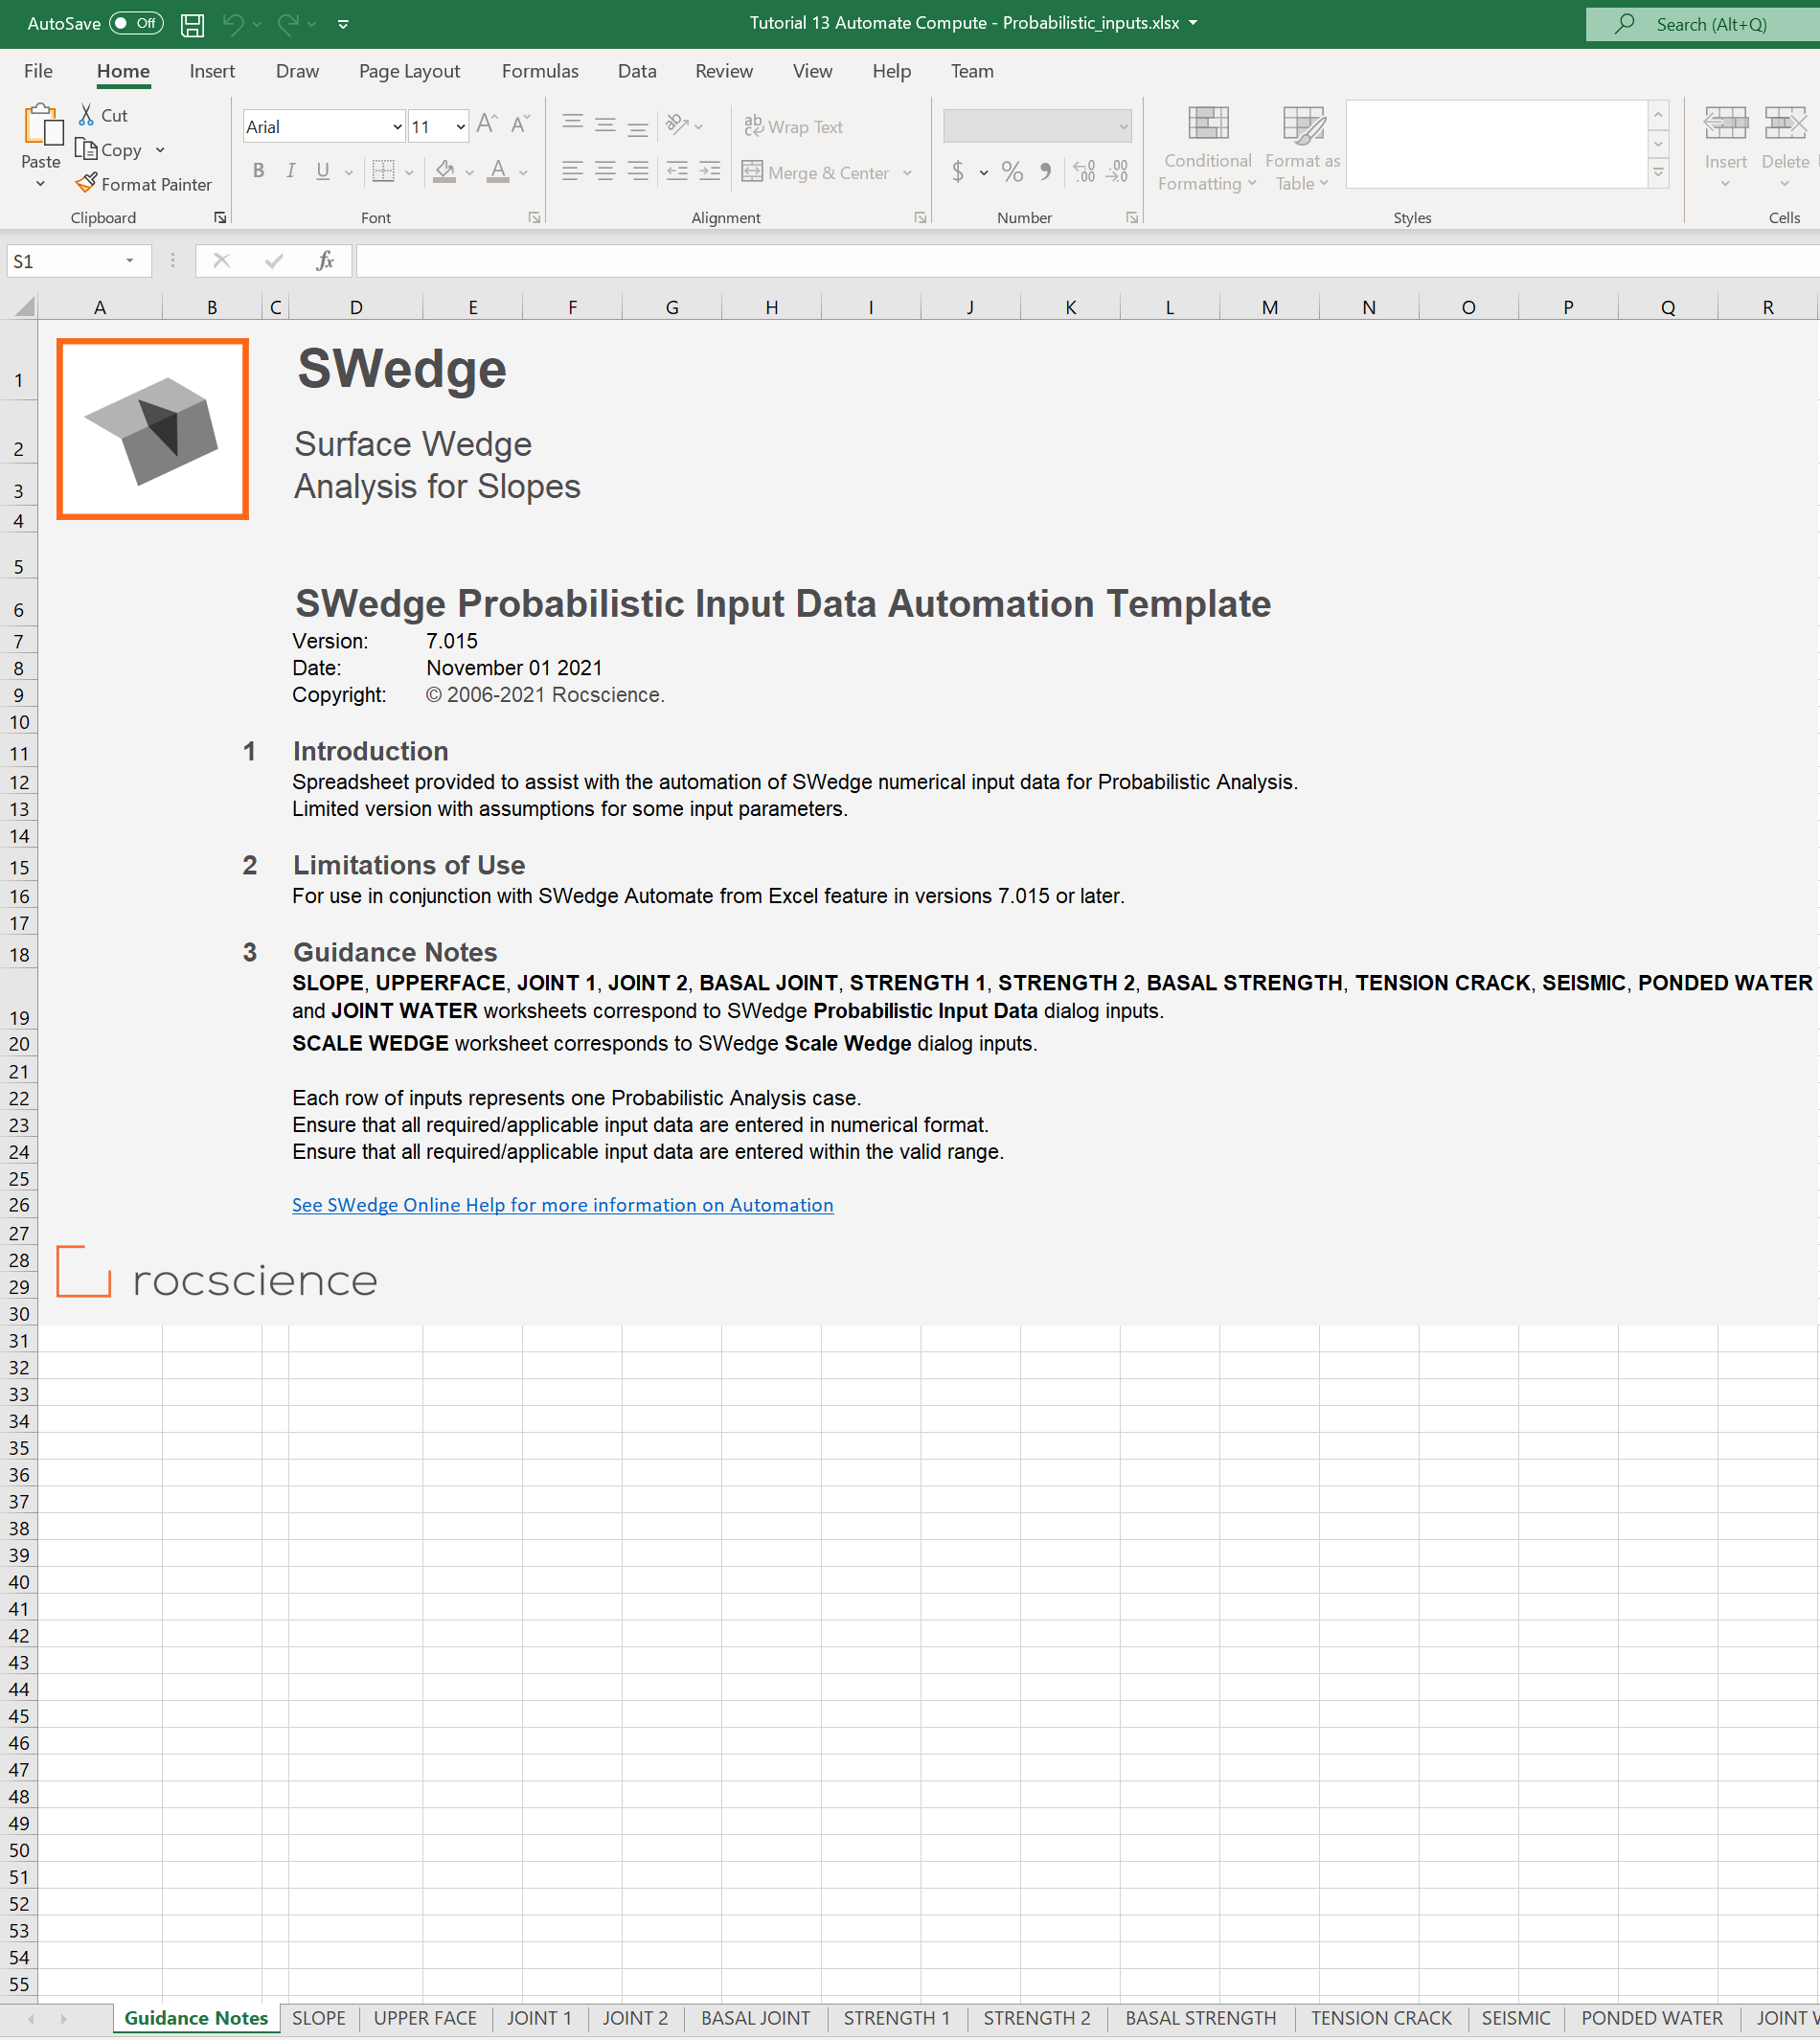
The SWedge Probabilistic Input Data Automation Template Excel workbook and worksheets are protected to prevent any accidental modification to the tab structure and headers. The input Excel template contains 13 worksheets for inputting numerical parameters for automation.
Wedge ID | Slope | Rock Properties | ||
Dip | Dip Direction | Height | Unit Weight | |
Mean | Mean | |||
BFA 30 | 30 | 150 | 24 | 0.026 |
BFA 35 | 35 | 150 | 24 | 0.026 |
BFA 40 | 40 | 150 | 24 | 0.026 |
... | ... | ... | ... | ... |
BFA 90 | 90 | 150 | 24 | 0.026 |
The SLOPE worksheet should look like this:
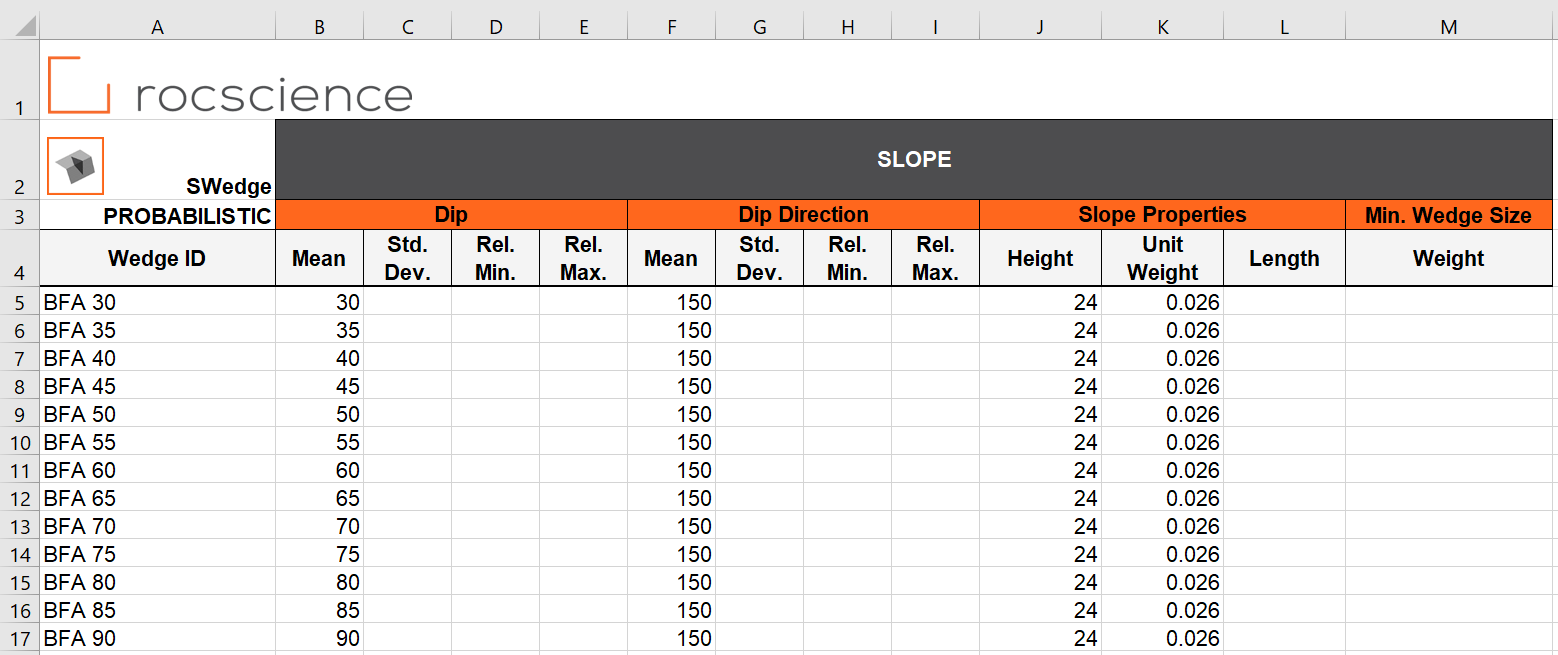
TIP: Use Formulas or Auto Fill feature in Excel to quickly populate the Wedge IDs.
Wedge ID | Upper Face | Bench Width |
Dip | Width | |
Mean | ||
BFA 30 | 0 | 10 |
BFA 35 | 0 | 10 |
BFA 40 | 0 | 10 |
... | ... | ... |
BFA 90 | 0 | 10 |
The UPPER FACE worksheet should look like this:
Wedge ID | Joint 1 | |||
Dip | Dip Direction | Waviness | Fisher | |
Mean | Mean | Mean | Fisher K | |
BFA 30 | 55 | 135 | 0 | 49 |
BFA 35 | 55 | 135 | 0 | 49 |
BFA 40 | 55 | 135 | 0 | 49 |
... | ... | ... | ... | ... |
BFA 90 | 55 | 135 | 0 | 49 |
The JOINT 1 worksheet should look like this:

Wedge ID | Joint 2 | |||
Dip | Dip Direction | Waviness | Fisher | |
Mean | Mean | Mean | Fisher K | |
BFA 30 | 75 | 195 | 0 | 49 |
BFA 35 | 75 | 195 | 0 | 49 |
BFA 40 | 75 | 195 | 0 | 49 |
... | ... | ... | ... | ... |
BFA 90 | 75 | 195 | 0 | 49 |
Wedge ID | Joint 1 | ||||
Cohesion | Friction Angle | ||||
Mean | Std. Dev. | Rel. Min. | Rel. Max. | Mean | |
BFA 30 | 0.015 | 0.005 | 0.015 | 0.015 | 30 |
BFA 35 | 0.015 | 0.005 | 0.015 | 0.015 | 30 |
BFA 40 | 0.015 | 0.005 | 0.015 | 0.015 | 30 |
... | ... | ... | ... | ... | ... |
BFA 90 | 0.015 | 0.005 | 0.015 | 0.015 | 30 |
The STRENGTH 1 worksheet should look like this:

Wedge ID | Joint 2 | ||||
Cohesion | Friction Angle | ||||
Mean | Std. Dev. | Rel. Min. | Rel. Max. | Mean | |
BFA 30 | 0.015 | 0.005 | 0.015 | 0.015 | 30 |
BFA 35 | 0.015 | 0.005 | 0.015 | 0.015 | 30 |
BFA 40 | 0.015 | 0.005 | 0.015 | 0.015 | 30 |
... | ... | ... | ... | ... | ... |
BFA 90 | 0.015 | 0.005 | 0.015 | 0.015 | 30 |
The STRENGTH 2 worksheet should look like this:
We do not need to enter any data in the BASAL JOINT, BASAL STRENGTH, TENSION CRACK, SEISMIC, PONDED WATER, JOINT WATER, or SCALE WEDGE worksheets since those are not applicable.
We are now ready to automate computations in SWedge by reading from the input Excel file.
6.0 Automate from Excel
Return to the SWedge model.
The Automate Compute dialog allows you to add Excel input automation files to the queue, select an output format, and compute the results.
6.1 ADD FILES TO FILE QUEUE
To add multiple files to the File Queue:
- Select Automate from Excel
 from the Analysis menu to open the Automated Compute dialog.
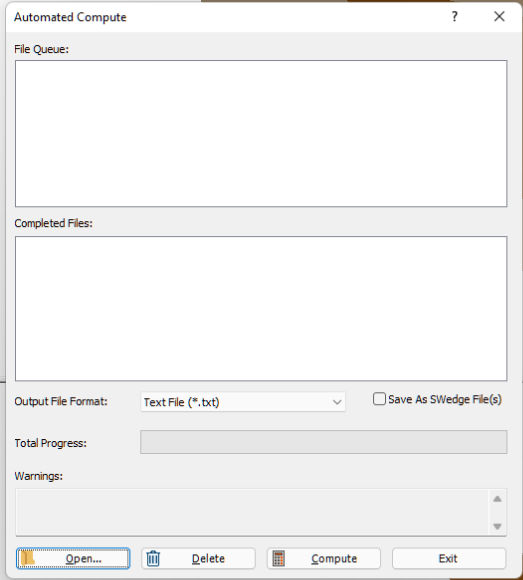
Automate from Excel - Select the Open
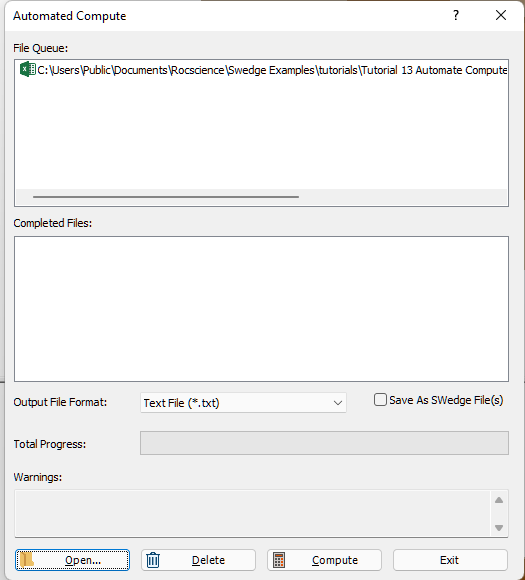
 button to open a standard dialog to choose an Excel input file. Navigate to the Tutorial 13 Automate Compute - Probabilistic folder and select the Tutorial 13 Automate Compute - Probabilistic_inputs.xlsx file.
You will see the Excel input file appear under the File Queue list box.
7.0 Output Result Files
Results files are automatically generated and saved into the same directory as the input Excel file after Automated Compute is complete. Before we run Compute, first ensure that the Output File Format is set to the desired format. Users can select from either Text File or Excel File format.
7.1 TEXT FILE FORMAT
While still in the Automated Compute dialog:
- Set the Output File Format dropdown to Text File.
- Select the Compute button to start the automated computing process.
- When all files have finished computing, select Exit to close the dialog.
The Total Progress can be seen at the bottom of the dialog. When files have finished computing, they will appear in the Completed Files list box.
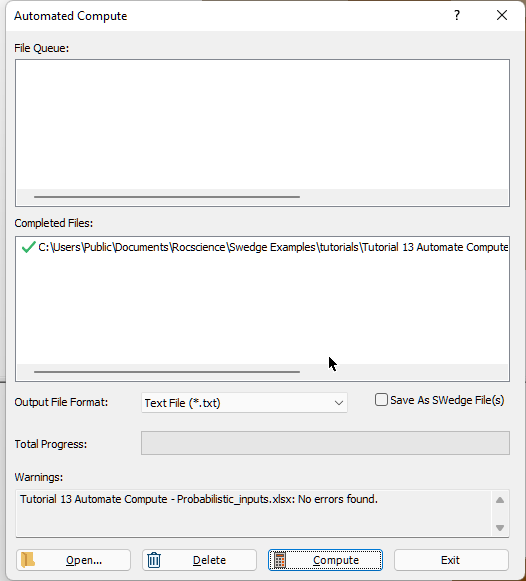
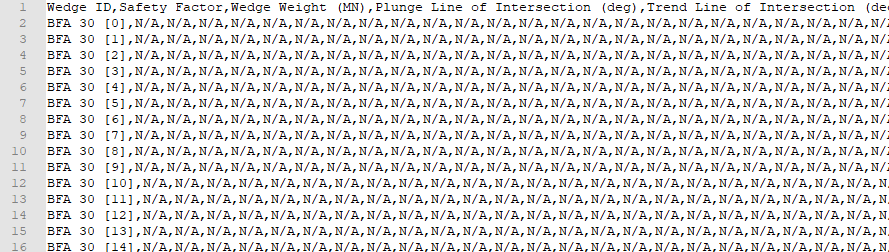
For each input Excel file case, a text file (.txt) containing all results data is generated.
For a Probabilistic Analysis (Tutorial 13 Automate Compute - Probabilistic.xlsx), the results data for each case are output to a separate text file since each case tends to contain hundreds or thousands of wedge samples. Inside each text file, results for all probabilistic wedge samples in the case are outputted following the header row. Each row of data represents one sample wedge. Each data type is separated by a comma (,) for easy parsing.
- Take a look at the ResultsBFA 30[0].txt result file.
Note that a total of 13 files with the same format (i.e., ResultsBFA 30[0].txt, ResultsBFA35[1].txt, ..., ResultsBFA 90[2].txt ) have been created; one file per case.
7.2 EXCEL FILE FORMAT
Now, we will do the same as before, but this time we will generate the results as an Excel output file format.
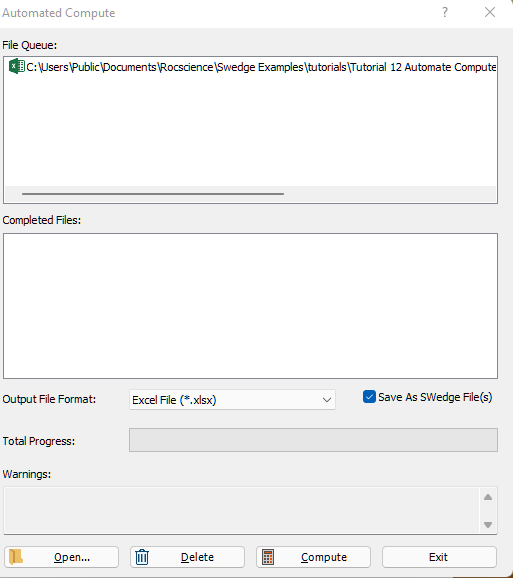
- Select Automate from Excel from the Analysis menu to open the Automated Compute dialog.
- Select the Open button to open a standard dialog to choose an Excel input file.
- Navigate to the Tutorial 13 Automate Compute - Probabilistic folder and select the Tutorial 13 Automate Compute - Probabilistic.xlsx file.
- Set the Output File Format dropdown to Excel File.
- Select the Save As SWedge File(s) checkbox. This will save each automated compute case as an SWedge file
- Select the Compute button to start the automated computing process.
- Since there are already Text File results in the results directory, a popup will appear with the message "Results folder(s) not empty. Duplicated results file(s) will be overwritten. Continue?". Select Yes.
- When all files have finished computing, select Exit to close the dialog.
You will see the Excel input file appear under the File Queue list box.
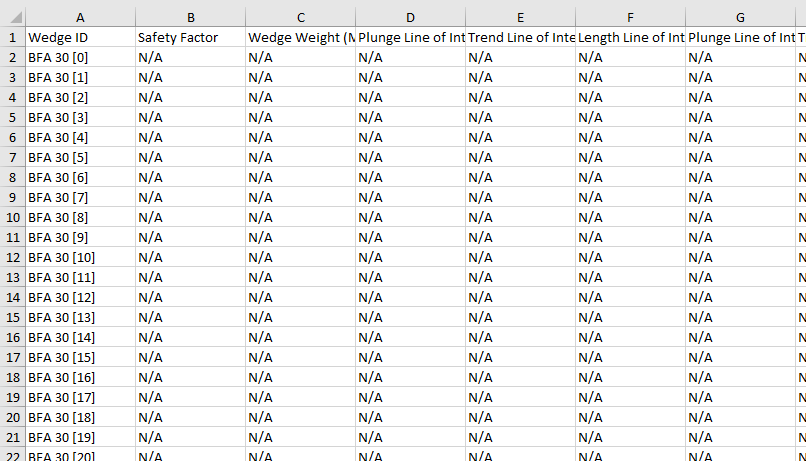
For each input Excel file case, an Excel file (.xlsx) containing all results data is generated.
For a Probabilistic Analysis (Tutorial 13 Automate Compute - Probabilistic.xlsx), the results data for each case are output to a separate Excel file since each case tends to contain hundreds or thousands of wedge samples. Inside each Excel file, results for all probabilistic wedge samples in the case are outputted following the header row. Each row of data represents one sample wedge. Each data type is separated by column.
- Take a look at the ResultsBFA 30[0].xlsx result file.
Note that a total of 13 files with the same format (i.e., ResultsBFA 30[0].xlsx, ResultsBFA35[1].xlsx, ..., ResultsBFA 90[2].xlsx ) have been created; one file per case.
8.0 Error Log
As you may have noticed, an Error Log is also generated for each input Excel file. For each input Excel file, an Error Log text file (Automate Compute Error Log.txt) is generated and saved into the same directory as the output file directories. Always check that the Error Log reports "No errors found" before post-processing the raw results data. If any errors do occur as a result of missing (i.e., blank cells) or invalid inputs, the Error Log will indicate which worksheet(s) and cell(s) are problematic.
9.0 Bench Analysis Using Post-Processed Results Data
For demonstration purposes, we are going to post-process the results generated from Automate Compute in Excel. We want to generate a plot of [SUM(Volume of Wedges Failed) / SUM(Volume of Valid Wedges)] vs. Bench Angle.
- Open a new Excel worksheet.
- Grab the raw data from all Results Excel files.
- Under the Data tab, select Get Data > From File > From Folder.
- Browse for the folder containing the Results Excel files.
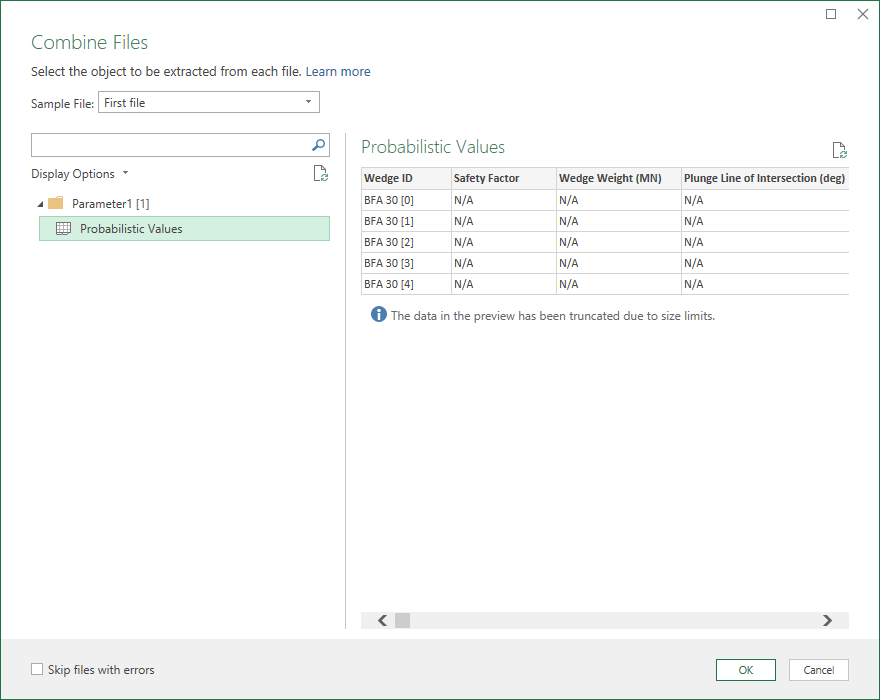
- Select Combine > Combine & Load.
- Select Probabilistic Values and OK to extract the data from each Excel file.
- Wait while Excel runs the background query. The combined data will contain all the computed data.
- Post-process the data in Excel.
- Consider only valid wedges (i.e., Safety Factor is not "N/A")
- Group wedges by Bench Face Angle (i.e., Slope Dip = 30, 35, ..., 90)
- Group wedges by Safe (i.e., Safety Factor >= 1) and Failed (i.e., Safety Factor < 1)
- Sum Weight of Failed Wedges
- Sum Weight of Valid Wedges
- Weight Fraction Failed = Sum Weight of Failed Wedges / Sum Weight of Valid Wedges
- Plot Weight Fraction Failed vs. Bench Face Angle in Excel:
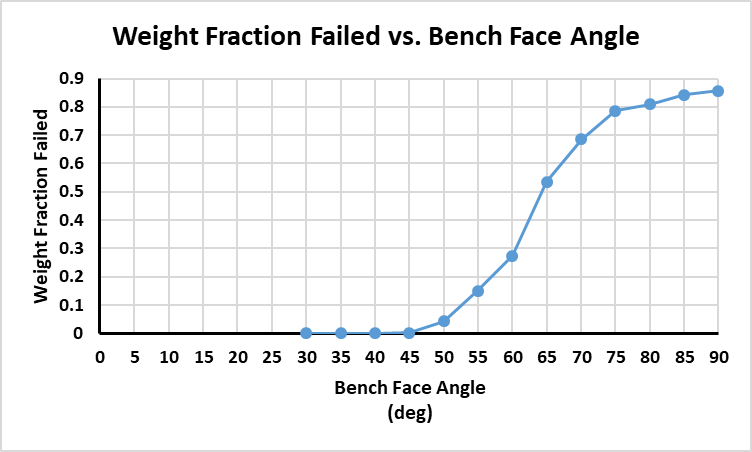
The fraction of failed wedges increases as the Bench Face Angle increases.
This concludes the tutorial.