Sensitivity Analysis Overview
The effect of uncertainty or variability in the values of input parameters can be explored using a Sensitivity Analysis. In sensitivity analysis, model parameters selected by the user, are varied across a range of values and the effect on safety factor observed. This helps to identify the parameters that have the most effect on wedge stability.
The results of a sensitivity analysis are displayed on a sensitivity plot, which plots the safety factor against percent change in the input variable(s), as shown in the figure below.
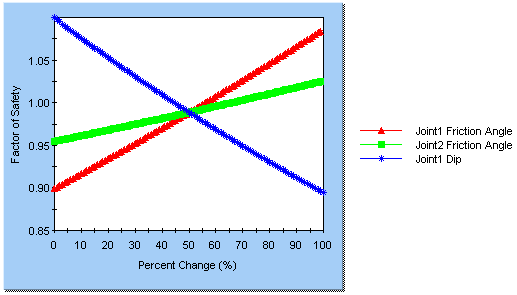
On a sensitivity plot, the gradient of a curve for a parameter indicates the effect that parameter has on the factor of safety. Steeper (rising or falling) curves indicate a greater influence on the factor of safety. A relatively "flat" curve indicates that a variable has little effect on the factor of safety. A completely flat curve indicates that the variable has NO effect on the safety factor (within the specified range of the variable).
To carry out a Sensitivity Analysis with SWedge:
- Select Analysis Type = Deterministic in the Project Settings dialog.
- Select the Sensitivity
 option from the Analysis menu or the toolbar.
 - You will see the Sensitivity Input dialog. Select the first available check box in the dialog. The input data fields beside the check box will be enabled.
- From the drop-list of input variables, select a parameter for which you desire a sensitivity plot (e.g. Joint 1 Friction Angle).
- Using the From and To input edit boxes, enter a range within which you would like the parameter to vary. To assist you in doing so, SWedge automatically displays the Mean value of the parameter (from the main Input Data dialog).
- If you would like sensitivity plots for other parameters, select the next available check box, and repeat steps 4 and 5. When you are done selecting parameters, click OK.
- A Sensitivity Plot will be generated for the selected parameters, as illustrated in the above figure.
Notes:
- A Sensitivity Plot in SWedge is generated by subdividing each variable range (defined by the From and To values in the Sensitivity Input dialog), into 100 intervals, and calculating the safety factor at each value of the variable between the From and To values. If you right-click on the graph and select the Markers option, you will see the actual points used to generate the curve(s).
- Remember that each curve on a Sensitivity Plot is obtained by varying only ONE PARAMETER while keeping all other variables constant (at their mean value).
- The Percent Change (on the horizontal axis of a Sensitivity Plot) is the relative difference between the Minimum value of a variable (0 percent) and the Maximum value of a variable (100 percent), according to the From and To ranges you have entered in the Sensitivity dialog.
- If you are only plotting a single variable on a Sensitivity Plot, then the horizontal axis will be in terms of the actual value of the variable, rather than the Percent Change.
Right-Click Options
Several options are available if you right-click on a Sensitivity Plot. For example:
- You can modify the data in an existing Sensitivity Plot, by right-clicking the mouse in the plot and selecting Update Sensitivity Data. This will display the Sensitivity Input dialog with the current plot variables.
- Select the Chart Properties option to customize the appearance of the plot.
- The Sampler option allows you to graphically determine the coordinates of any points on the Sensitivity Plot curves. For more information, see the discussion of the Sampler for the Cumulative Plot, as the Sensitivity Plot Sampler operates in a similar manner.
Experiment with the different options available in the right-click menu.