Groundwater Seepage Analysis
1.0 Introduction
Groundwater seepage analysis can be analyzed using either water table or pore water pressure grids in Slide3. The objective of this tutorial is to introduce the ability to do a groundwater seepage analysis in Slide3 by way of importing a water pressure grid from RS3. Results are then compared between the seepage method and the water table method.
Finish Product:
All tutorial files installed with Slide3 can be accessed by selecting File > Recent > Tutorials folder from the Slide3 main menu. The finished product of this tutorial can be found in the Groundwater Seepage analysis_final.Slide3m2 file and Porewater pressure grid_final.Slide3m2.
2.0 Import Slide2 model to Slide3
We will be importing 2D slope model with groundwater from Slide2.
- Select File > Import > Import Slide Project
- The slide2 model is inside the following tutorial folder with name: 'slide water table'. Once you select the file 'slide water table' Slide2 model, the 2D model will be imported.
- You will be prompted with extrusion depth.
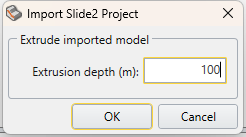
- Choose depth of 100 m. Select OK.
- You'll be prompted with import log. Select OK.

- Select OK with default extrusion depth of 100m.
- Select Groundwater workflow tab
 . You will see the following model as shown below:
 - Save the project as Steady state seepage_Slide3 before compute.
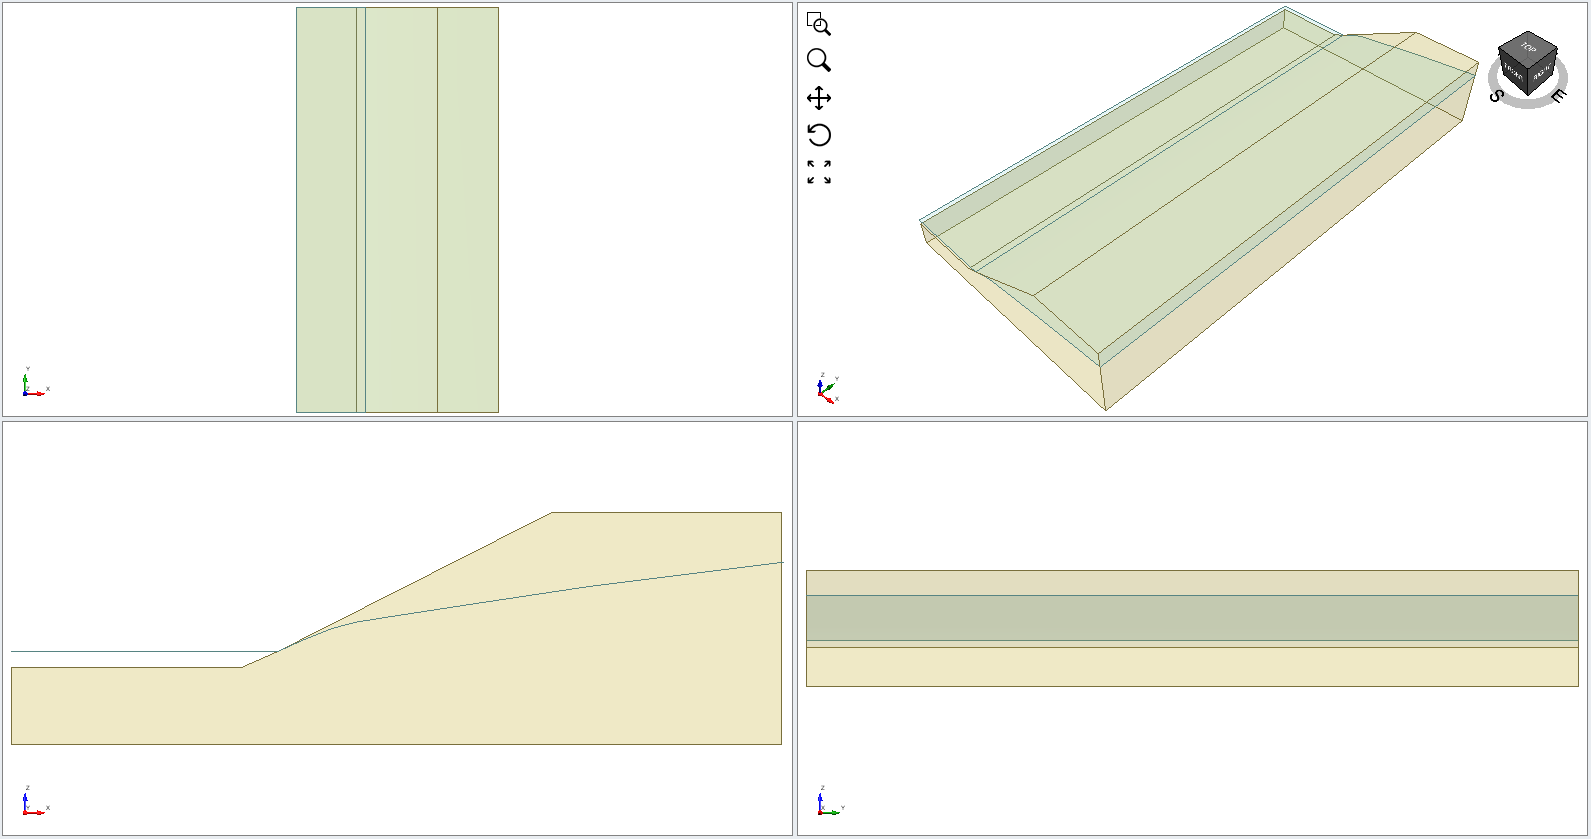
As you can see, the slope geometry is provided with water table shown in different plane. The ground water is above the geometry on lower slope and it goes below the geometry on higher slope.
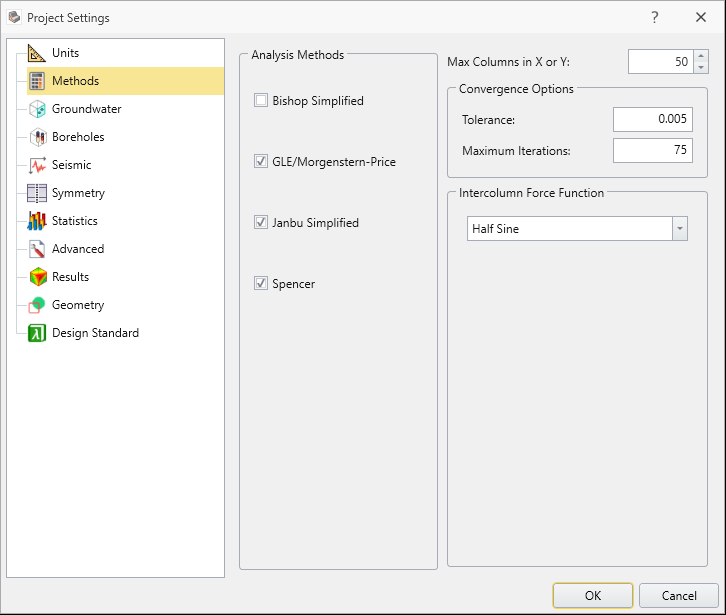
Before compute, make sure to check whether the project settings are the same as shown below for methods and groundwater.
Methods:
 .
.
Groundwater:

3.0 Compute Groundwater Steady State analysis in Slide3
We will first analyze the extruded model using Slide3 with steady state groundwater.
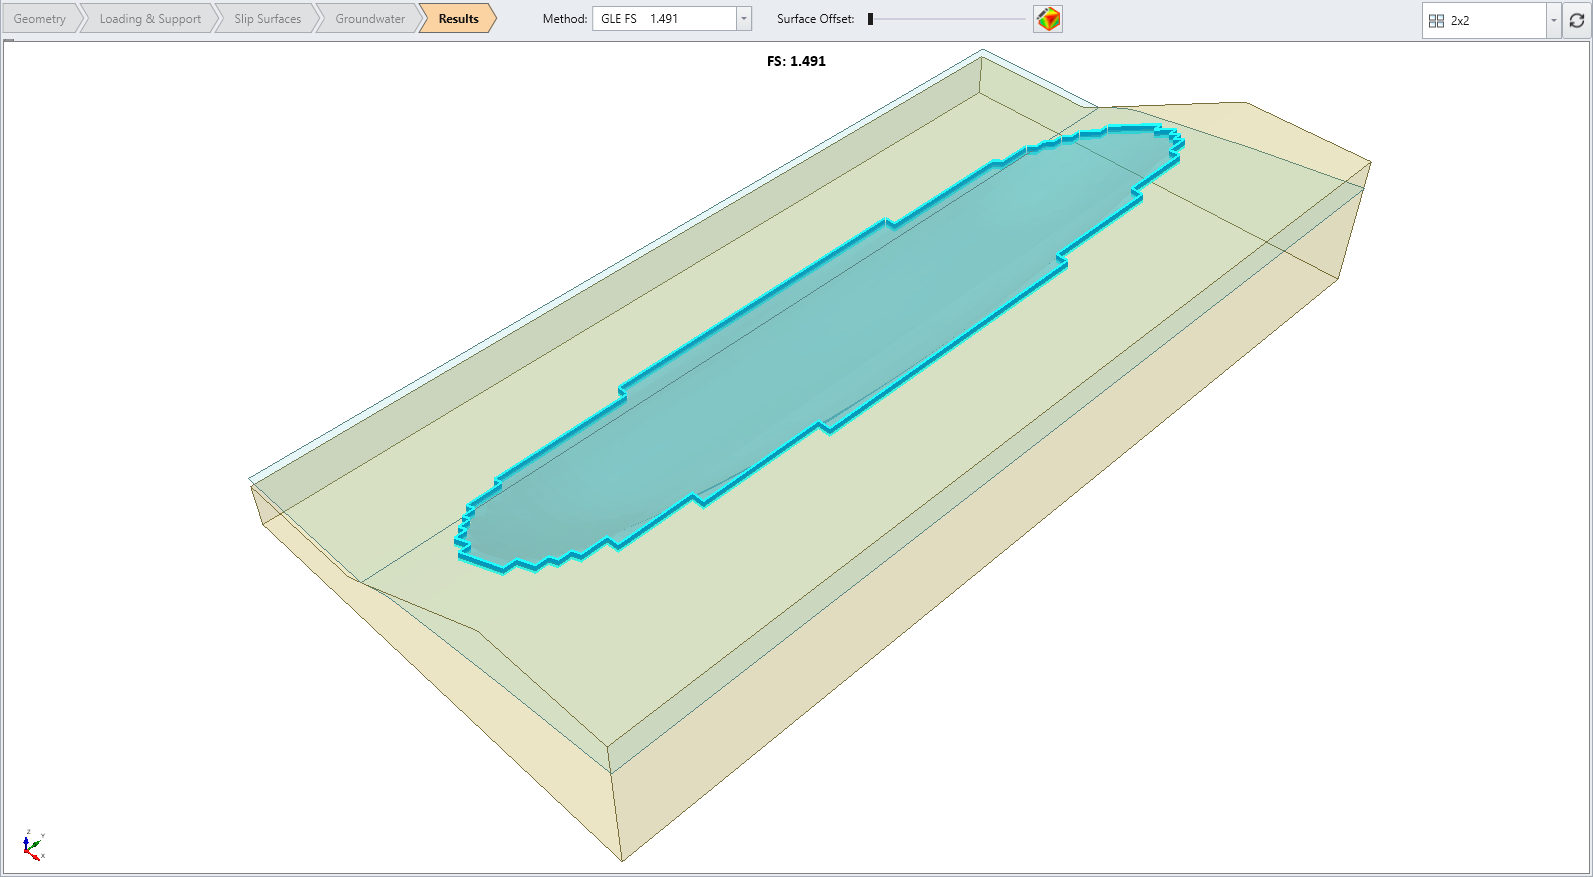
- Select Analysis > Compute

You will see the result as shown below with GLE FOS of approximately 1.5.
- Select Interpret > Show Data on Plane > XZ
 . Change the Data on Planes menu to Pore Water Pressure.
 - We want to change the contour option setting as well. Select Interpret > Contour options
 or right click on Legend.
 - Select Custom Range and enter 0 to 144. Set Interval Count to 24.

- Select Apply. You will see the following model result as shown below.
- Save the project. This file will be used to compare the result with imported pore water pressure grid from RS3 later.
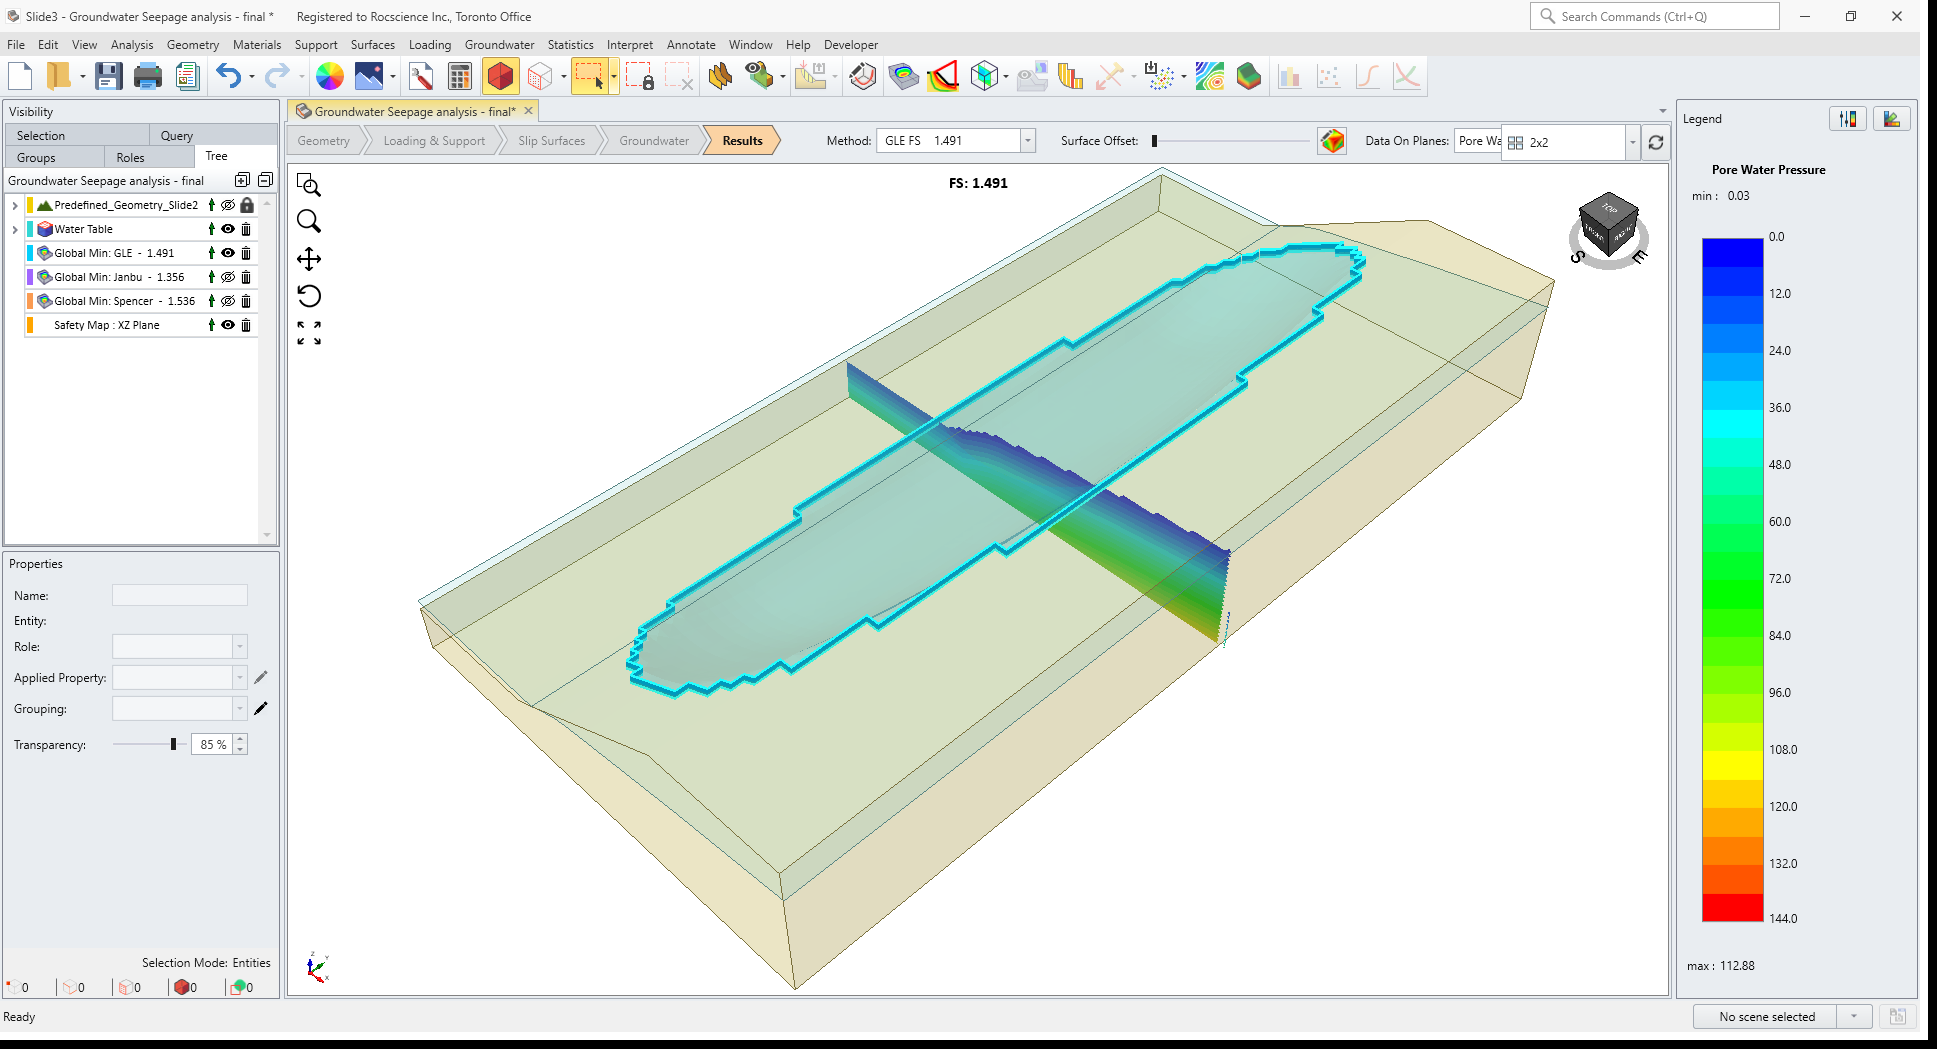
It is interesting to note that the pressure head shows zero value along the surface of the water table. This shows the pressure head analysis result is consistent with water table in the model.
4.0 Import Pore Water Pressure Grid to Slide3
With the Slide3 model opened (Steady state seepage_Slide3), we will import the pore water pressure slide3.pwp3 file.
- Select Groundwater > Add Water Pressure Grid or select Add Water Pressure Grid
 from the toolbar. You will see the following dialog:
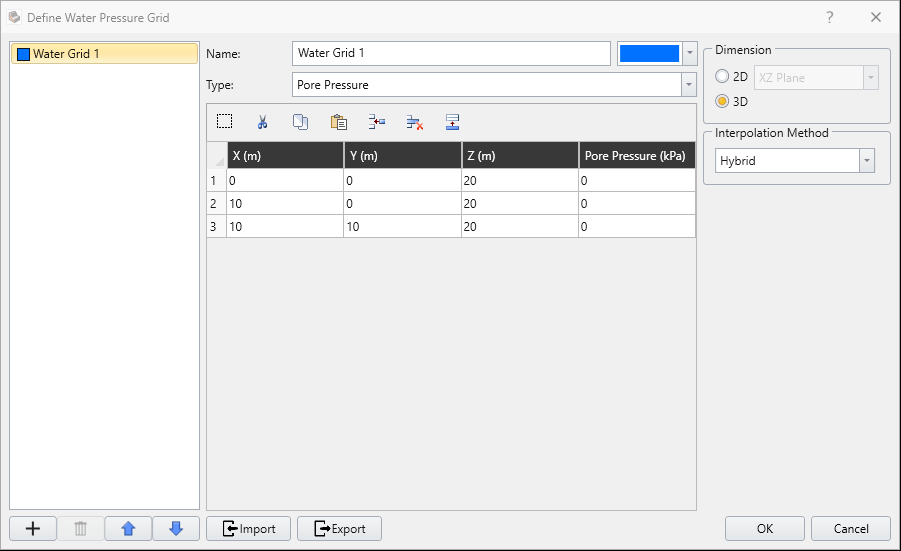
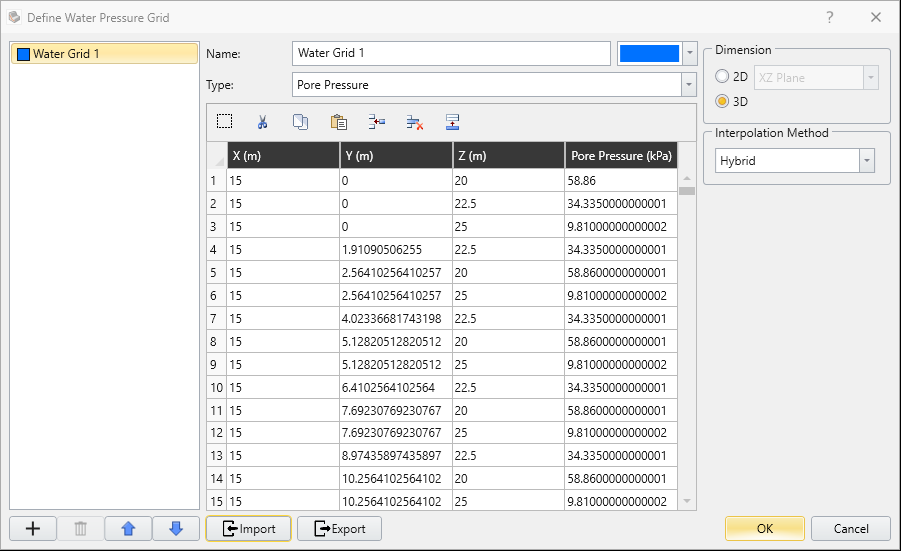
- Select the Import button. Change the open file type to PWP Files (*.PWP, PWP3).
- Open the file pore water pressure grid slide3.pwp3 which you should find in the following tutorial folder. This file was created by exporting the results of a seepage analysis from RS3.
- Select OK and the data should appear in the Water Pressure Grid dialog.
- Select OK, then the Hydraulic Assignment dialog pops up, and you can see the water pressure grid displayed as a grid colorful points on the model.
When you import the file you will first see an Import CSV file dialog.
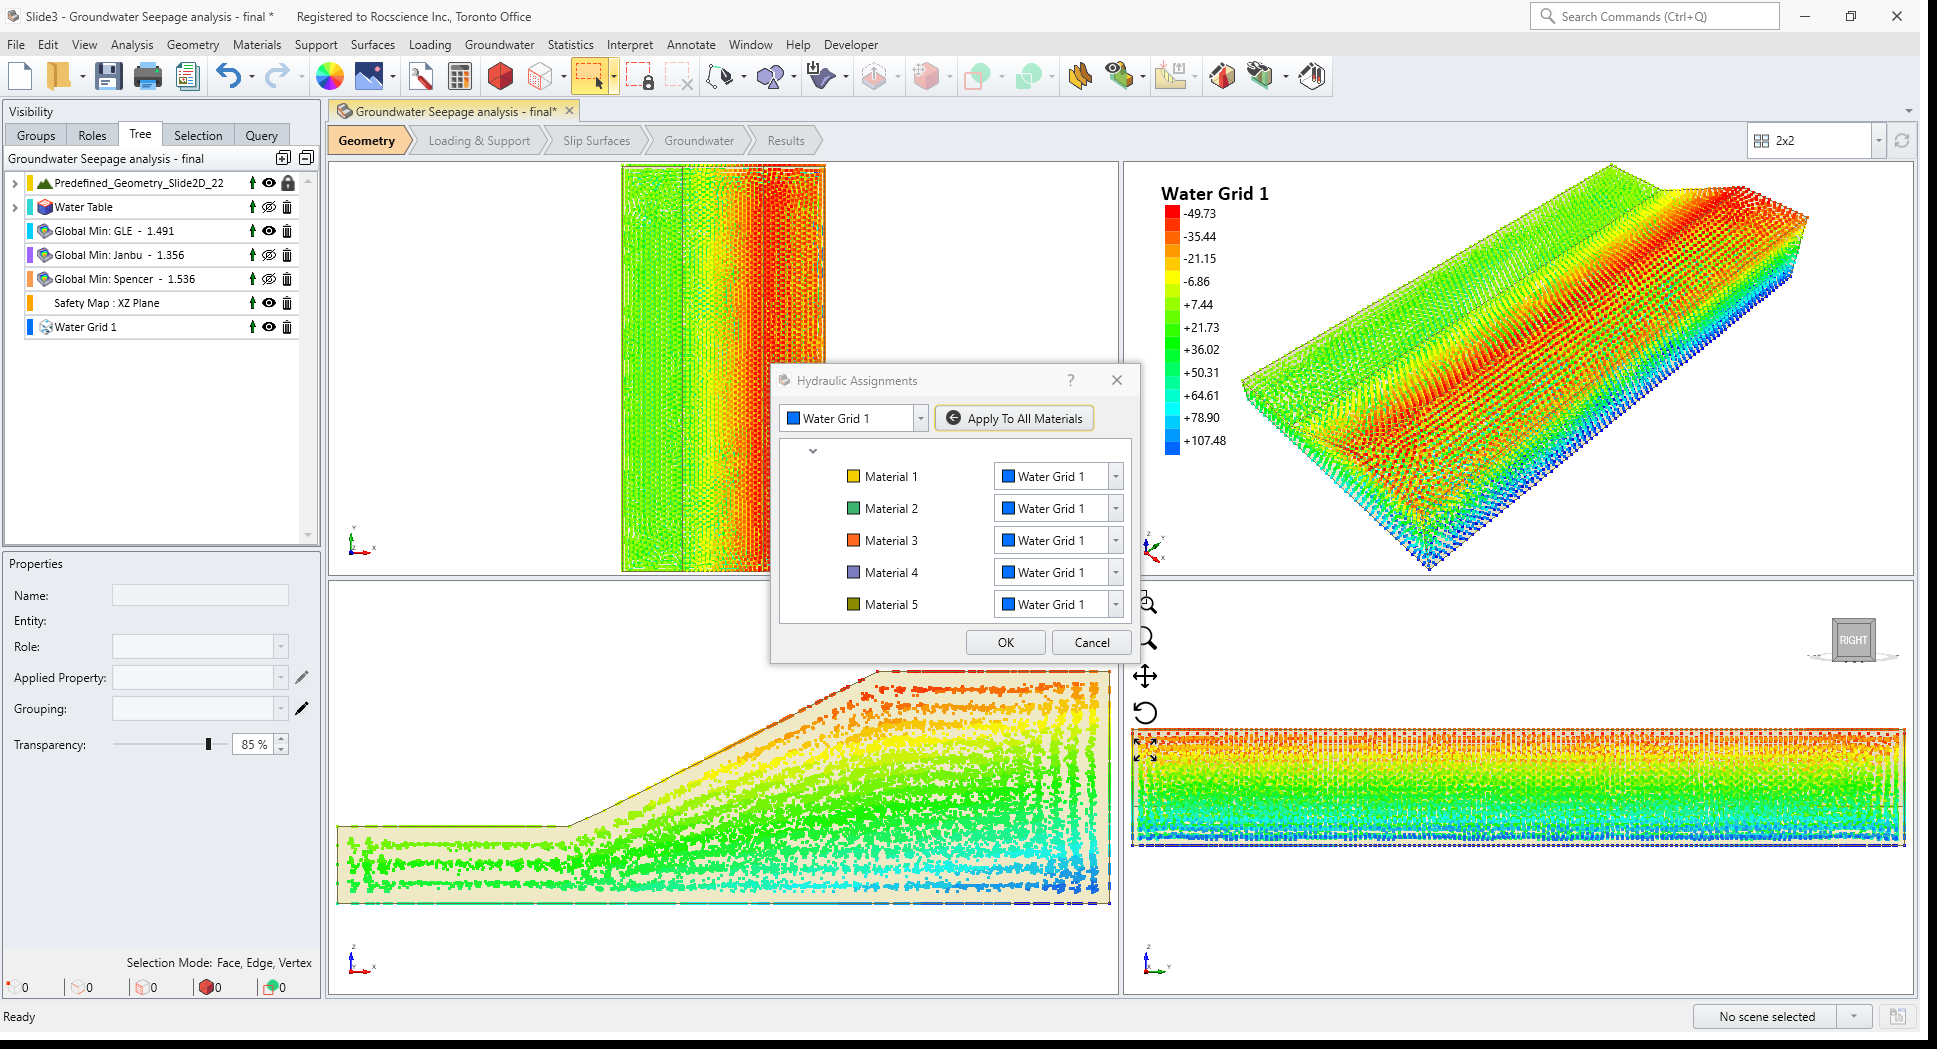
Water Grid 1 should be added to the Visibility Pane in the model.
5.0 Results
![]()
- Save the file and select Analysis > Compute
- Select the Results workflow tab to view the results.
- Select Interpret > Show Data on Plane > XZ
- Change the Data on Planes drop down menu to Pore Water Pressure.
- Change the contour plot option by selecting Interpret > Contour Options , or right click on the legend.
- Select Custom Range and keep values 0 to 144 and and 24 for interval count.
The Global Minimum slip surface for the GLE FOS analysis will be displayed. The safety factor for GLE is about 1.5.
Then you will see the following result as shown below:
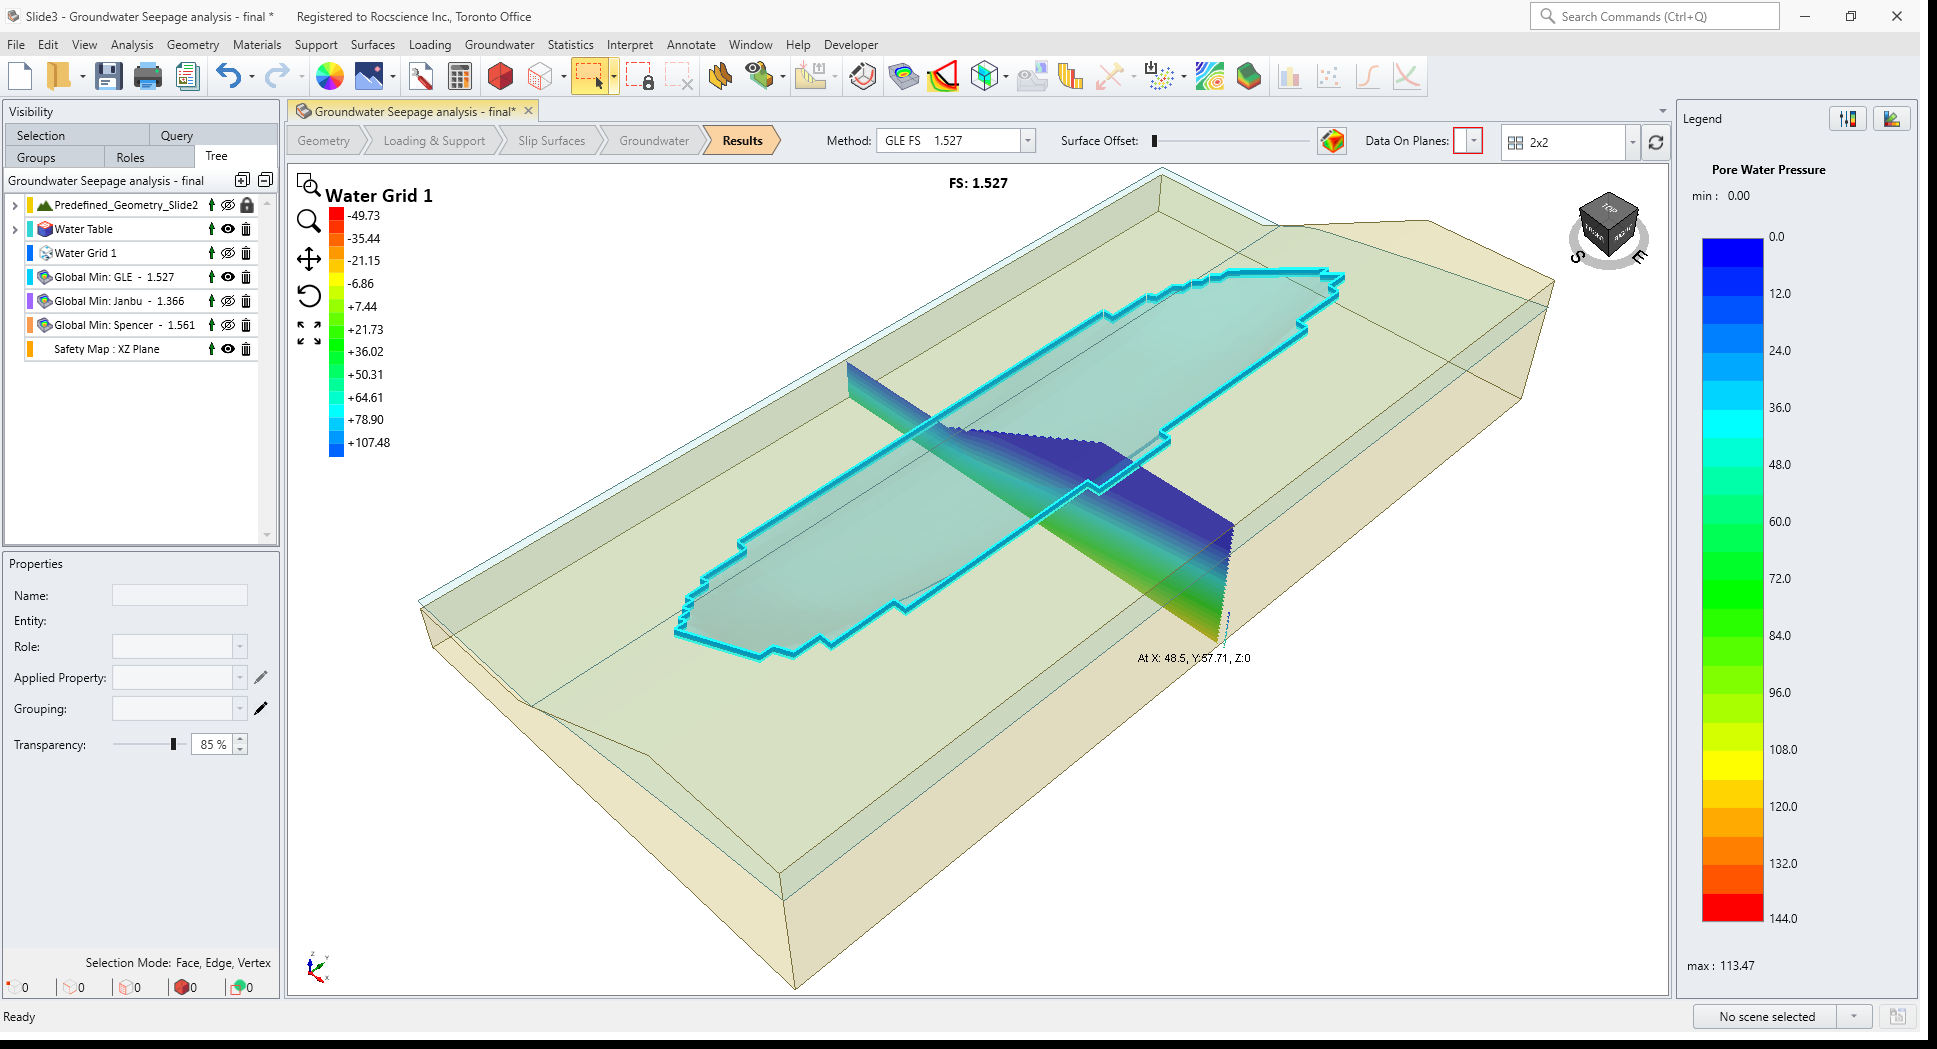
It is interesting to note that when Pore water pressure grid is used to analyze the seepage with same condition, the pore water pressure was lower than the analysis with ground water table (113.5 kPa to 112.9 kPa).
We can compare three case scenarios:
- Slide2 2D ground water seepage analysis
- Slide3 ground water steady state analysis
- Slide3 import pore water pressure analysis.
Slide2 2D ground water seepage analysis GLE FOS = 1.56 Pore water pressure = 115.6 |
Slide3 ground water steady state analysis FOS = 1.496 Pore water pressure = 112.9 kPa |
Slide3 Import Pore Water Pressure Analysis FOS = 1.513 Pore water pressure = 113.5 kPa |
With the comparison between Slide2 and two Slide3 results, we can see the results are in good agreement with each other. Note that although both of the slide models are analyzed with steady state ground water analysis, the results are slightly different. The difference is explained by pore water pressure grids which is obtained from water pressure head difference analysis from RS3 (FEM). If you want to analyze a transient seepage analysis in Slide3, you can perform the analysis in RS3 with transient ground water setting, and export the pore water pressure grids to Slide3 and run the analysis.
This concludes the groundwater seepage tutorial in Slide3.