Graph SF Along Slope
The Graph SF along Slope  option uses ALL valid slip surfaces generated by analysis, to generate a graph of safety factor along the surface of the slope. The graph uses the left and right intersection points of each slip surface with the slope (ground surface), and the safety factor of each surface, to determine values of safety factor along the slope.
Graph SF Along Slope is useful in determining areas of the slope which correspond to slip surfaces with low safety factors, and may possibly be involved in failure. This may in turn help to determine where a slip surface search should be focused, in order to find the true Global Minimum, or where to place External Loads or Anchor Support.
To use the Graph SF along Slope option:
- Select Graph SF along Slope
 from the toolbar or the Data menu.
 - You will see the following dialog.
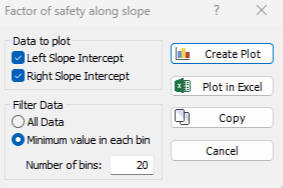
- Select the desired options in the dialog (see below for details), and select Create Plot to create a graph in Slide2, or Plot in Excel to create a graph in Microsoft Excel.
Data to plot
Each valid slip surface analyzed by Slide2 always has exactly two intersection points with the slope (ground surface), designated the LEFT and RIGHT Slope Intercepts in the dialog.
In most cases, you will probably want to create a graph which uses both the LEFT and the RIGHT intersection points to generate the graph of safety factor along the slope. However, you may choose to graph the data for only the LEFT or the RIGHT intersection point, if desired, by clearing the checkbox for the intersection point you do NOT want to plot.
Filter Data
Minimum value in each bin – this option will divide the horizontal extent of the slope into equally spaced bins, using the specified Number of bins. The graph is then generated by only plotting the minimum safety factor within each bin.
All Data – this option will plot the safety factor for ALL slip surface intersection points on the slope. This results in a much more scattered plot than the Minimum value in each bin option.
Create Plot
Use the Create Plot button to generate a graph in Slide2. Once a graph is generated in Slide2, it can be customized with the Chart Properties or Change Plot Data options, as described below.
Plot in Excel
You can use the Plot in Excel button to generate a graph in Microsoft Excel. The following will occur if you select Plot in Excel:
- The Microsoft Excel ä program will automatically be launched (if you have Excel installed on your computer).
- The raw data used to generate the graph, will be exported to an Excel spreadsheet.
- The graph will be created in Excel.
You can then customize the graph or process the data as desired in Excel.
Copy Graph Data to Clipboard
If you select the Copy button, the raw data used to generate the graph, will be copied to the Windows clipboard. From the clipboard, it can be pasted into other applications for report writing, or further data processing etc.
Changing the Analysis Method
After a graph is created, you can change the Analysis Method, to view data for different methods. Simply select the desired Analysis Method from the toolbar, and data corresponding to the method will be displayed.
Customizing a Graph
After a graph has been created, various options are available to the user to customize the graph data and appearance.
Chart Properties
If you right-click the mouse on a graph, and select Chart Properties, the Chart Properties dialog allows you to change axis titles, minimum and maximum values, etc.
Change Plot Data
If you right-click the mouse on a graph, and select Change Plot Data, this will display the Factor of Safety Along Slope dialog, allowing you to change the Data to Plot or Filter Data parameters (for example, you may want to increase or decrease the Number of bins used for plotting).
Grayscale
If you right-click the mouse and select Grayscale, the view will be grayscaled, suitable for black and white image capture. Grayscale is also available in the toolbar, and in the View menu, and can be toggled on or off at any time.
Zoom and Pan
All of the Zoom and Pan options can be used for graph views, in the same manner as regular model views. See the Zoom and Pan topics for details.