6 - Preload with Wick Drains
1.0 Introduction
Topics Covered in this Tutorial:
- Pre-Loading
- Wick Drains
- Staged Loading
- Time-Dependent Consolidation
Finished Product:
The finished product of this tutorial can be found in the Tutorial 06 Preload.s3z file. All tutorial files installed with Settle3 can be accessed by selecting File > Recent Folders > Tutorials Folder from the Settle3 main menu.
2.0 Preload Fill
If you have not already done so, run Settle3 by double-clicking on the Settle3 icon in your installation folder. Or from the Start menu, select Programs > Rocscience > Settle3.
2.1 Project Settings
- Select Home > Project Settings
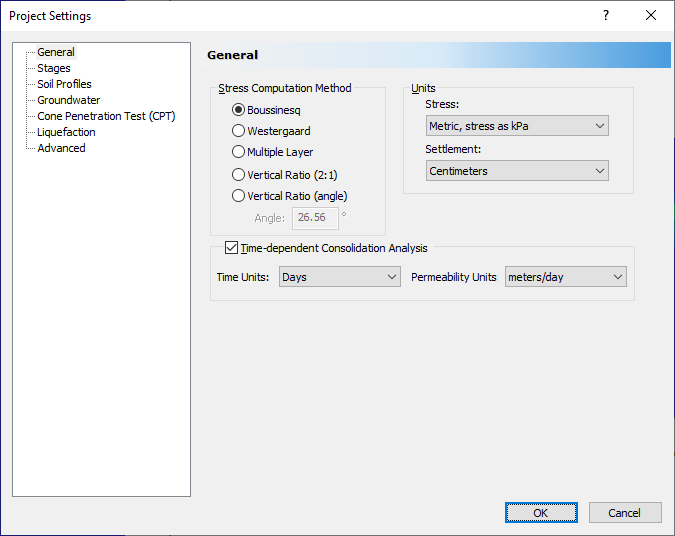
 and make sure the General tab is selected.
 - Set the Stress units = Metric, stress as kPa, and the Settlement units = Centimeters.
- Select the Time-dependent consolidation analysis checkbox.
- A message will appear informing you that the groundwater analysis option will be turned on because it is required for consolidation analysis. Click OK to close the warning.
- Set the Time Units = Days, and the Permeability Units = meters/day.
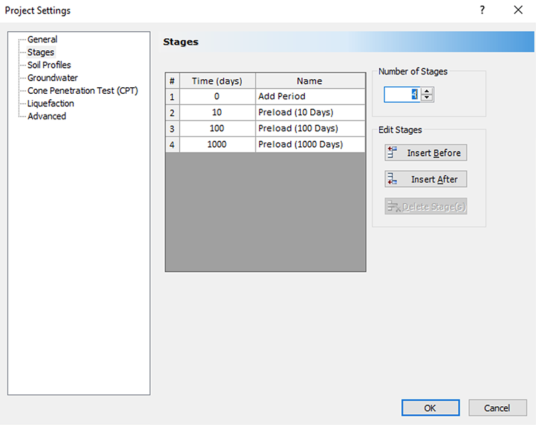
- Click on the Stages tab. Set the Number of Stages = 4, and enter the following names for each stage.
- Select Soil Profiles tab. Select the 'Depth below Ground surface' option.
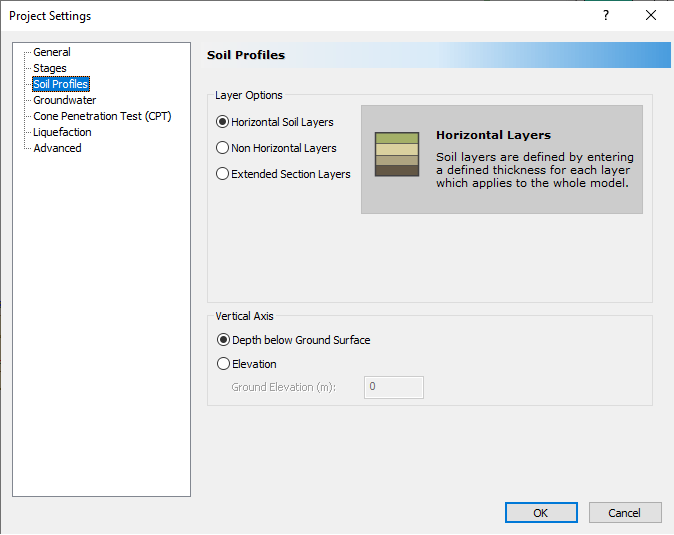
- Click OK to save your input and exit the dialog.
| # | Time (days) | Name |
| 1 | 0 | Add Period |
| 2 | 10 | Preload (10 Days) |
| 3 | 100 | Preload (100 Days) |
| 4 | 1000 | Preload (1000) |
2.2 Assigning Water Table
- Select Groundwater > Add Piezometric Line

- Keep the default depth of 0m and click OK.
- In the Assign Piezometric Line to Soils dialog, click on Select All, then OK to close the dialog.
2.3 Adding the Preload
The preload is generally applied by laying down high permeability (sand) fill over a large area. We will use the Add Pre-Load option to define a 50 m x 50 m preload fill of 1.5 m height.
- Select Loads > Pre-Load

- You will be prompted to enter the polygon coordinates. Enter the following coordinates in the prompt line:
- {25,25}
- {-25,25}
- {-25,-25}
- {25,-25}
- "c" (to close the region)
- You will see the Define Pre-Load dialog. First, turn OFF the Calculate Height from Settlement checkbox (this is the back-analysis option which we will be covering in the next tutorial).
- Enter a Fill Height = 1.5 meters, and leave all other parameters as the default settings.
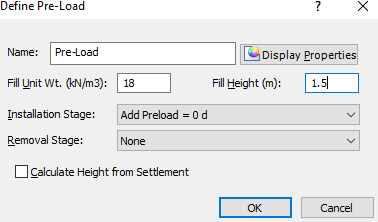
- Click OK and the pre-load will be added to the model.
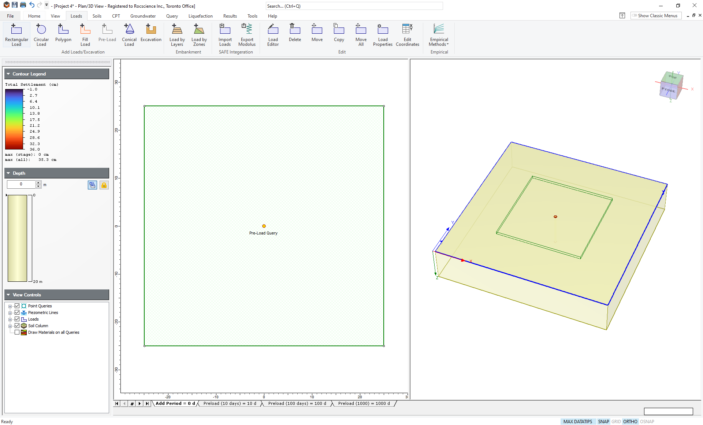
- Click in the Plan View and select Zoom All (or press the F2 function key) to center the load in the view. Your screen should look as follows:
2.4 Soil Layers
We will next set the soil properties.
- Select Soils > Define Soil Properties

- For simplicity, we will assume that there is only one soil type present. For Soil Property 1:
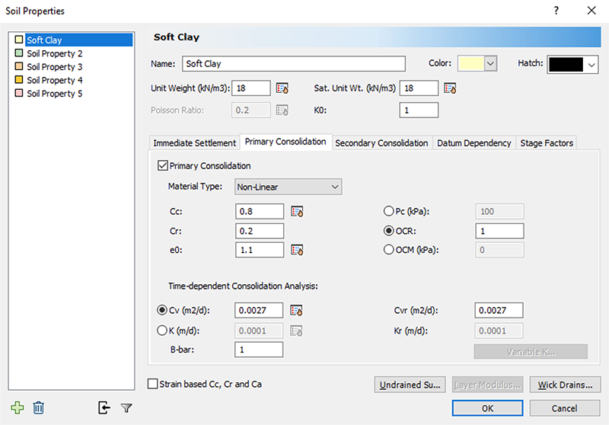
- Change the name to Soft Clay
- Set Cc to 0.8, Cr to 0.2 and Cv = Cvr = 0.0027.
- Leave all other input at the default settings.
The dialog should look like this: - Click OK to close the dialog.
To change the thickness of the soil layer:
- Select Soils > Layers

- Set the layer thickness to 15 m as shown:
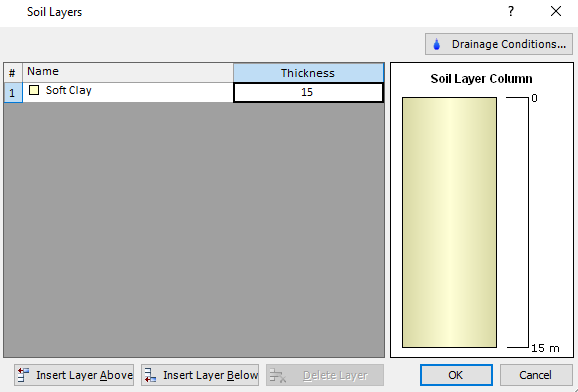
- Click on the Drainage Conditions button and make sure that the Drained Ground Surface checkbox is selected.
- Click OK to close the dialogs.
2.5 Preload Settlement 1
Since the preload point query is already defined, we can immediately view the results.
For the first stage, you will see no settlement since the pore water is initially supporting the load. Click through the other stages and you will see increasing settlement with time as the pore pressure dissipates.
Double-click in the 3D View to maximize the view. The results for Stage 4 (1000 days) should look like this:
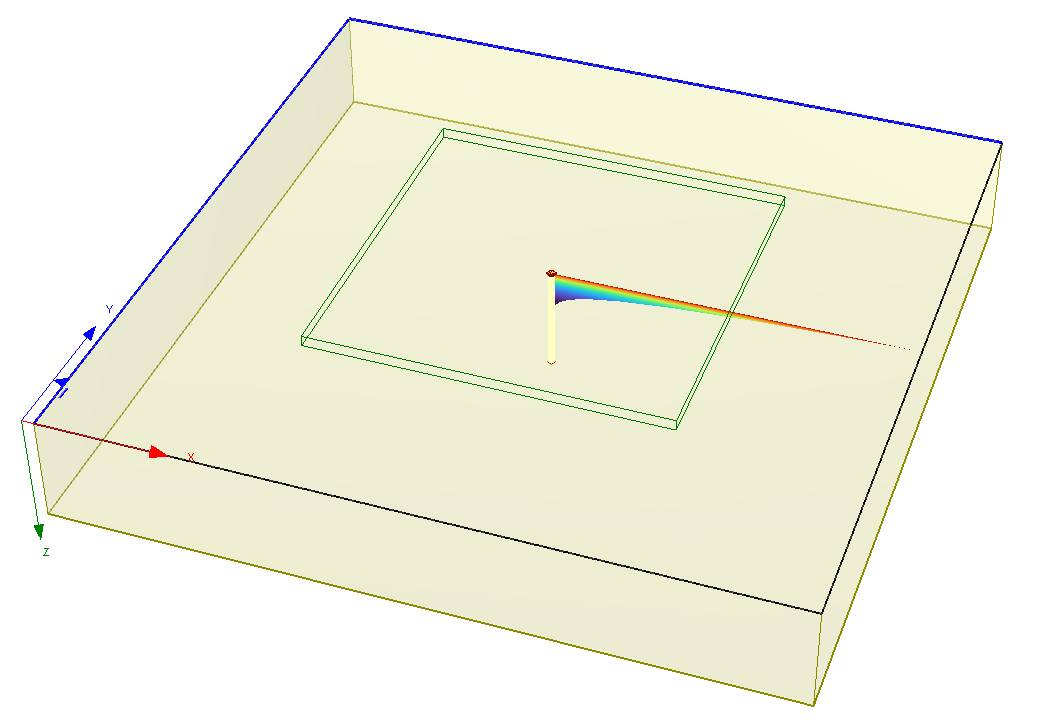
TIP: You can maximize the Plan View or 3D View by double-clicking in the view. Double-click again to return to the split-screen view.
You can see below the legend in the sidebar that the maximum settlement is 70.7 cm after 1000 days. Go to the Results tab and change the plot to Excess Pore Water Pressure using the drop down menu. You will see significant excess pore pressures at 1000 days, suggesting that the material is not finished consolidating. Verify this by changing the plot to Degree of Consolidation. You can see that the maximum degree of consolidation is about 50%. To speed up the consolidation process we will now add wick drains.
Double-click in the 3D View to restore the split-screen display.
2.6 Wick Drains
- Click on the tab at the bottom to view Stage 1 (Add preload = 0d). Before we install wick drains, we need to specify the horizontal flow behaviour in the material.
- Select Define Soil Properties
 from the Soils tab. In the Soil Properties dialog, for the Soft Clay material, click on the Wick Drains button.
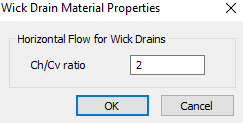
 - We will assume that the horizontal coefficient of consolidation is double the vertical, so set the Ch/Cv ratio to 2 as also shown below.
- Click OK. Close the Soil Properties dialog by clicking OK.
To add an array of wick drains:
- Select Groundwater > Add Wick Drain

- Use the default wick drain properties, but enter Drain length = 15, to correspond to the thickness of the soil layer.
- Make sure that the installation stage is Stage 1 (Add preload = 0 d).
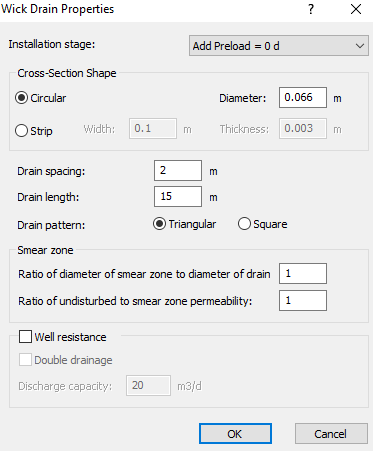
- Click OK to close the dialog.
- You will now be prompted to enter the coordinates defining the wick drain region. We want the wick drain region to completely cover the preload so enter the following coordinates:
- {30,30}
- {-30,30}
- {-30,-30}
- {30,-30}
- "c" (to close the region)
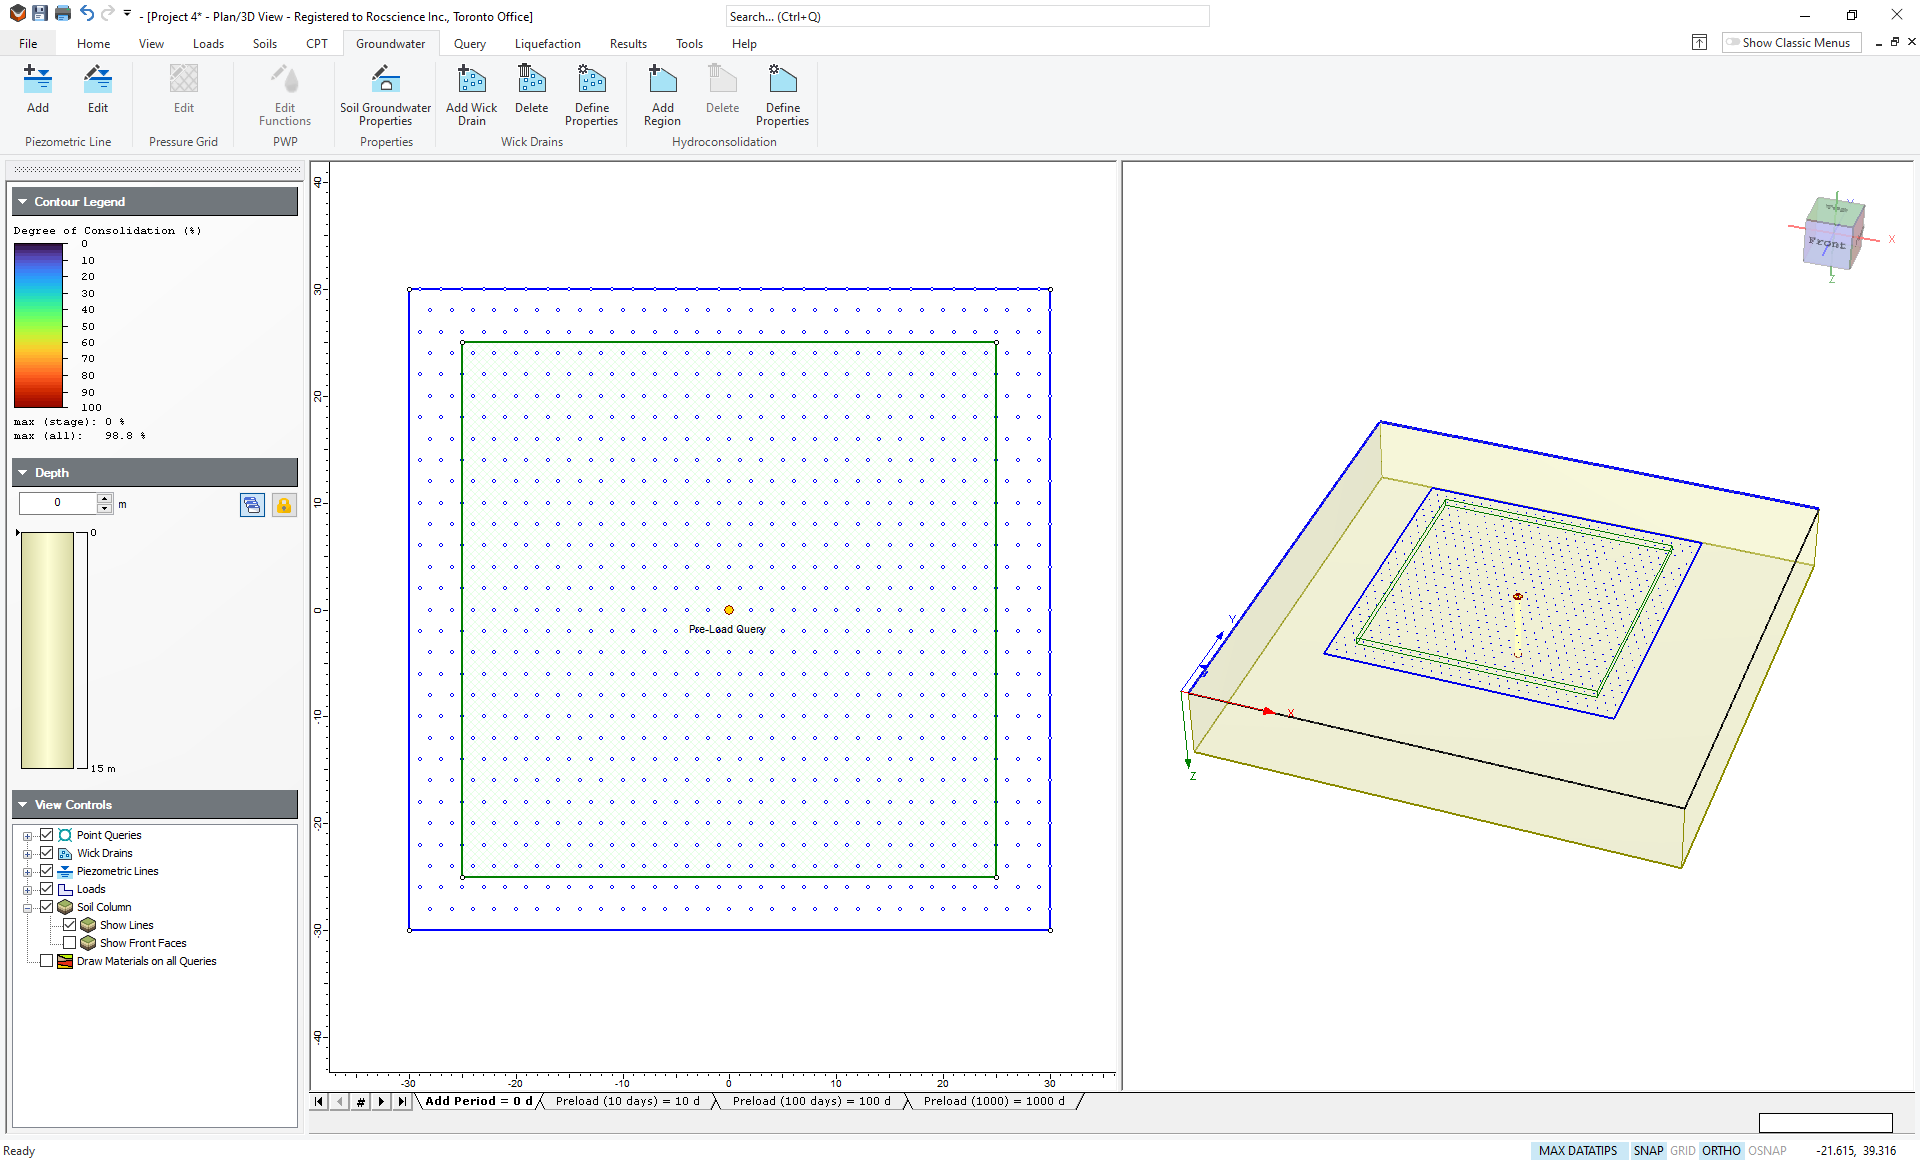
- Click in the Plan View and press the Zoom All button in the toolbar. Your model should look like this for the first stage:
TIP: You can display the drains in the 3D View by clicking on the Display Options button and selecting the Show Wick Drains checkbox.
2.7 Preload Settlement 2
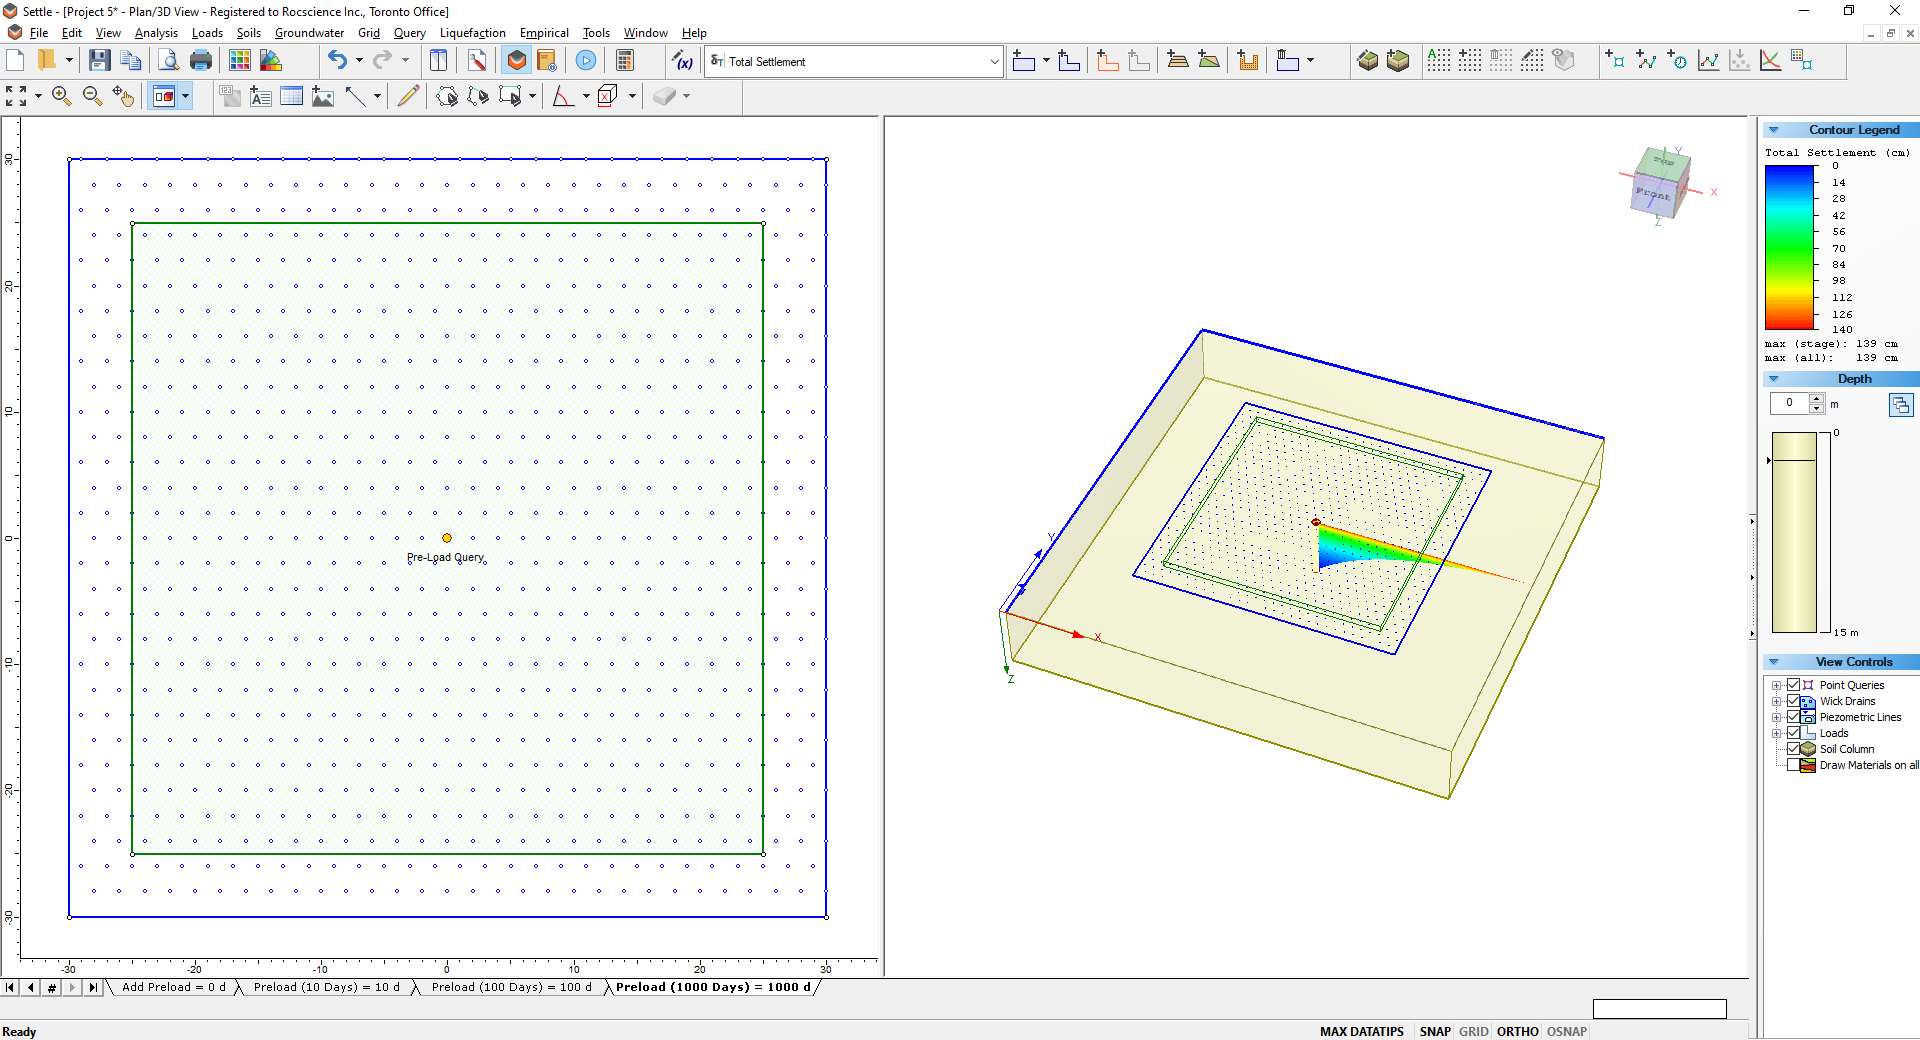
Go to the Results tab, change the data type to Total Settlement and click through the stages. You will see now that the maximum settlement at 1000 days is 139 cm (about double the settlement observed without wick drains).
If you plot the Degree of Consolidation, you will see that the maximum at 1000 days is now 98.8%. Clearly, the wick drains have been successful in dissipating most of the excess pore pressure and speeding up consolidation. Plot Excess Pore Pressure and view the results at each stage to verify this.
3.0 Building Load
The purpose of the preload was to precondition the soil prior to the construction of a building so that the building settlement will be minimal. We now wish to remove the preload and add the building load.
3.1 Stages
First, we must add more stages.
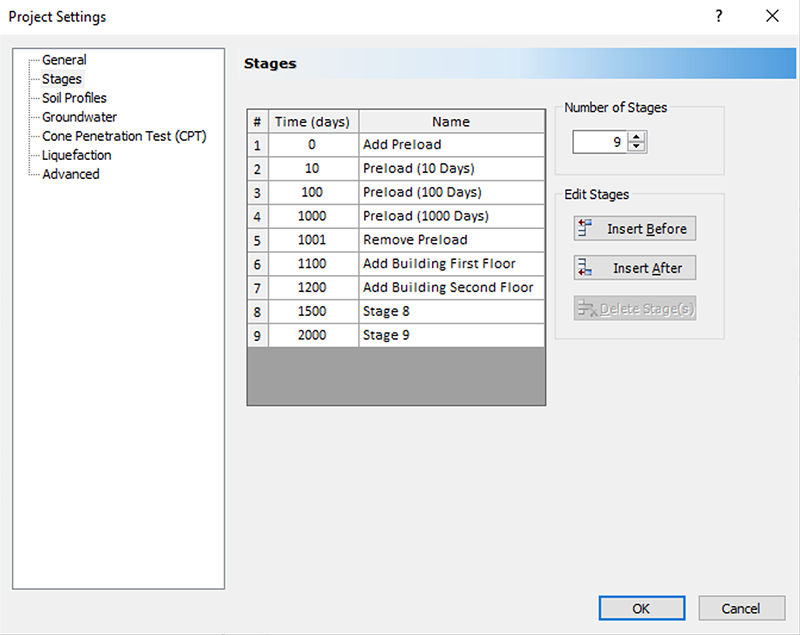
- Go to Project Settings and click on the Stages tab. Set the Number of Stages = 9 to add 5 new stages. Set the additional stage times and names as shown:
- Click OK to close the dialog.
| # | Time (days) | Name |
| 5 | 1001 | Remove Preload |
| 6 | 1100 | Add Building First Floor |
| 7 | 1200 | Add Building Second Floor |
| 8 | 1500 | Stage 8 |
| 9 | 2000 | Stage 9 |
3.2 Remove Preload
- We wish to remove the preload at Stage 5 (1001 days). To do this, right-click on the preload and select Pre-Load Properties from the popup menu.
- In the dialog, set the Removal Stage to Remove Peload = 1001 days.
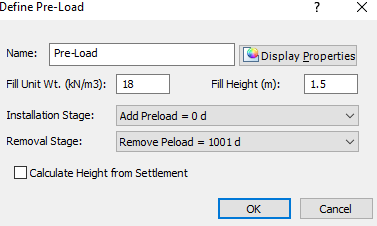
- Click OK to close the dialog.
3.3 Add Building
We will now simulate the construction of a two-story building. To add the building load:
- Select Loads > Polygonal

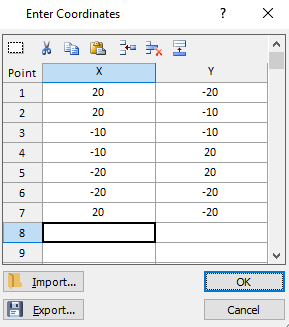
- Type "t" (for table) in the prompt line in the bottom right of the screen and hit Enter. Enter the following coordinates to create an L-shaped building:
- We will assume that each floor of the building represents a load of 15 kPa and that each floor takes 100 days to build. In the Define Load dialog, set the Pressure to 15 kPa.
- Now click the Advanced staging checkbox. Set the load factor for the first five stages to 0.
- Set the load factor for Stages 6 to 1. Set the load factor for stages 7, 8 and 9 to 2. The dialog should appear as shown:
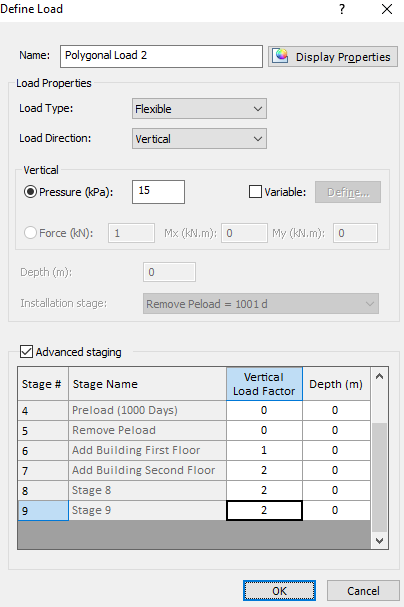
- Click OK.
| X | Y |
| 20 | -20 |
| 20 | -10 |
| -10 | -10 |
| -10 | 20 |
| -20 | 20 |
| -20 | -20 |
| 20 | -20 |
You should now see the building in both the Plan View (left) and in the 3D View (right).
- In stages prior to 1100 days, the building is displayed as a dotted line, because the load is not applied (load factor = 0)
- If you click on the stage tab ‘Add building load = 1100 d’, you will see the building displayed as a solid line (load factor = 1)
- For later stages, in the 3D View, you will see the building is twice as high because the load has been doubled from 15 kPa to 30 kPa (load factor = 2)
4.0 Results
To observe the settlement contours:
- Select Query > Auto Field Point Grid

- Set the Number of grid points = 500 and click OK. Go to the Results tab and make sure the data type is Total Settlement.
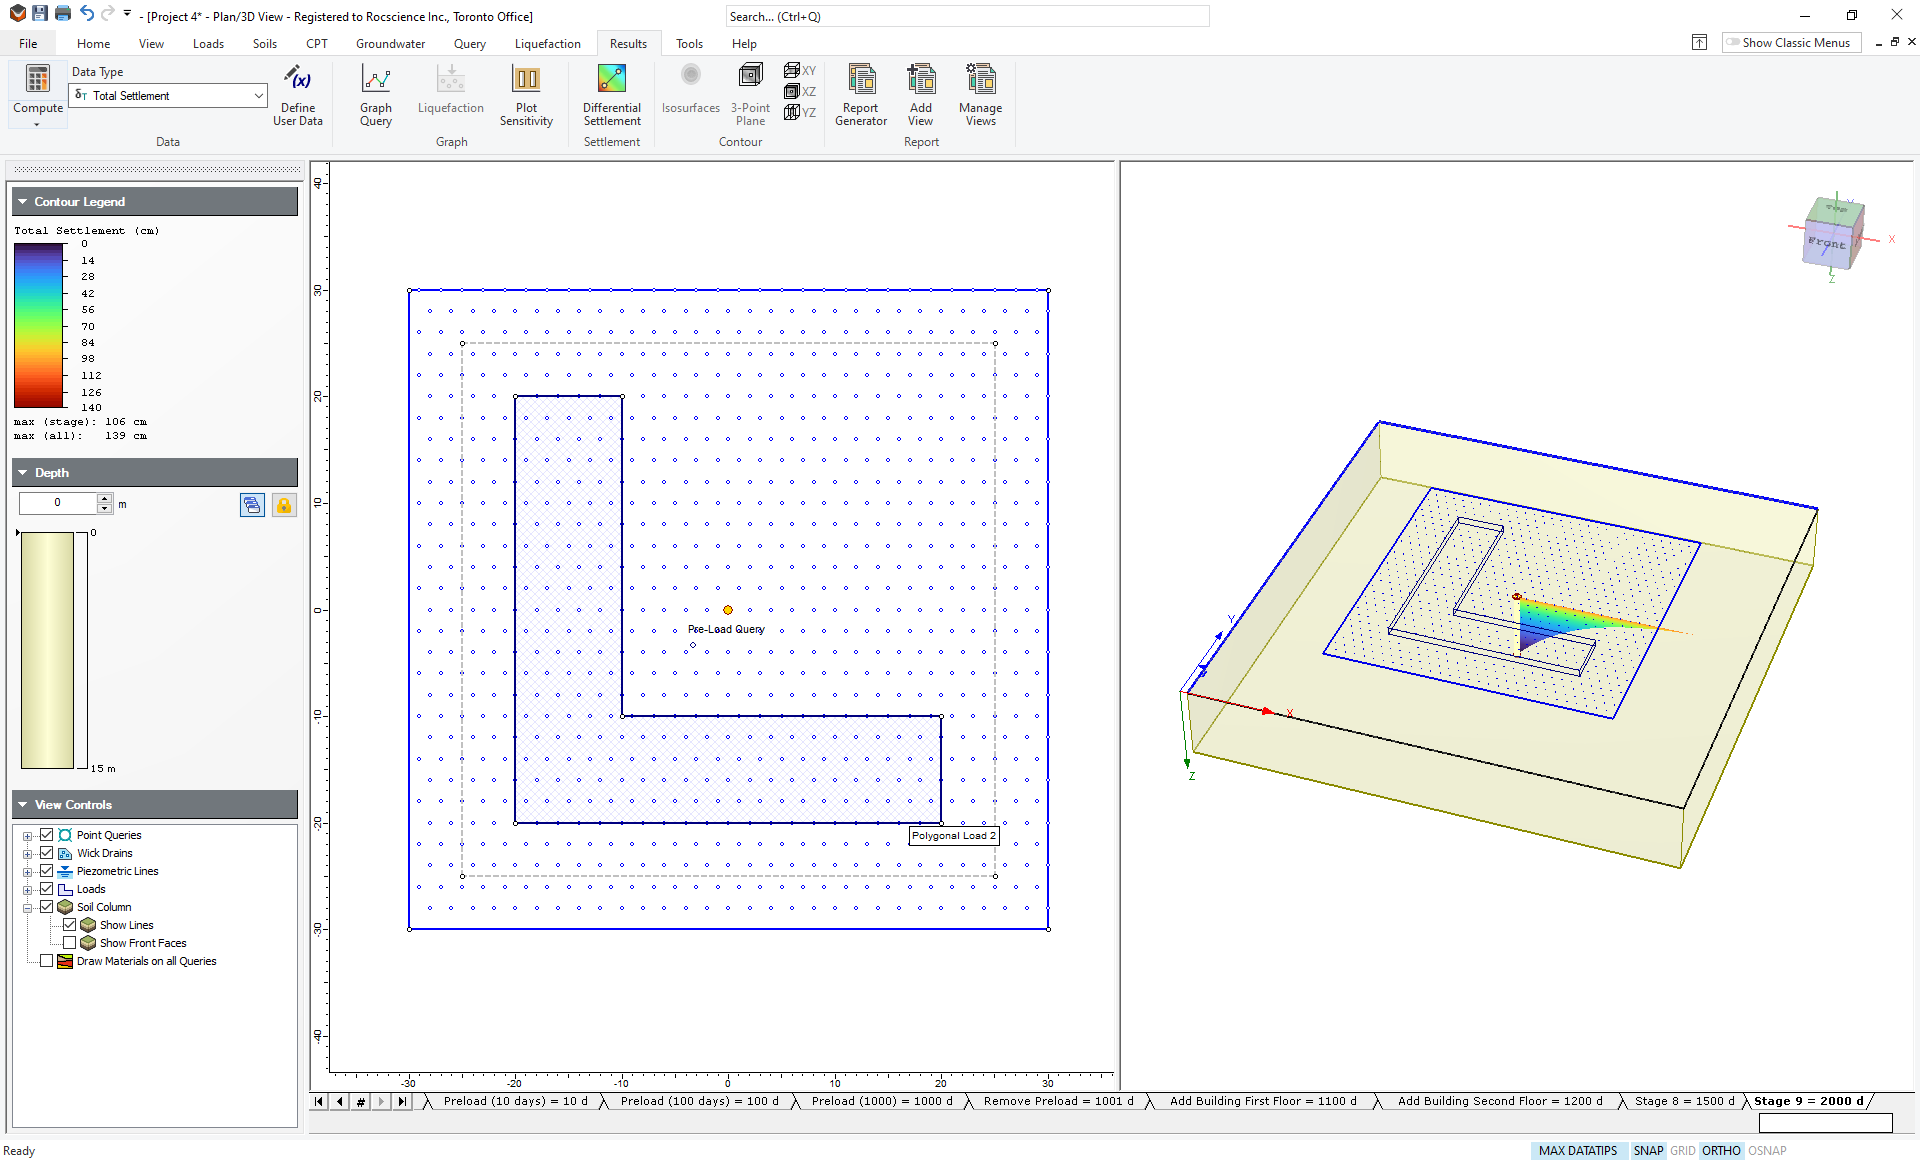
- Click through the stages to observe settlement with time. Your model for Stage 9 (2000 days) should now look like this:
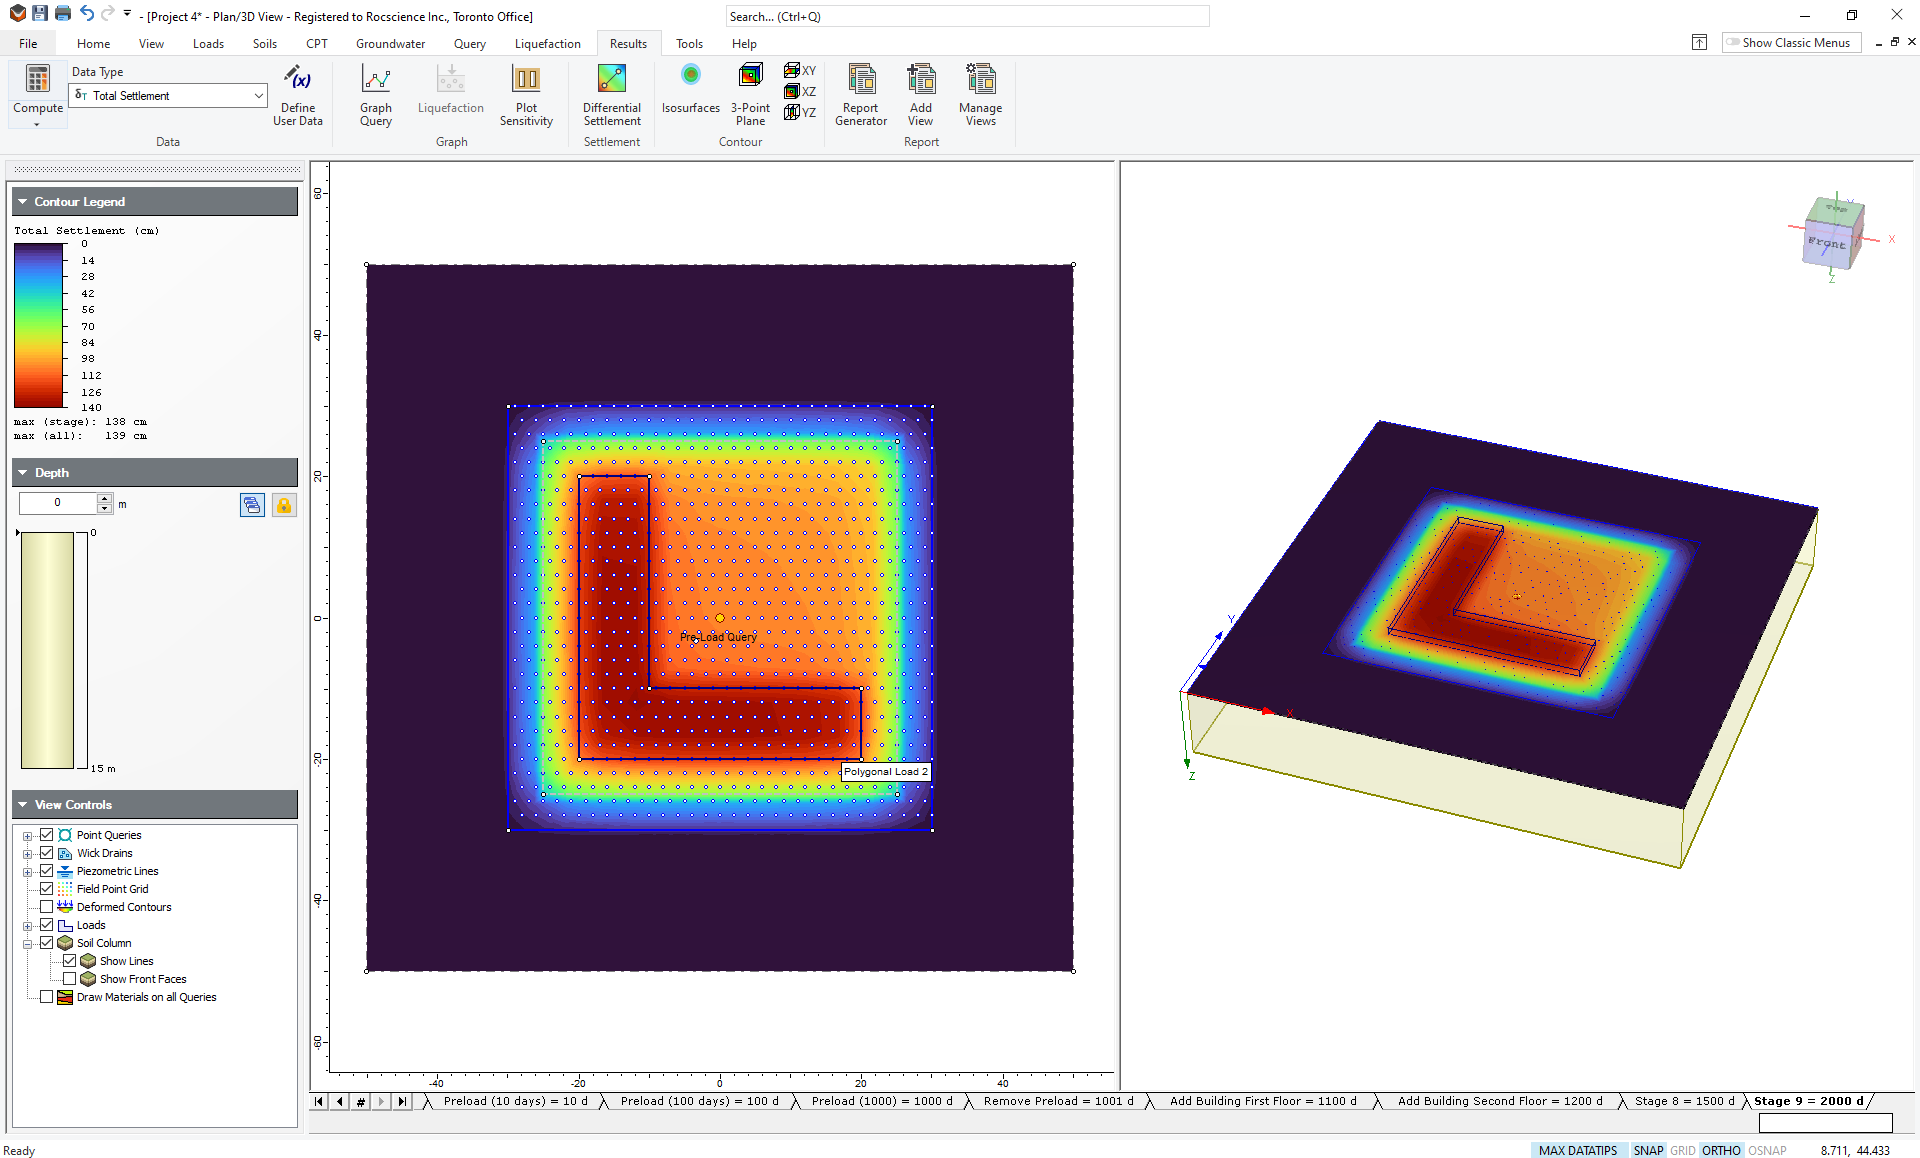
TIP: The plot will be clearer if you do not plot the wick drains. Go to View Controls on the sidebar and clear the Wick Drains checkbox.
You will see a maximum settlement of 138 cm under the building. However, this includes the settlement due to the preload. To look at the settlement in more detail, we can add another query point under the building.
- Select Query > Add Point

- In the Query Point dialog leave the Number of Vertical Points as Automatic and click OK.
- Enter -12, -12 for the coordinates of the query point and hit Enter.
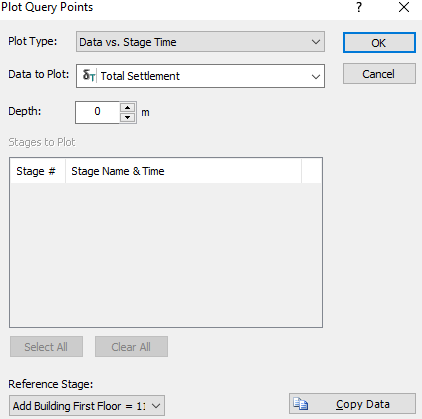
- Right-click on the new query point and select Graph Query.
- For Plot Type, choose Data vs. Stage Time.
- For Data to Plot choose Total Settlement and ensure that the depth is 0 m.
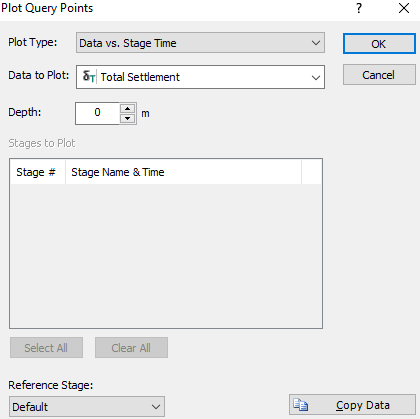
- Click OK. In the Sidebar under Axes, change the horizontal and vertical values to the following:
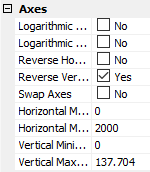
You should now see a graph of total settlement versus time.
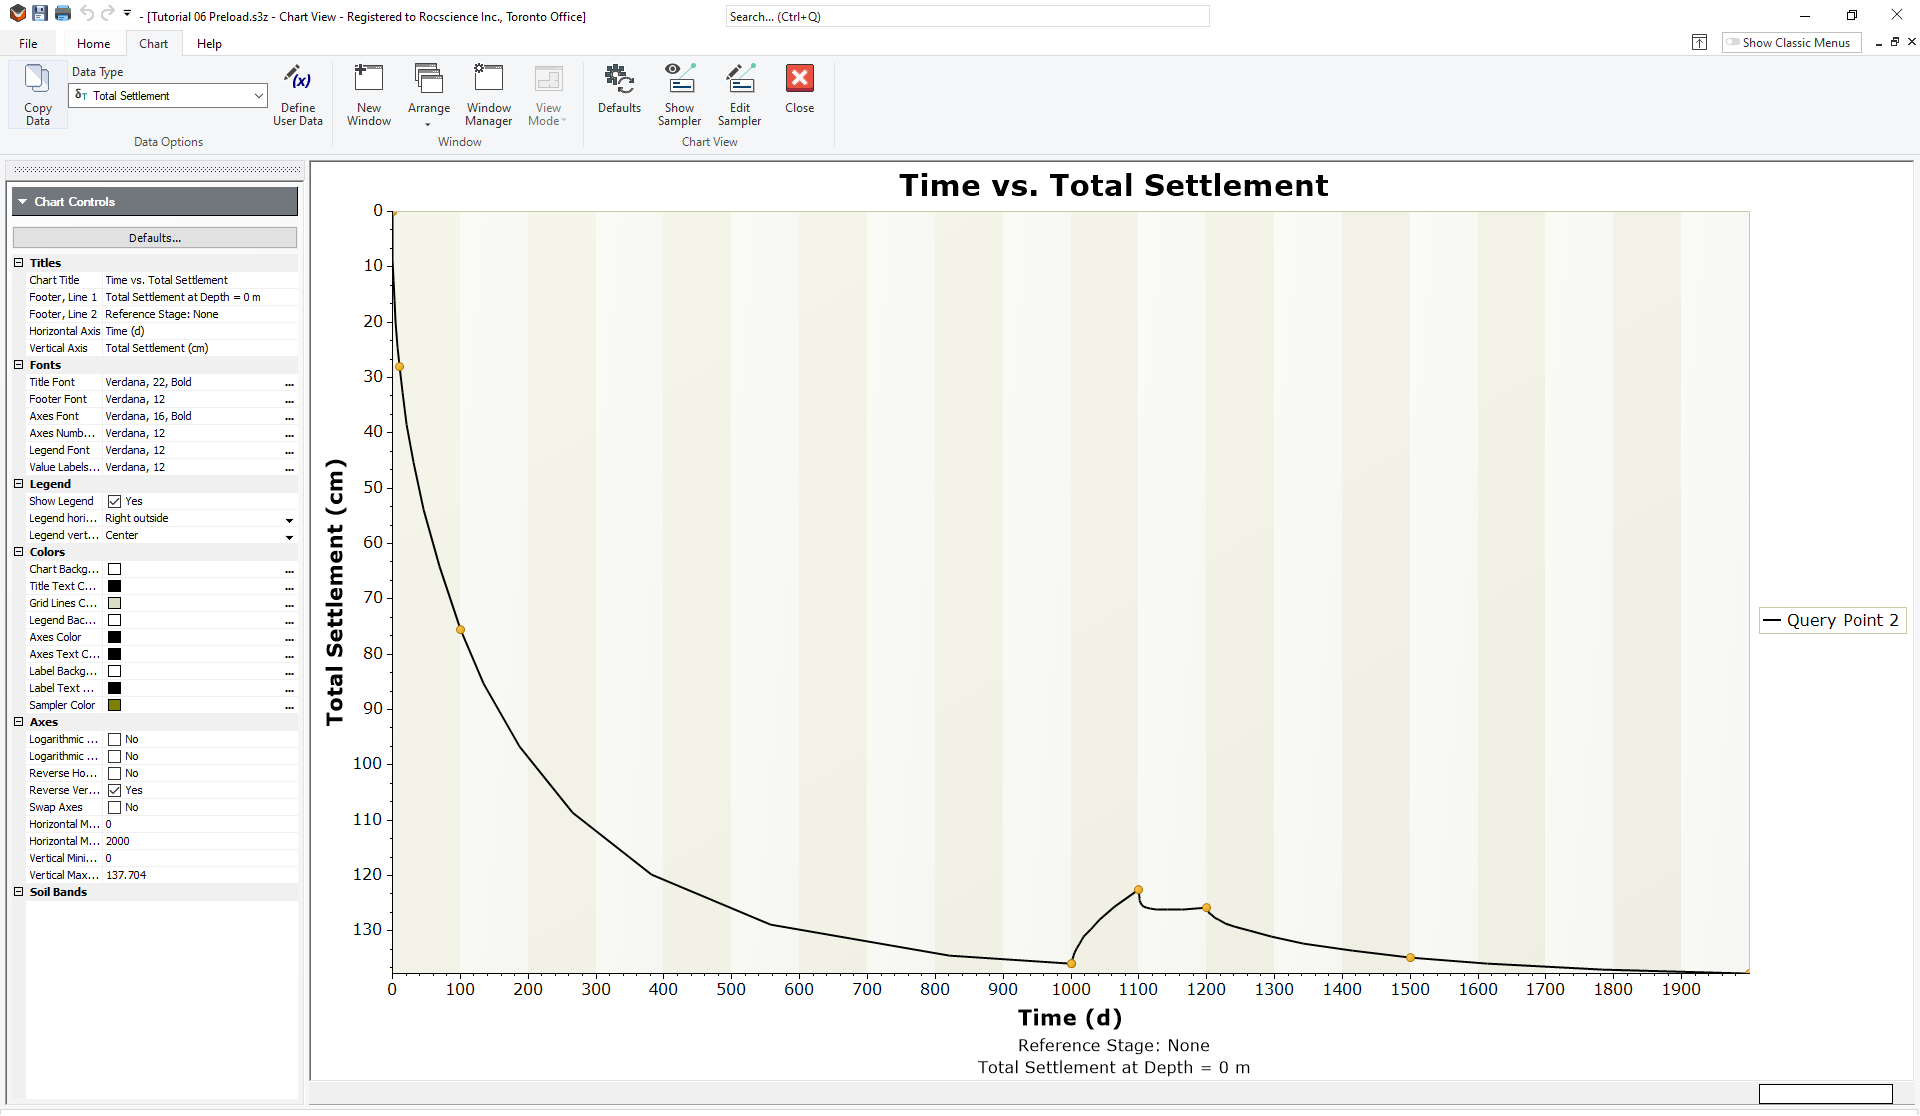
You can see significant displacement during the first 1000 days due to the preload with wick drains. The preload is then removed at 1001 days and there is a small amount of rebound due to unloading. At 1100 days, the first floor of the building is added and a small amount of downward settlement occurs. The second floor is added at 1200 days and further settlement occurs. As time goes on, the soil continues to consolidate.
The amount of rebound and recompression is small because the soil is in an overconsolidated state, so it is much stiffer than when it is being initially loaded by the preload.
To examine the settlement of the building only, we can show the relative displacement from the time of adding the building load.
- Go back to the Plan View and right-click on the query point.
- Choose Graph Query and set the Reference Stage to ‘Add building first floor = 1100 d’.
- Click OK.
- In the Chart Controls on the right side of the window, in the Axes section, set the Horizontal Minimum to 1100 and the Horizontal Maximum to 2000.
- Set the Vertical Minimum to -20 and the Vertical Maximum to 20.
- The graph will now look like this:
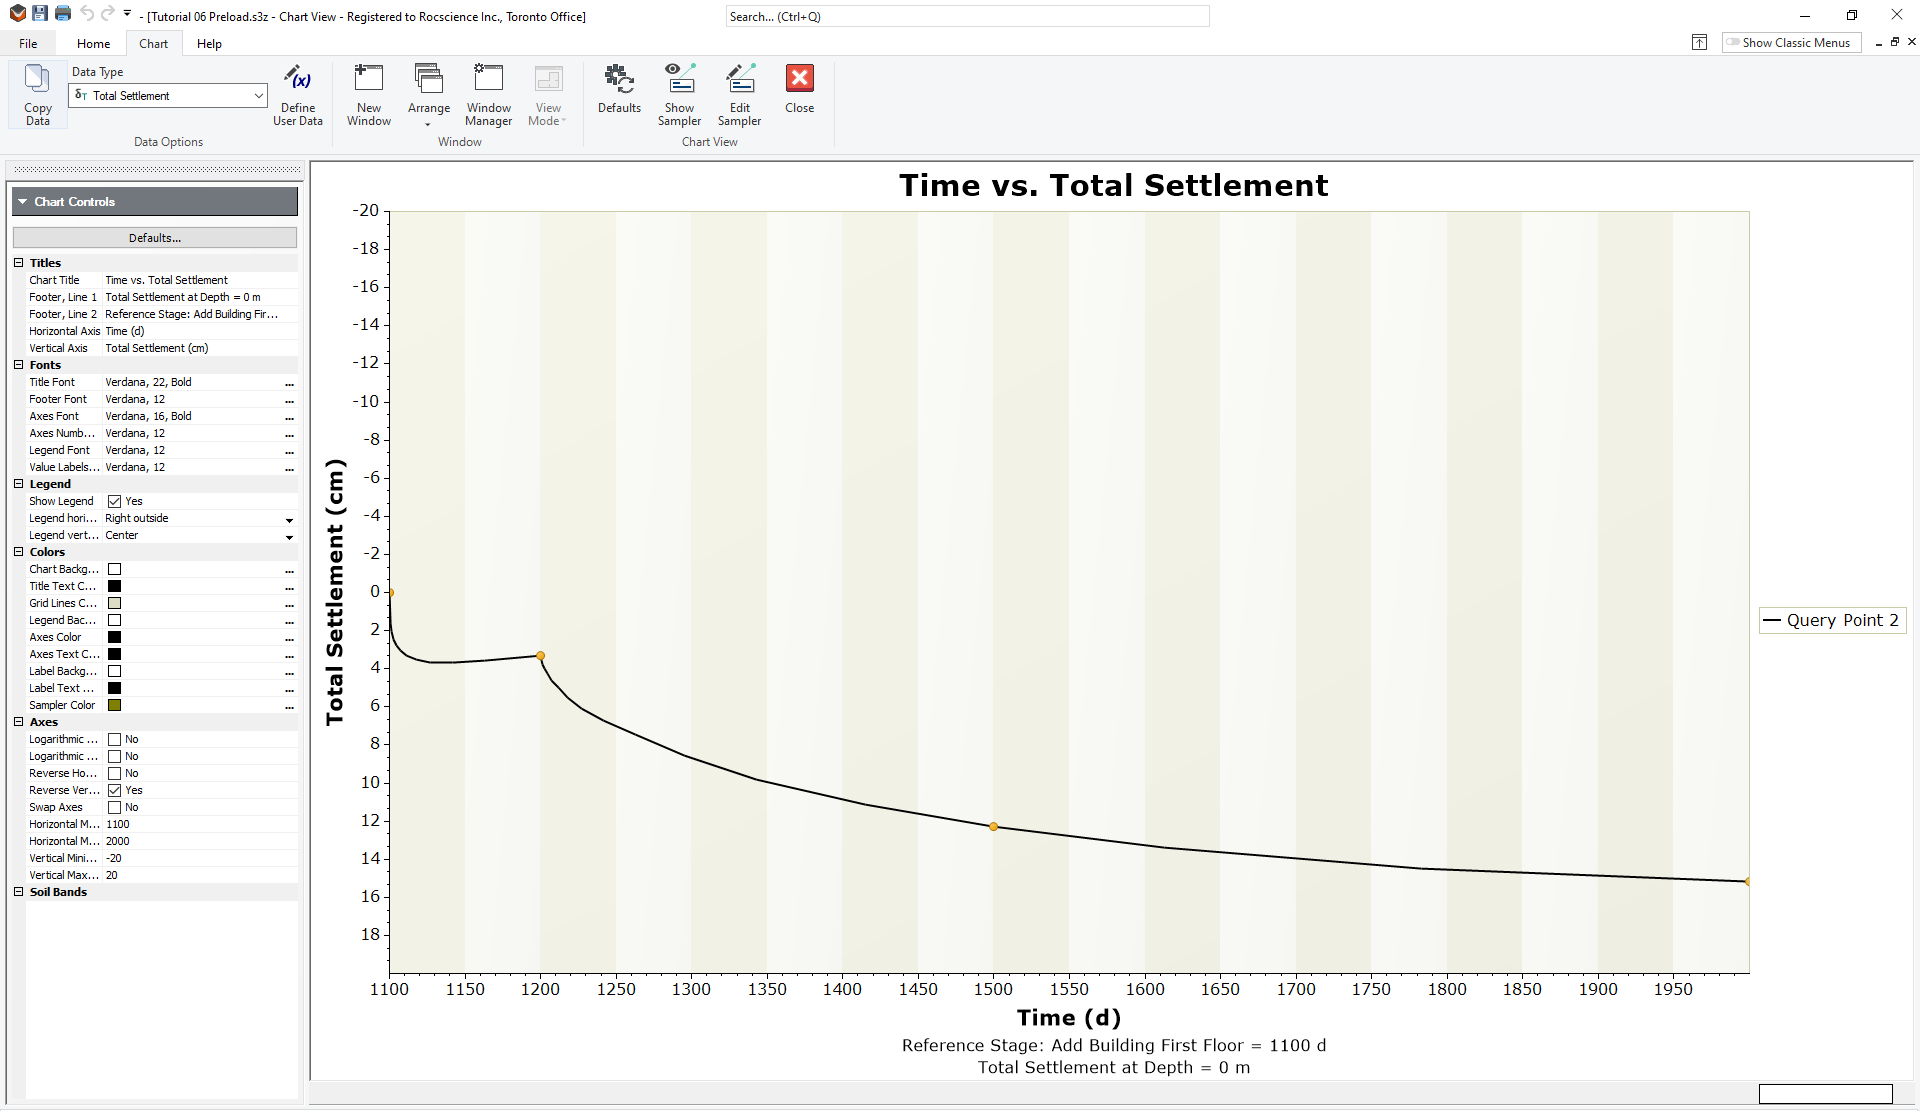
You can see that the settlement due to the building alone is around 15 cm at 2000 days.
5.0 Additional Exercises
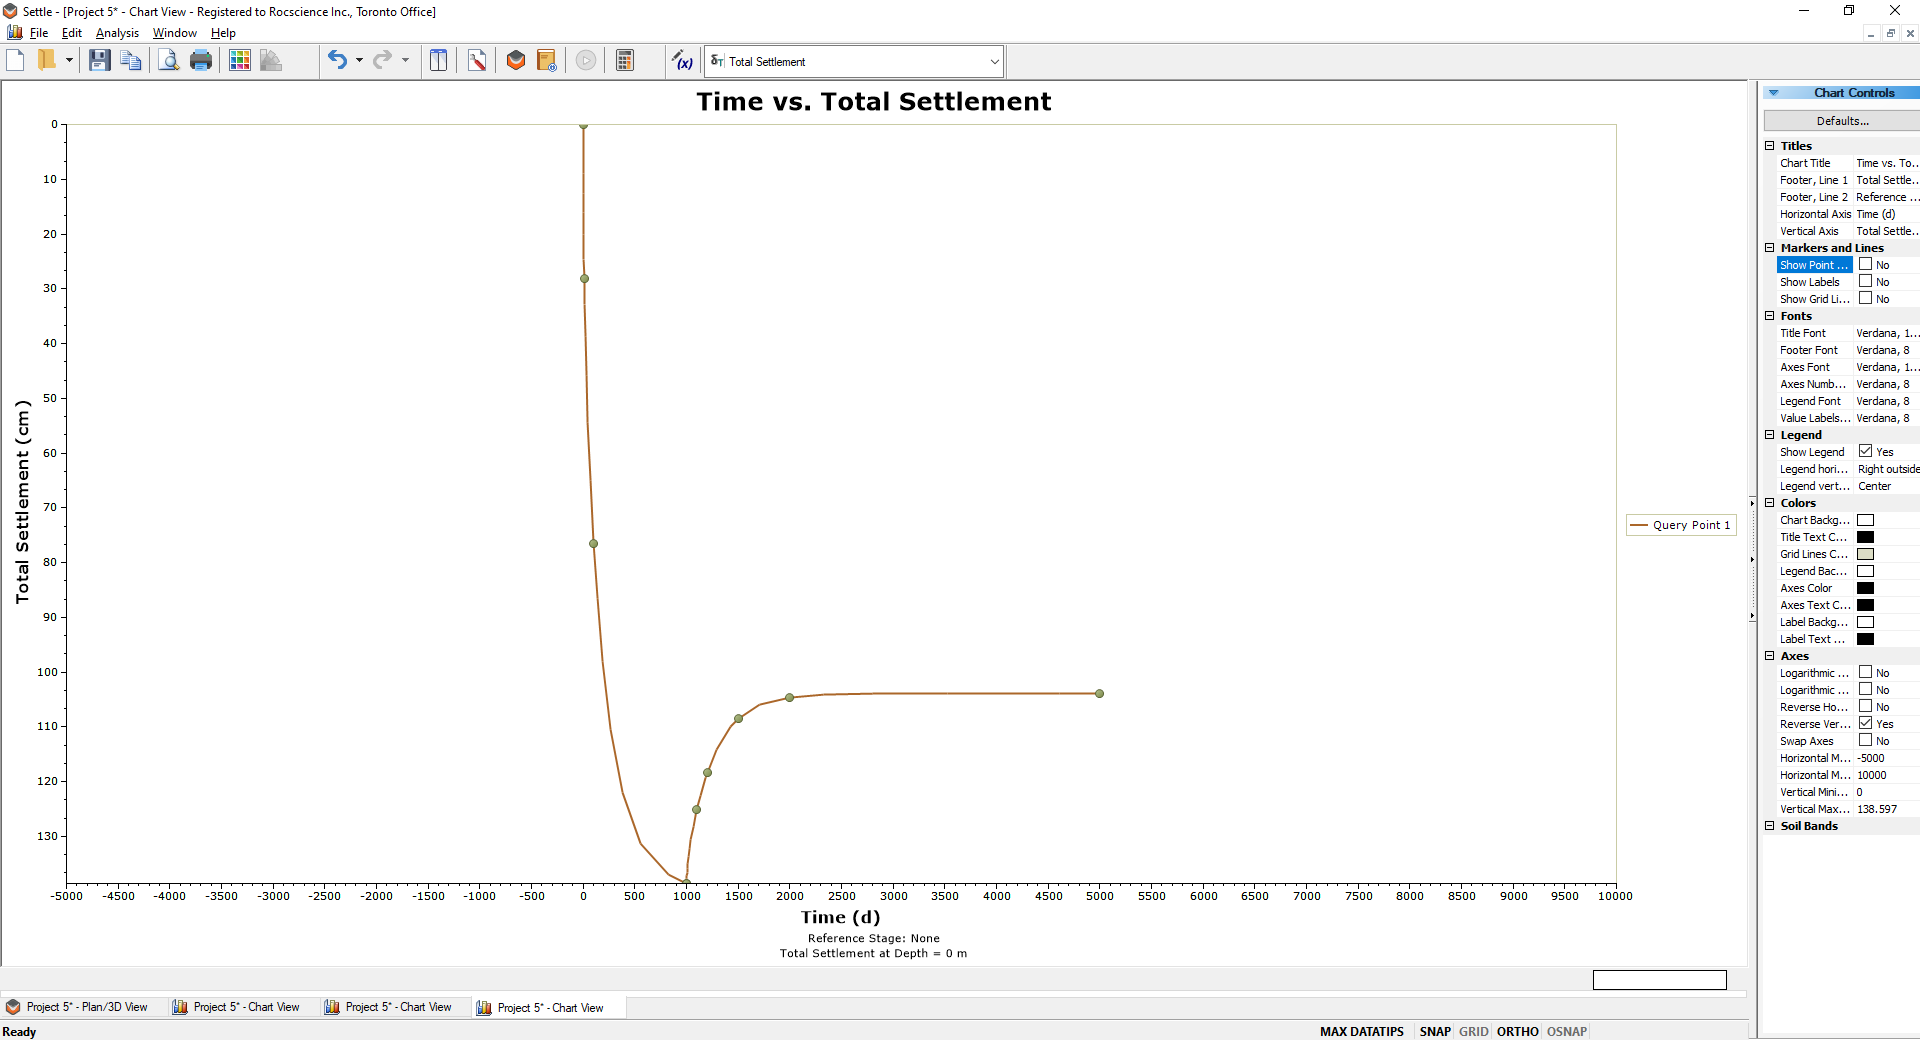
Delete the building load completely and re-run the analysis, to observe the rebound behaviour of the soil after the preload is removed. Add another stage at 5000 days, to observe the long-term rebound behaviour with no building load. You should obtain the following results:
This concludes the Preload tutorial. You may now exit the Settle3 program.