10 - Hydroconsolidation
1.0 Introduction
In California, it is common for housing estates to be constructed on top of thick fill layers used to fill in steep canyons. These fills generally perform well when dry but significant wetting can occur due to irrigation and other urban activities. Depending on the material used for the fill, the introduction of a large amount of water can cause considerable settlement due to the collapse of the soil structure.
This tutorial describes a simplified model of a house that is part of the Villa Trinidad subdivision north of San Diego. The subdivision was built on 70 feet of fill and settlements of up to 12 inches were observed over a ten-year period. The case study is described in Brandon et al. (1990).
Topics Covered in this Tutorial:
- Hydroconsolidation/Collapsible Soils
- Swelling
Finished Product:
The finished product of this tutorial can be found in the Tutorial 10 Hydroconsolidation.s3z file. All tutorial files installed with Settle3 can be accessed by selecting File > Recent Folders > Tutorials Folder from the Settle3 main menu.
2.0 Model Setup
Start the Settle3 program.
2.1 Project Settings
Open the Project Settings dialog:
- Select Home > Project Settings

- Select the General tab. Set the Stress units = Imperial, stress as ksf, and the Settlement units = Inches.
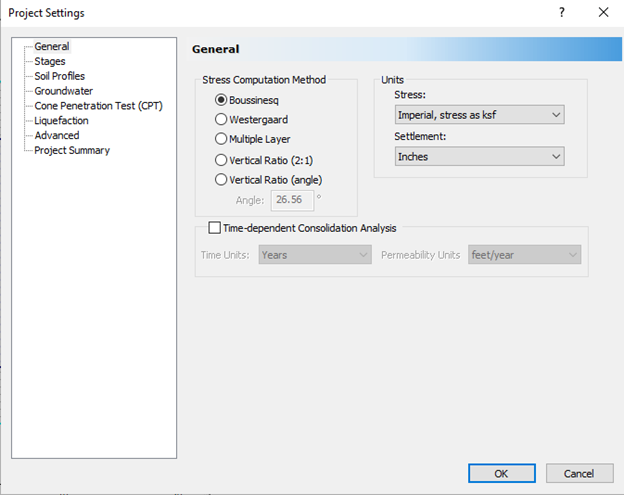
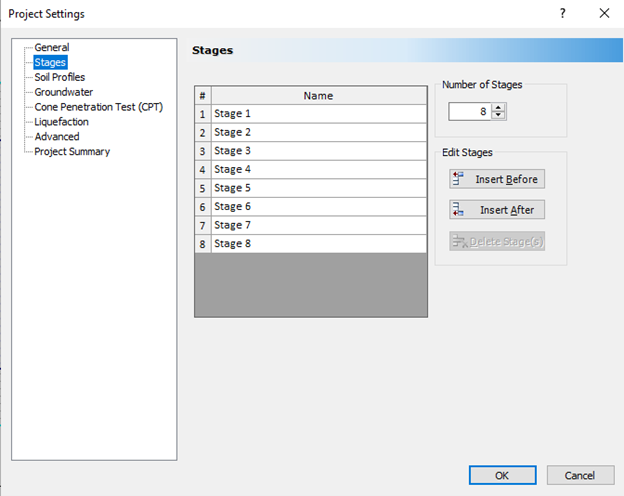
- Click on the Stages tab. Set the Number of Stages = 8.
- Select the Soil Profiles tab. Select the 'Depth below Ground Surface' option.
- Click on the Groundwater tab. Tick the Groundwater Analysis checkbox.
- Click OK to close the dialog.
2.2 Assigning Water Table
- Select Groundwater > Add Piezometric Line

- Enter a Depth of 70 ft. Click OK to close the Assign Piezometric Line to Soils dialog.
- Select Groundwater > Edit Piezometric Lines

- Click the Add
 button to add 7 more piezometric lines. Assign depths of 60, 50, 40, 30, 20, 10, and 0 ft.
 - The dialog should look as follows, and you should have a total of 8 piezometric lines defined.
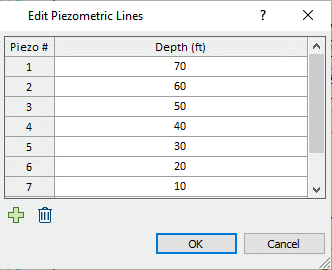
- Click OK to close the dialog.
- Select Groundwater > Soil Groundwater Properties

- Tick the Stage Piezo Lines checkbox. Assign the piezo lines to each stage as shown below.
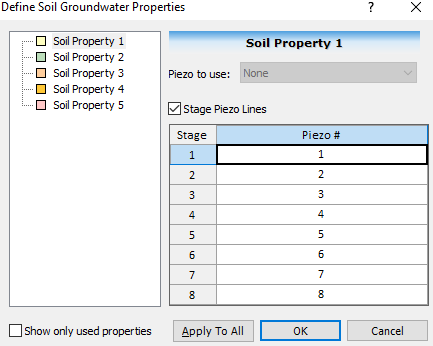
- Click on the Apply to All button, and click OK to close the dialog.
2.3 Soil Properties
We will assume the fill layer is placed on top of stiff rock, therefore we will only model the fill layer. The fill is a compacted clayey sand.
- Select Soils > Define Soil Properties

- Change the name of Material 1 to Fill. Set the Unit Weight to 0.115 kips/ft3 and the Saturated Unit Weight = 0.125 kips/ft3 .
- For this example, we will only consider hydroconsolidation settlement. Uncheck the Primary Consolidation checkbox, so that all settlement types are disabled (immediate, primary, and secondary). The dialog should look as follows.

- Click OK to close the dialog.
2.4 Soil Layers
The thickness of the fill at this site is ~70 feet.
- Select Soils > Layers

- Change the thickness of the soil layer to 70 as shown.
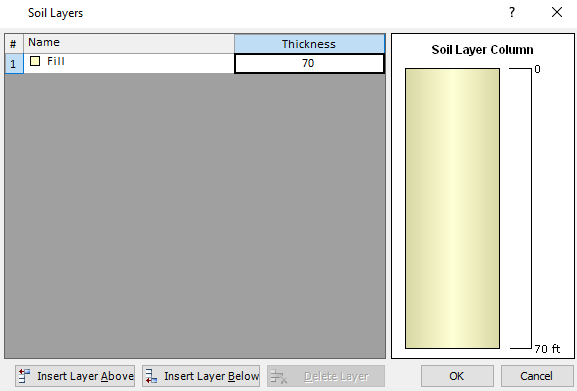
- Click OK to close the dialog.
2.5 Adding a Load
We will simulate building a house in Stage 1.
- Select Loads > Rectangular Load

- Set the Length to 30 feet and the Width to 20 feet. Leave all other values as default as shown.
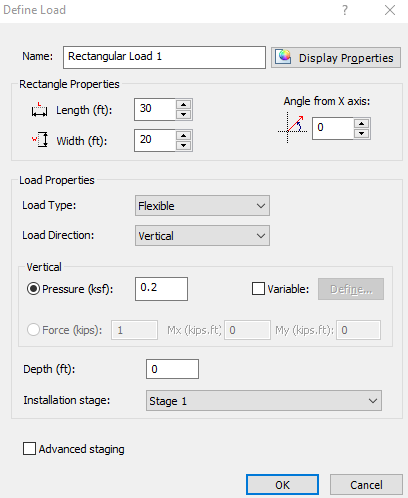
- Click OK.
- Now enter the coordinates 0 0 in the prompt line at the bottom right of the screen and press Enter, to place the center of the rectangular load at the 0,0 coordinate in the Plan View.
- Click in the Plan View and select Zoom All
 (or press the F2 function key) to center the load in the view.
The model should look as follows.
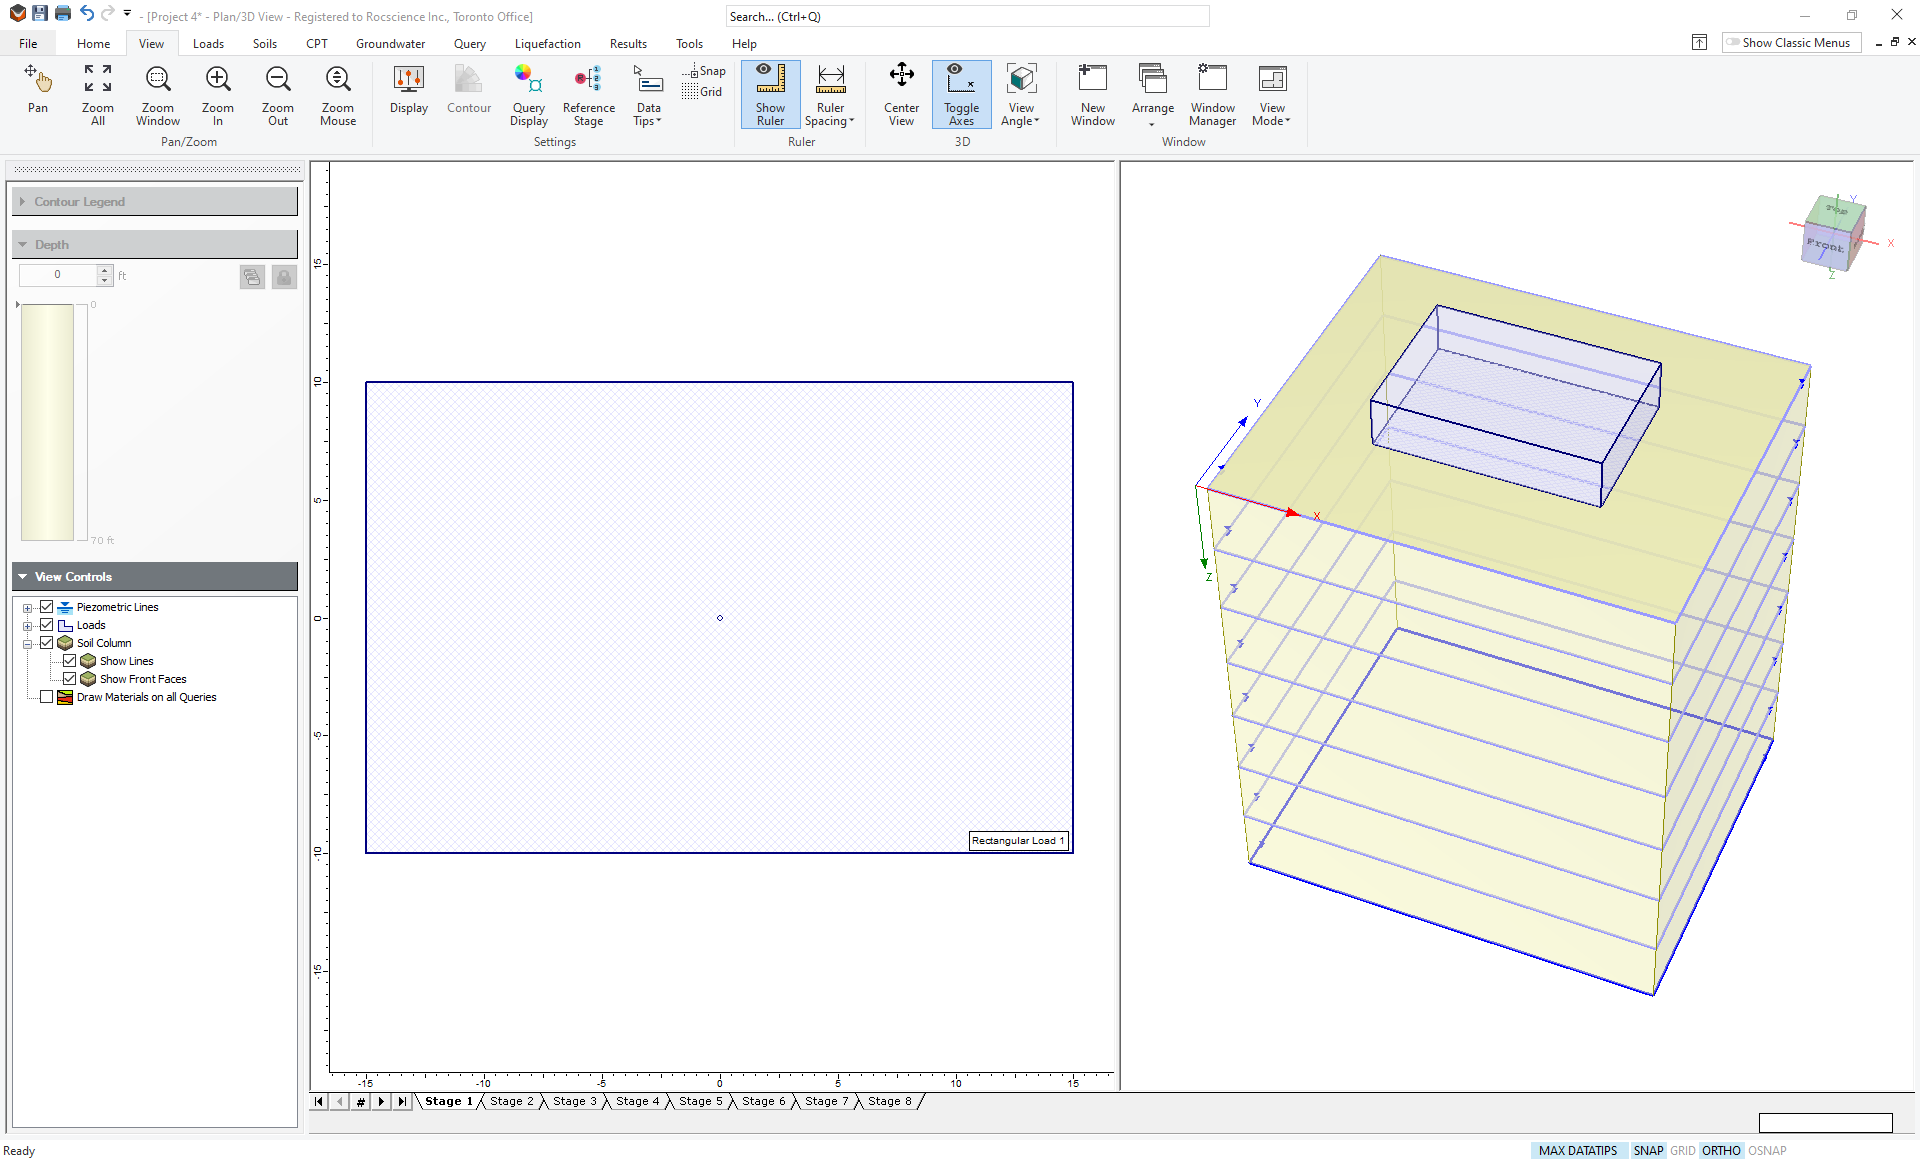
Notice the water table at the bottom of the fill layer. Select the stage tabs 1 to 8, and you will see the water table rise in 10-foot increments to the ground surface.
TIP: You can use the Page Down / Page Up keys to increase or decrease the viewing stage.
3.0 Hydroconsolidation
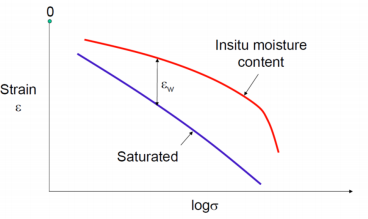
Soil collapse, or hydroconsolidation, occurs when a loose clayey sand is exposed to water and the clay bonds break causing significant volume reduction. The amount of collapse depends on the stress. At very low stresses, these soils may actually experience swelling.
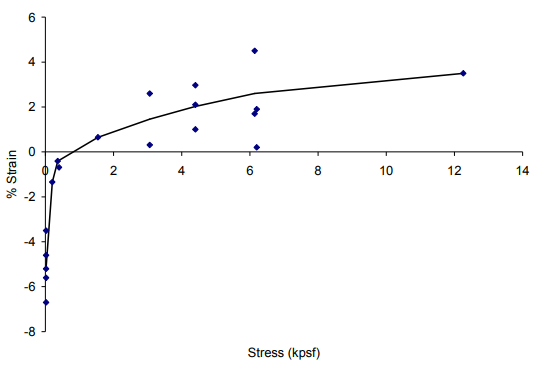
To quantify the hydroconsolidation behaviour, it is common to perform a series of oedometer tests in which the sample is loaded to a certain stress state and then saturated. The change in void ratio (or strain) due to wetting is then measured (see εw in the figure below). From a series of such tests, a curve of compaction versus stress can be created.

Alternatively, one could simply run two oedometer tests: one with ‘dry’ material and one with wet. The difference in the two curves can then be used to get a curve of compaction versus stress (see εw in the figure below).
3.1 Hydroconsolidation Properties
A series of single oedometer tests were conducted on the fill material from the Villa Trinidad site and strain changes due to wetting at different stresses were measured. The results are shown in the figure below with a best-fit curve drawn ‘by eye’.
To enter this data in Settle3:
- Select Groundwater > Define Properties (Hydroconsolidation)

- Make sure the Fill tab is selected. Tick the Consider Hydroconsolidation checkbox.
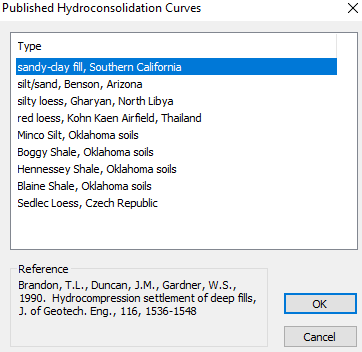
Here you can enter numbers to give the relationship between the amount of collapse (strain) and the applied pressure – usually obtained from laboratory testing. Relationships from published literature can be found by clicking the property assist icon shown to the right. - Click the Property Assist
 icon and you will see a table of possible soil types to choose from.
 - Select sandy-clay fill.
- Click OK and you will see the following chart:
- Click OK to close the dialog.
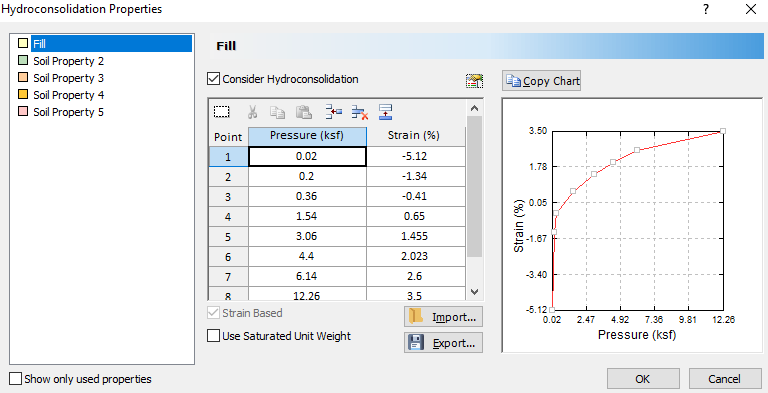
TIP: For a non-linear material, you can enter changes in strain OR changes in void ratio. For a linear material you can only enter changes in strain because you do not specify an initial void ratio.
3.2 Hydroconsolidation Region
Hydroconsolidation occurs due to a localized increase in moisture content possibly due to irrigation, raising of the water table, broken water pipes, etc. The region over which this wetting occurs must be specified in Settle3.
- Select Groundwater > Add Region (Hydroconsolidation)

- In the dialog, click on the Wetting Stage combo box, and choose the Use Water Table Only option. This means that hydroconsolidation will only occur due to raising of the water table.
- We will assume the entire fill depth is a collapsible soil, so leave the top and bottom depth as 0 and 70.

- Click OK to close the dialog.
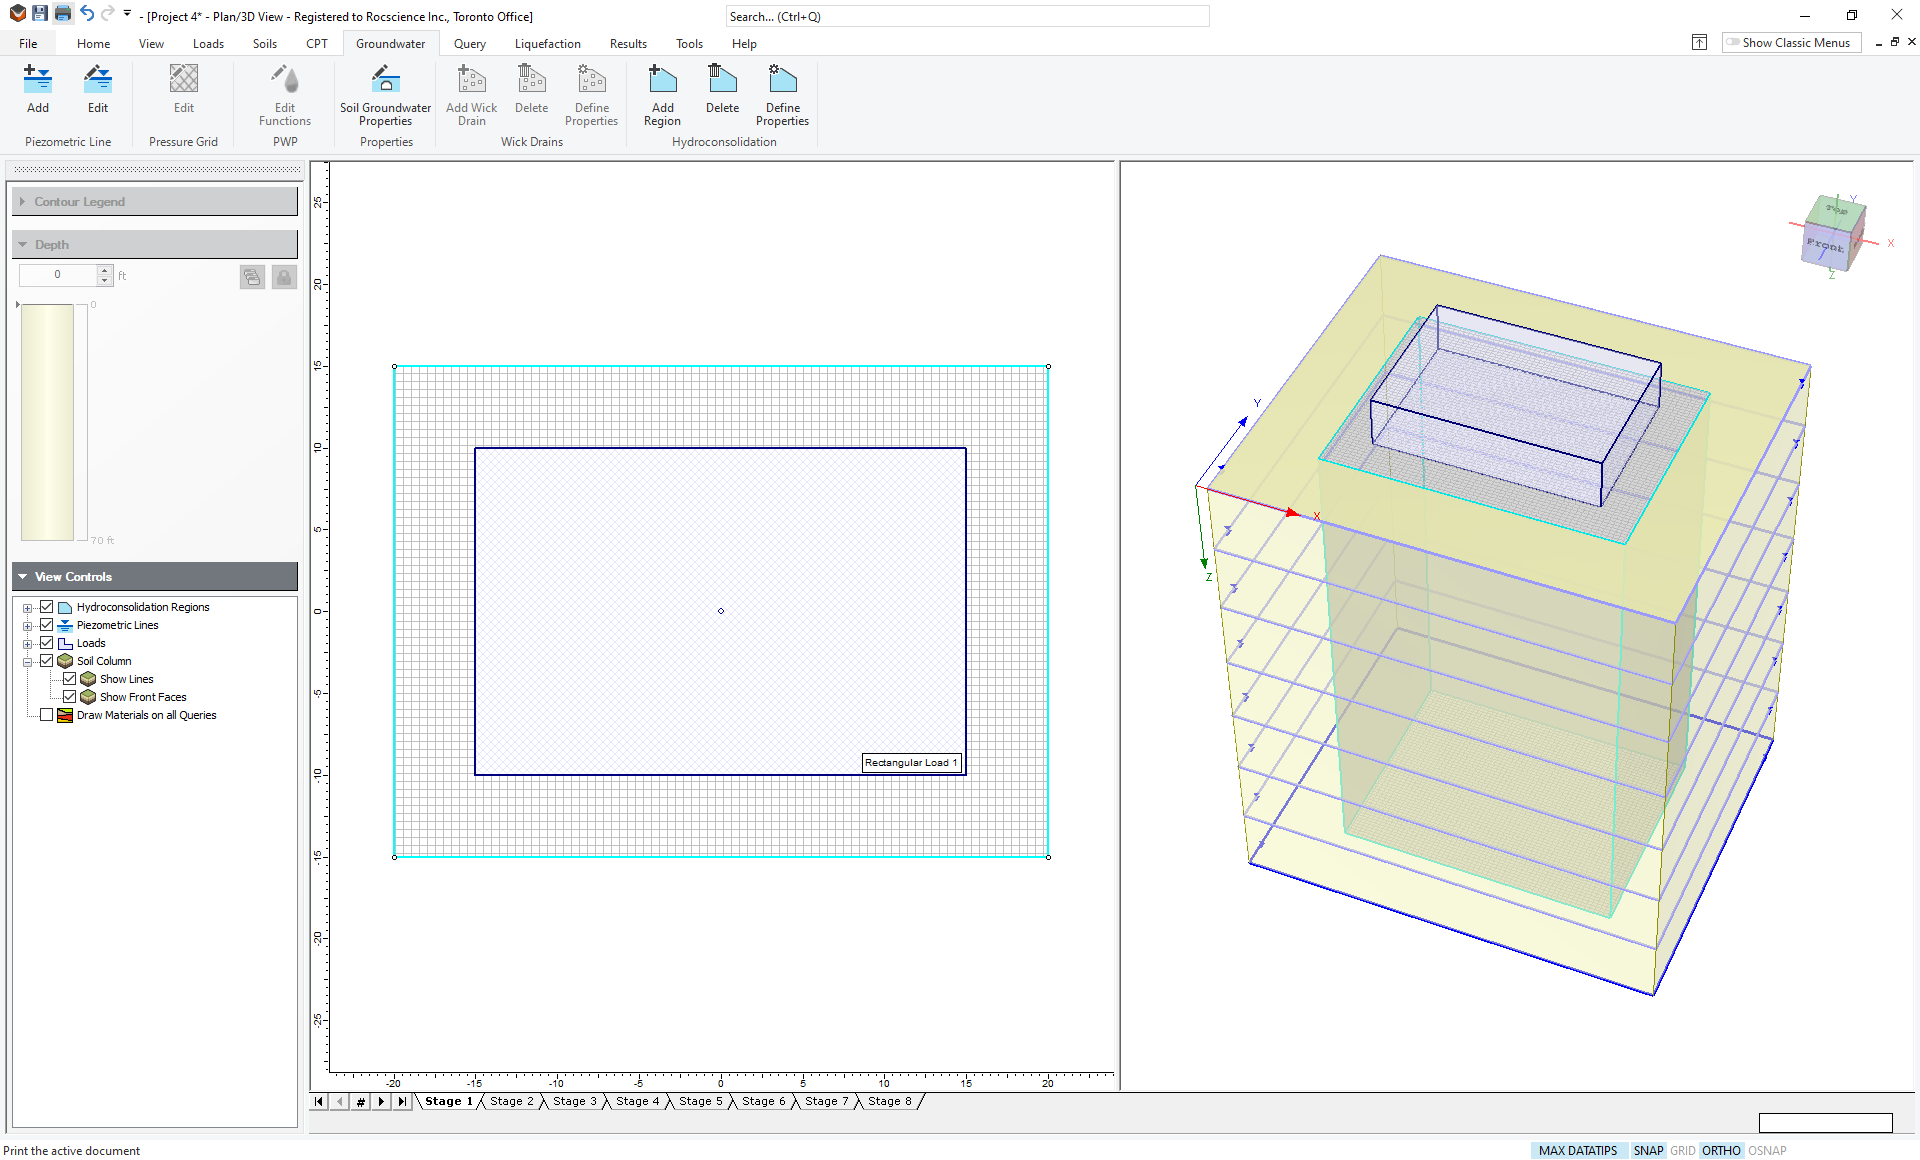
- You now need to draw a polygon in the Plan View to delineate the wetted region. We want to fully enclose the house so you may need to zoom out (use the middle mouse wheel). Enter the following coordinates to define the hydroconsolidation region:
- (20, 15)
- (-20, 15)
- (-20, -15)
- (20, -15)
- c (for close)
The model should look like this:
4.0 Computation and Results Visualization
To obtain results, we will add a point query to the center of the load.
- Select Query > Add Point

- Leave the default Automatic setting, and select OK in the dialog.
- Now click on the center point of the load to add the query to the model.
Go to the Results tab and select Hydroconsolidation Settlement from the drop down men of data types. Click on the stage tabs 1 to 8, and observe the progress of the hydroconsolidation settlement, as the water table is raised. For stage 8 the results should look as follows (uncheck Soil Columns > Show Front Faces in the View Controls).
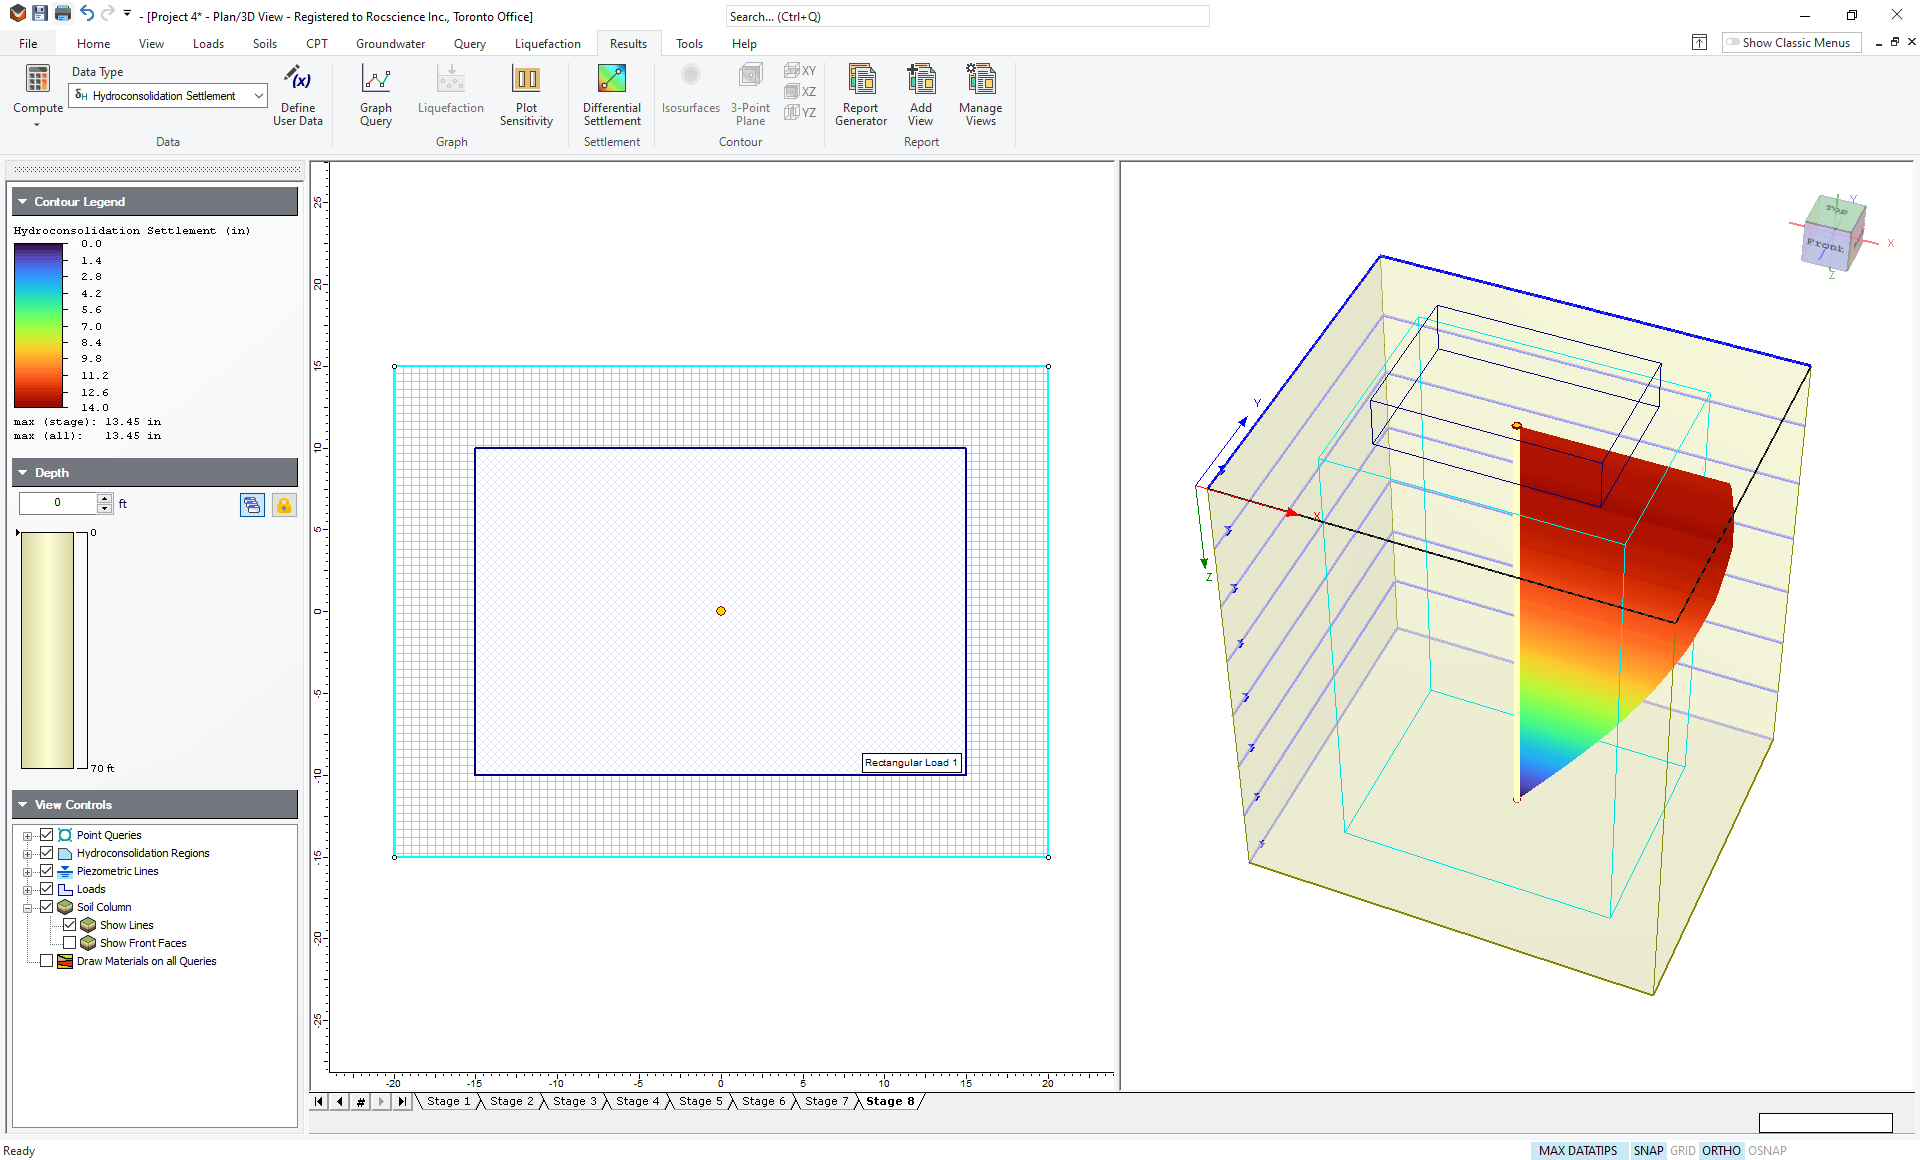
The maximum settlement is 13.45 inches, which is close to the 12 inches of settlement observed at the actual site. The discrepancy may be due to several factors:
- The entire depth of 70 feet may not have been wetted at the site.
- The fill may not have become completely saturated at the site.
- The best-fit line chosen to represent the strain versus stress laboratory data may not be the best choice.The lab data showed considerable scatter so it would probably be better to run two models using upper and lower bound curves for the lab data to get an estimate of maximum and minimum possible settlements (see Brandon et al., 1990).
- The lab data may not be perfectly representative of the soil properties in-situ.
Nevertheless, Settle3 gives a reasonable estimation of settlement due to hydroconsolidation at the site.
Now let’s graph the results.
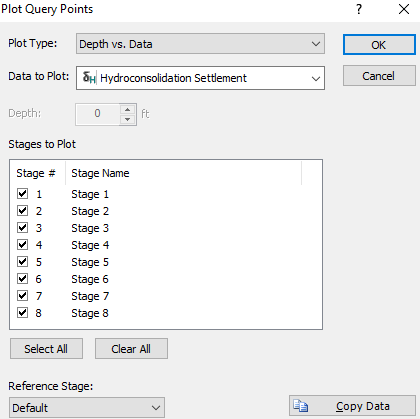
- Right-click on the point query and select Graph Query from the popup menu.
- Choose the Select All button to plot all stages.
- Click OK.
You should see the following plot:
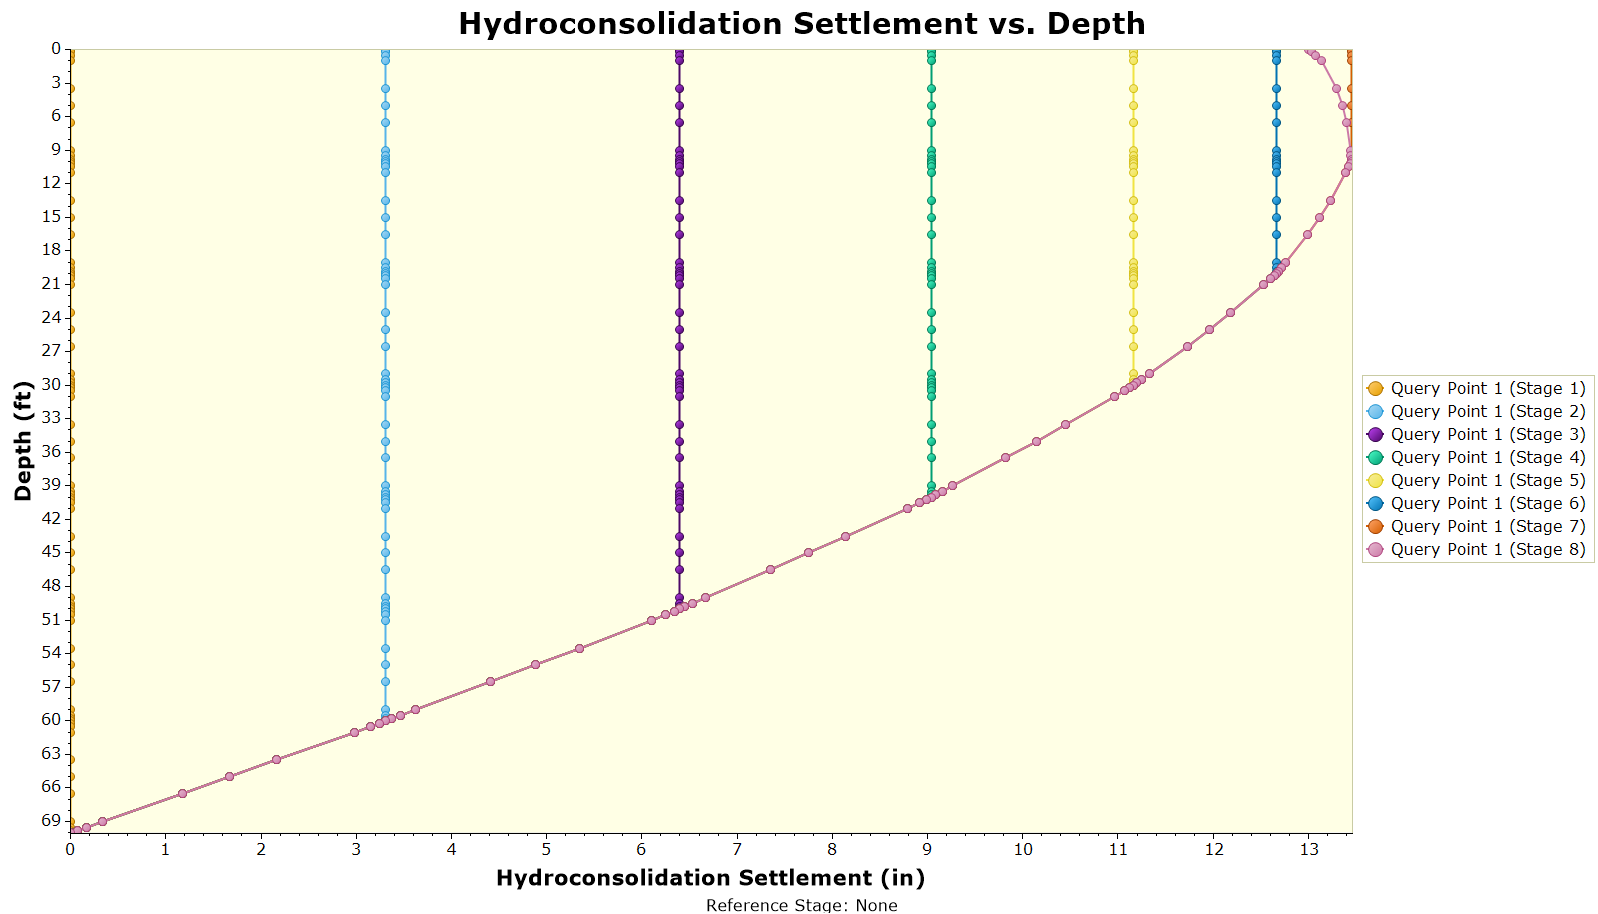
This clearly illustrates the progress of the hydroconsolidation settlement as the water table is raised. It is interesting to note that at the final stage, near the ground surface, swelling occurs, rather than consolidation, due to the low-stress level (recall that the hydroconsolidation curve for this material indicates negative strains at low-stress levels).
5.0 Further Analysis
To simplify this example, we turned OFF all other settlement types in the Soil Properties dialog. Therefore the Total Settlement is equal to the Hydroconsolidation settlement. You can verify this by viewing the Total Settlement results.
For collapsible soil, you can still define soil properties for immediate settlement, primary or secondary consolidation. This allows you to simultaneously analyze all modes of settlement. This is left as an optional exercise to explore.
Finally, note that hydroconsolidation settlement can only occur ONCE for a given material, the first time it is wetted. If the water table is raised, lowered and then raised again, hydroconsolidation will only occur once.
This concludes the tutorial; you may now exit the Settle3 program.
6.0 References
Brandon, T.L., Duncan, J.M., Gardner, W.S., 1990. Hydrocompression settlement of deep fills, Journal of Geotechnical Engineering, 116, 1536-1548.