18 - Ground Improvement - Pt 2: Stone Columns
1.0 Introduction
This tutorial introduces the Ground Improvement feature in Settle3 that allows users to specify regions where they want to improve the ground using the Stone Columns technique.
By the end of this tutorial, you should know how the Stone Columns feature works, what parameters are required to implement it, and how to model it in an embankment in different stages.
Topics Covered in this Tutorial:
- Embankment Designer
- Advanced Embankment Staging
- Adding Stone Columns to a Region
- Ground Improvement Sensitivity Analysis
Finished Product:
The finished product of this tutorial can be found in the Ground improvement in embankment design part2_final.s3z file. All tutorial files installed with Settle3 can be accessed by selecting File > Recent Folders > Tutorials Folder from the Settle3 main menu.
1.1 Model Description
Our model will consist of a 4.0-meter-high embankment above a 1.0-meter-thick crust that sits on top of a 19.0-meter-thick soft soil layer. The top width of the embankment will be 40.0 meters and constructed with a 1:2 slope gradient (vertical: horizontal).
Staging will be used to install the embankment after ground improvement is applied at the beginning phase.
During the course of this tutorial, we will apply Stone columns to a depth of 10.0 meters, affecting both the crust layer and the soft soil layer.
2.0 Model
2.1 Project Settings
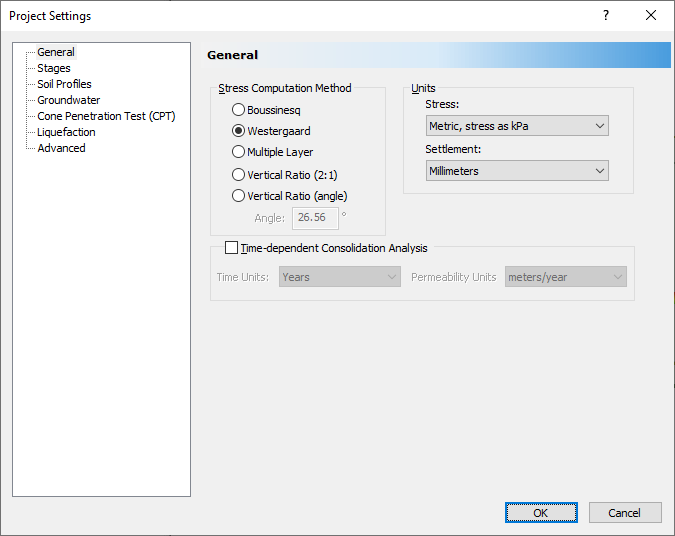
Prior to creating the model geometry and declaring the material properties, we configure the Project Settings to fit the needs of the model. First, we select a Stress Computation Method to be used for analysis through the Project Settings General tab.
- Select Home > Project Settings

- In the General tab, select Westergaard as the Stress Computation Method.
- Set Units for Stress as Metric, Stress as kPa and Units for Settlement as Millimeters.
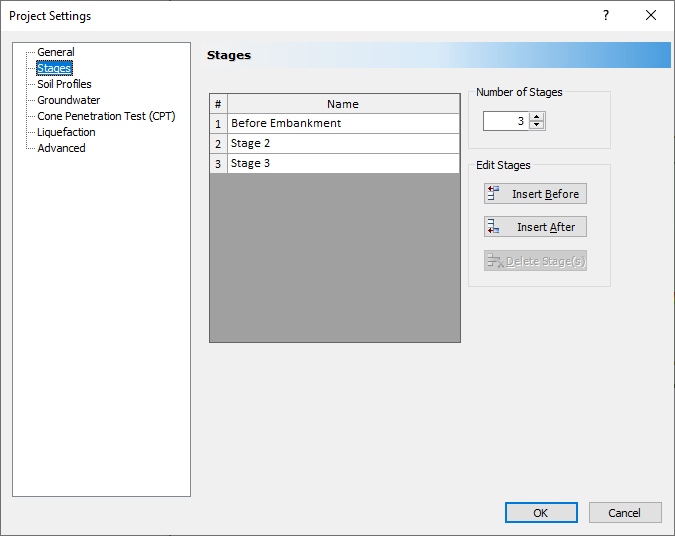
- Select the Stages tab and set the Number of Stages to 3 with the name of the stages as shown below. Rename the first stage to 'Before Embankment' as shown below:
- Select the Soil Profile tab. Select the 'Depth below Ground surface' option.
- Click OK. As an indication that the Staging option is enabled, you should see the following three tabs in the bottom-left corner of the application window
![]()
2.2 Soil Properties
We next set up the soil properties of the model using the Soil Properties dialog.
As per K.S. Ng & S.A. Tan, the topmost layer of the model is made of a 1.0-meter-thick crust. The layer underneath consists of soft soil with a thickness of 19.0 meters.
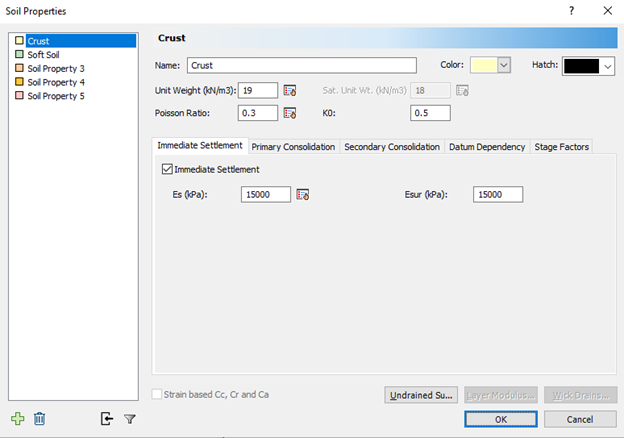
- Select Soils > Define Soil Properties

- Make sure the Immediate Settlement check box is selected for Crust only.
- Enter the following properties shown in the table below for the Crust soil layer in the Immediate Settlement tab.
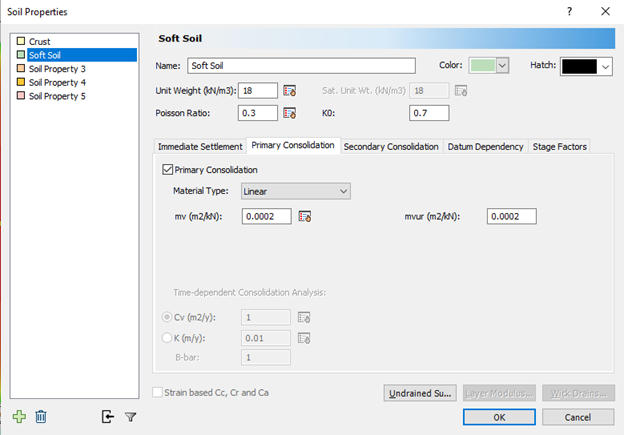
- Then, make sure Primary Consolidation is selected for Soft Soil in the Primary Consolidation tab.
- Secondary Consolidation should not be selected.
- Enter the following input values for soft soil.
Soil |
Unit Weight (kN/m3) |
Poisson's Ratio |
K0 |
Es (kPa) |
Crust |
19 |
0.3 |
0.5 |
15000 |
Soil |
Unit Weight (kN/m3) |
Poisson's Ratio |
K0 |
mv (m2/kN) |
Soft Soil |
18 |
0.3 |
0.7 |
0.0002 |
The dialog should appear as shown:
2.3 Soil Layers
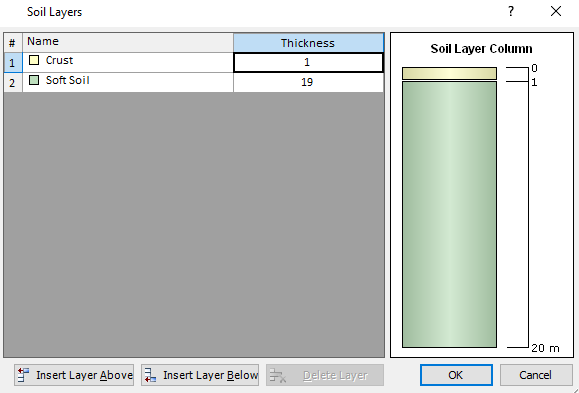
After defining the material properties, we create the soil strata, using the Soil Layers dialog.
- Select Soils > Layers

- Enter Thickness as 1 for crust.
- Click the Insert Layer Below button to add a new layer to the list.
- Select Soft Soil in the Name drop-down and enter Thickness as 19.
- Click OK.
By default, the dialog has the first layer defined with the first material defined in Soil Properties selected.
3.0 Embankment Load
3.1 Assign Embankment Load
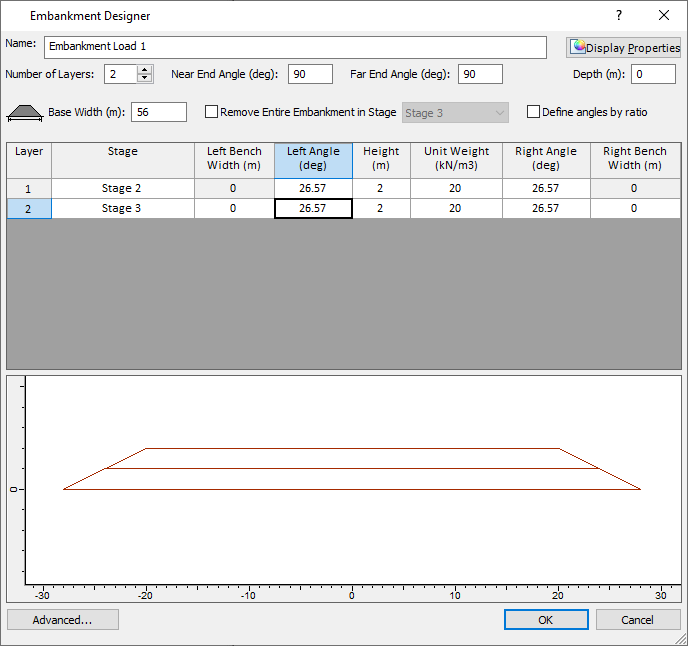
Next, we assign an embankment load to the soil using the Embankment Designer.
- Select Loads > Loads by Layer
 to open the Embankment Designer.
 - Leave the Name as Embankment Load 1.
- Enter the following:
- Near End Angle (deg) = 90
- Far End Angle (deg) = 90
- Base Width (m) = 56
- Change Number of Layers = 2.
- In the Stage drop-down select Layer 1 as Stage 2 and for Layer 2 assign Stage 3.
- For both layers, set:
- Left Angle (deg) = 26.57
- Right Angle (deg) = 26.57
- Unit Weight (kN/m3) = 20
- In the Height (m) column, set Layer 1 = 2.0, and Layer 2 = 2.0.
- Click OK to save the changes and close the dialog.
You should see two more rows added to the Layer table.
You will see the following dialog:
In case you can't see the shape of the embankment, try to zoom out of the model view by scrolling down on the model view with a mouse scroll.
3.2 Pick Near/Far Points
After adding the embankment load, you’re prompted to pick the near/far points of the embankment centerline. Since the Embankment Designer only addresses cross-sectional geometry, we account for the length of the embankment by specifying the near/far point of the embankment centerline.
- Since the original paper by K.S. Ng & S.A. Tan considered this as a 2D problem, we arbitrarily select the two points:
- {0,0} as the near point of the embankment; and
- {0,115.27} as the far point.
After inputting the near and far points of the embankment centerlines, Settle should automatically generate your model as so:

4.0 Grid
4.1 Assign Embankment Load
Now we will assign a field of grid points to our model using the Auto Field Point Grid function.
- Select Query > Auto Field Point Grid

- Change Autogrid Expansion Factor to 1.
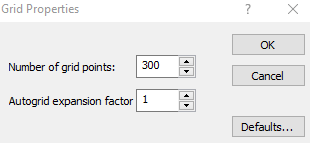
- Click OK and Save the model with a different file name.
5.0 Compute
Next, we’ll compute the model to view the results of the settlement analysis. But first, we’ll add a query point to the center of the embankment so that we can it at a later time as a reference point for a Sensitivity analysis.
To add the query point:
- Select Query > Add Query Point

- In the Query Point dialog, keep the default values and click OK.
- When prompted to enter a coordinate for the point, enter {0,57.635}
- Select Results > Compute


Now we’re ready to compute.
Your model should take a few seconds to compute and you should see the following:

In the Sidebar on the right of the application legend, in the Contour Legend panel, you should see that Settle3 has calculated a Total Settlement of 240.0 mm. This value will act as our baseline for comparison to see how much of an improvement in the settlement we get after implementing Stone Columns in the next section.
6.0 Ground Improvement - Stone Columns
We will now add Stone Columns to the model using the Add Improvement Region dialog.
- Select the Before Embankment tab in the bottom-left corner of the application window.
- Select Soils > Ground Improvement > Add Ground Improvement Region. The Ground Improvement Region dialog appears.
- Select Stone Columns as the Ground Improvement Method. A Column Placement section appears.
- Keep Top Depth = 0 m.
- Change Bottom Depth to 10.0 m.
- Set Spacing = 2 m and Pattern = Square.
- Under Column Property, set Diameter = 1.0 m and Elastic Modulus = 50000 kPa.
-
Make sure Before Embankment is selected as the Stage In.
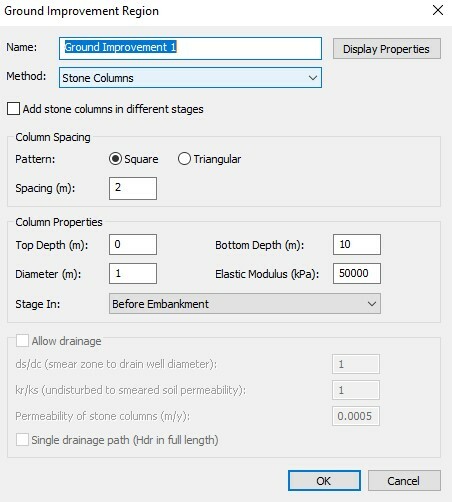
- Click OK.
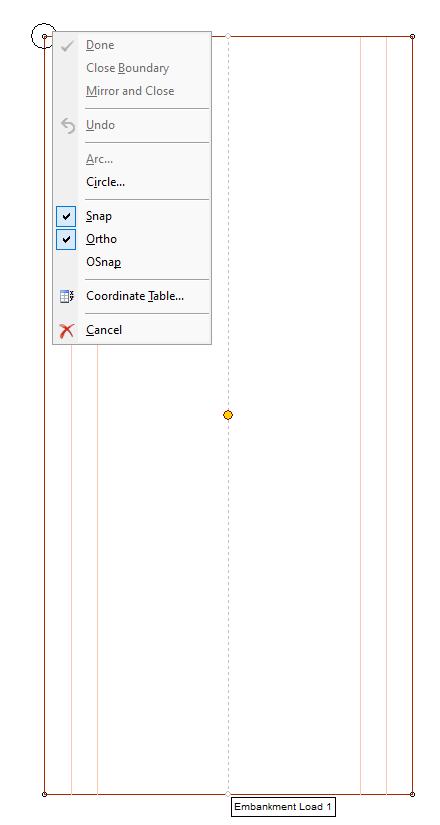
- Once the Stone Columns parameters are entered, you will be prompted to apply the Ground Improvement Region to the model. You should see the mouse cursor turn into crosshairs.
- Right-click on the model in the left-hand panel (the 2D view) and make sure Snap is selected.
- Mouse over the top-left corner of the embankment in the left panel until the cursor snaps to the point and a circle appears, click and repeat for the remaining three corners to fully enclose the embankment region with Stone Columns.
- Save the model.
- Now we’ll re-compute the model and compare it with the results from before applying the Stone Columns.
- Select the Stage 3 tab in the bottom-left of the application window.
- Select Results > Compute

Recall our baseline is a Total Settlement of 240.0 mm.
You will see an updated contour plot below the embankment and a new Total Settlement of 198.3 mm on stage 3.
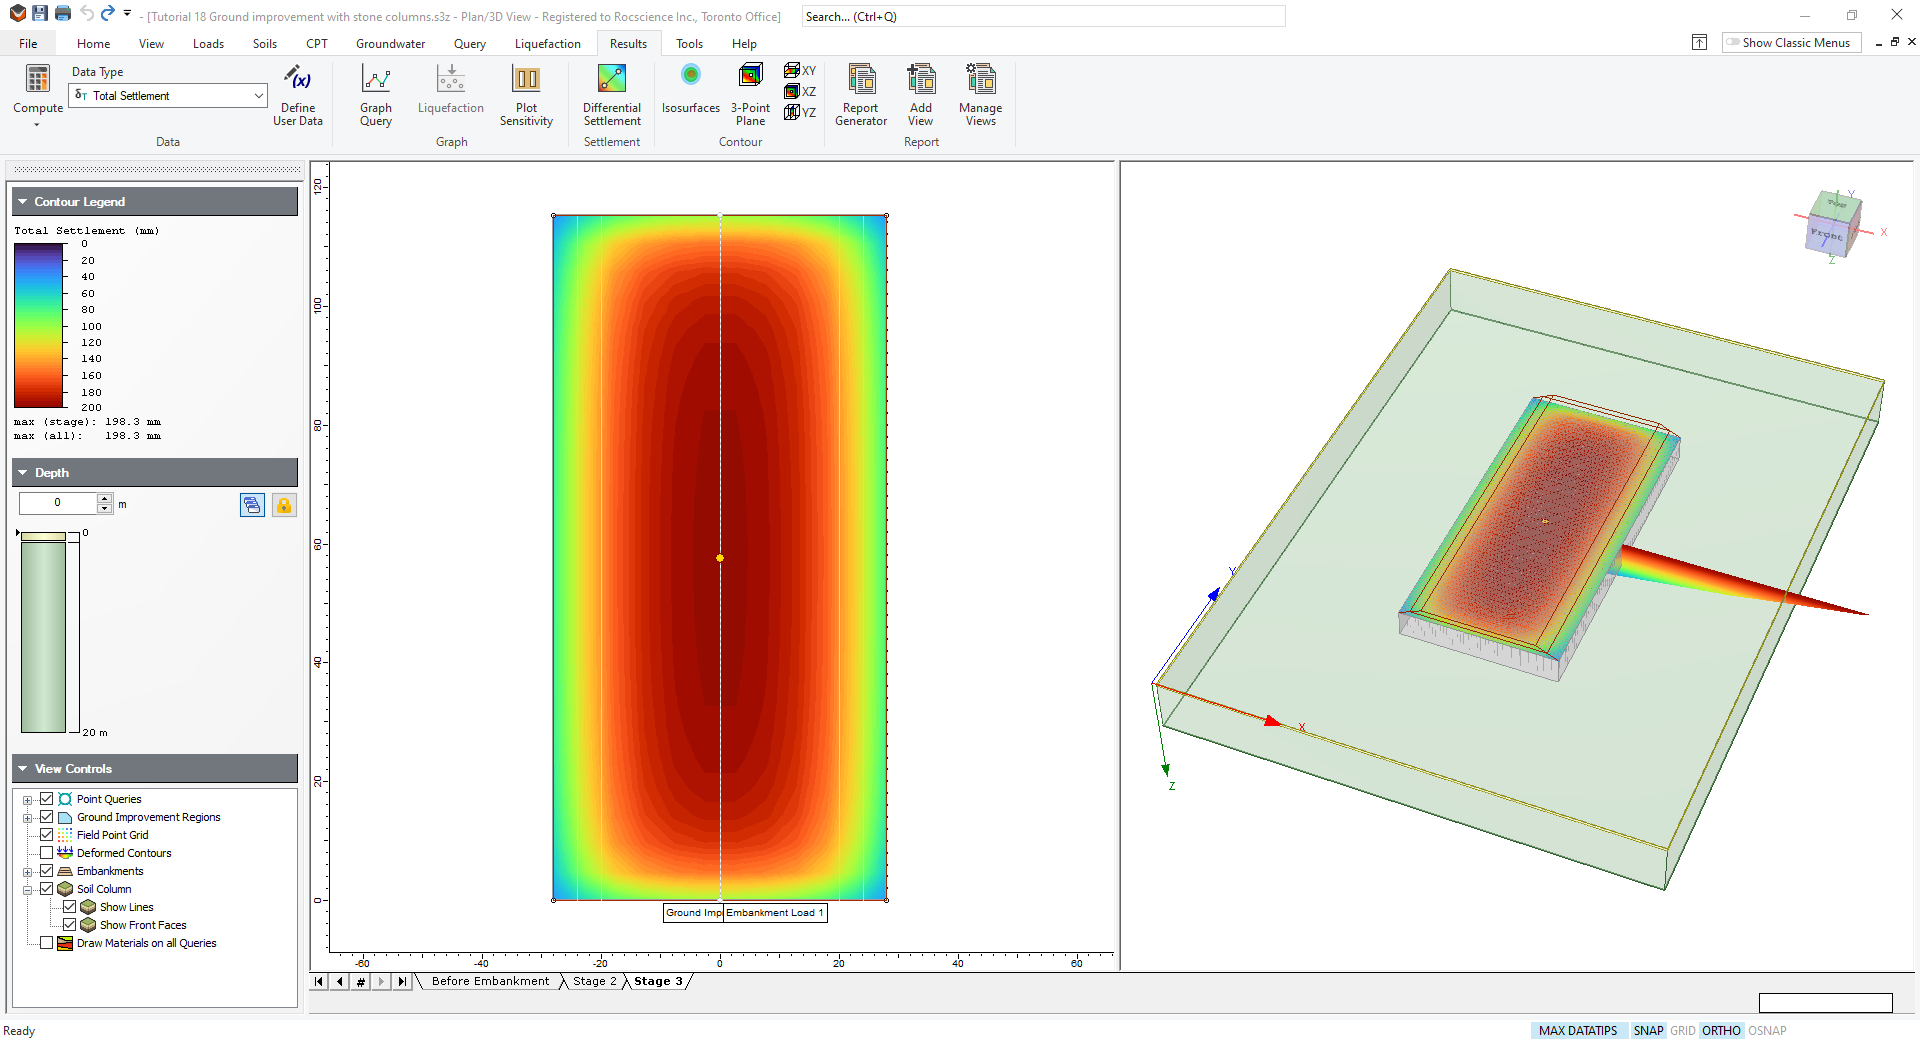
By implementing Stone Columns to a depth of 10.0 m over the entire embankment area prior to constructing the embankment, we have decreased our Total Settlement by approximately 17% from 240.0 mm to 198.3 mm. In practice, it should be noted that each ground improvement method has its own criteria for suitability and effectiveness for different soil types. This analysis was done just to showcase the new ground improvement feature in Settle3.
7.0 Sensitivity Analysis
Now we will conduct a sensitivity analysis for a couple parameters from the Ground Improvement Region dialog.
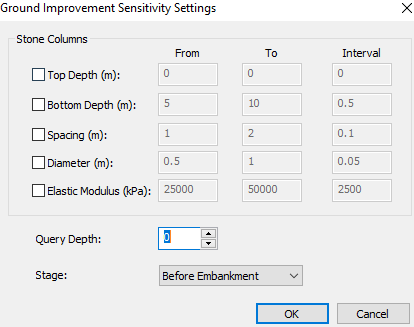
To access the Ground Improvement Sensitivity option:
- Right-click on the query point located at the center of the embankment load and select Graph Ground Improvement Sensitivity

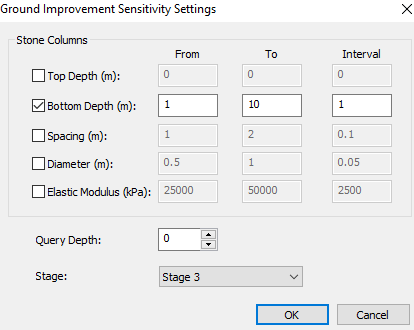
- First, we will consider Bottom Depth by itself. Select the checkbox for Bottom Depth to turn the option ON.
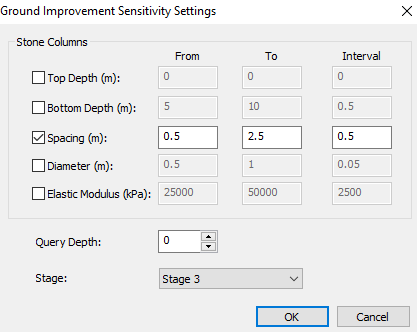
- Now the fields From, To, and Interval are available to be customized by the user. For our purposes, we will set the Bottom Depth starting point from 1 to a maximum of 10 with an interval of 1. Also, we must set the Stage dropdown as Stage 3 to consider the full load from the embankment. Your dialog should look like the following.
- Click OK to close the dialog and generate the sensitivity plot.
- Right-click anywhere on the plot and select Sampler > Show Sampler to display the values along the graph.
- Select Plan/3D View

- Right-click the query point once more and select the Graph Ground Improvement Sensitivity to open the dialog.
- Select the checkbox next to Spacing (m). Insert the following values.
- From = 0.5
- To = 2.5
- Interval = 0.5
- Click OK to generate the sensitivity plot.

The following dialog appears and lets the user select the parameter they wish to include in the sensitivity analysis. For the purposes of this tutorial we will only consider the Bottom Depth first, then the Spacing after.
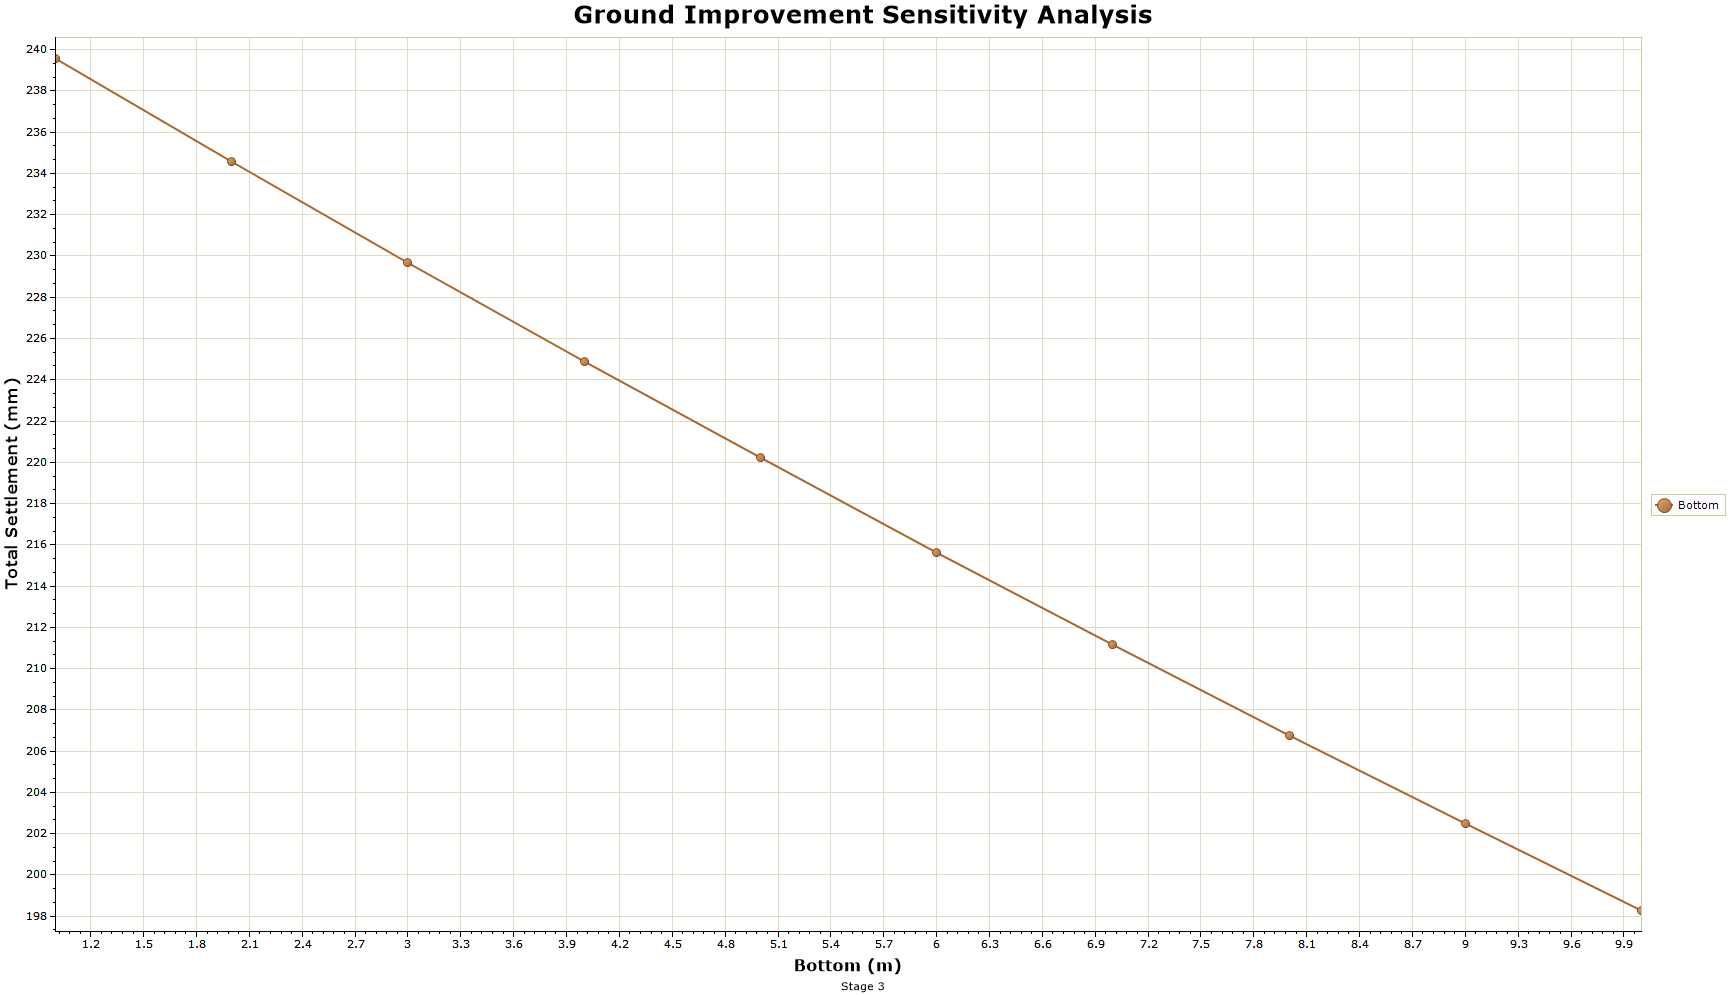
Now if you hover over the plot the values for both Total Settlement and Bottom should be displayed. As expected, by increasing the bottom depth of the stone column, the more soil is improved which leads to a decrease in total settlement.
Now we will exit the sensitivity plot and go back to the model to select a different parameter for analysis. On the toolbar, select the Plan/3D View icon to revert back to the original model.
 '
'
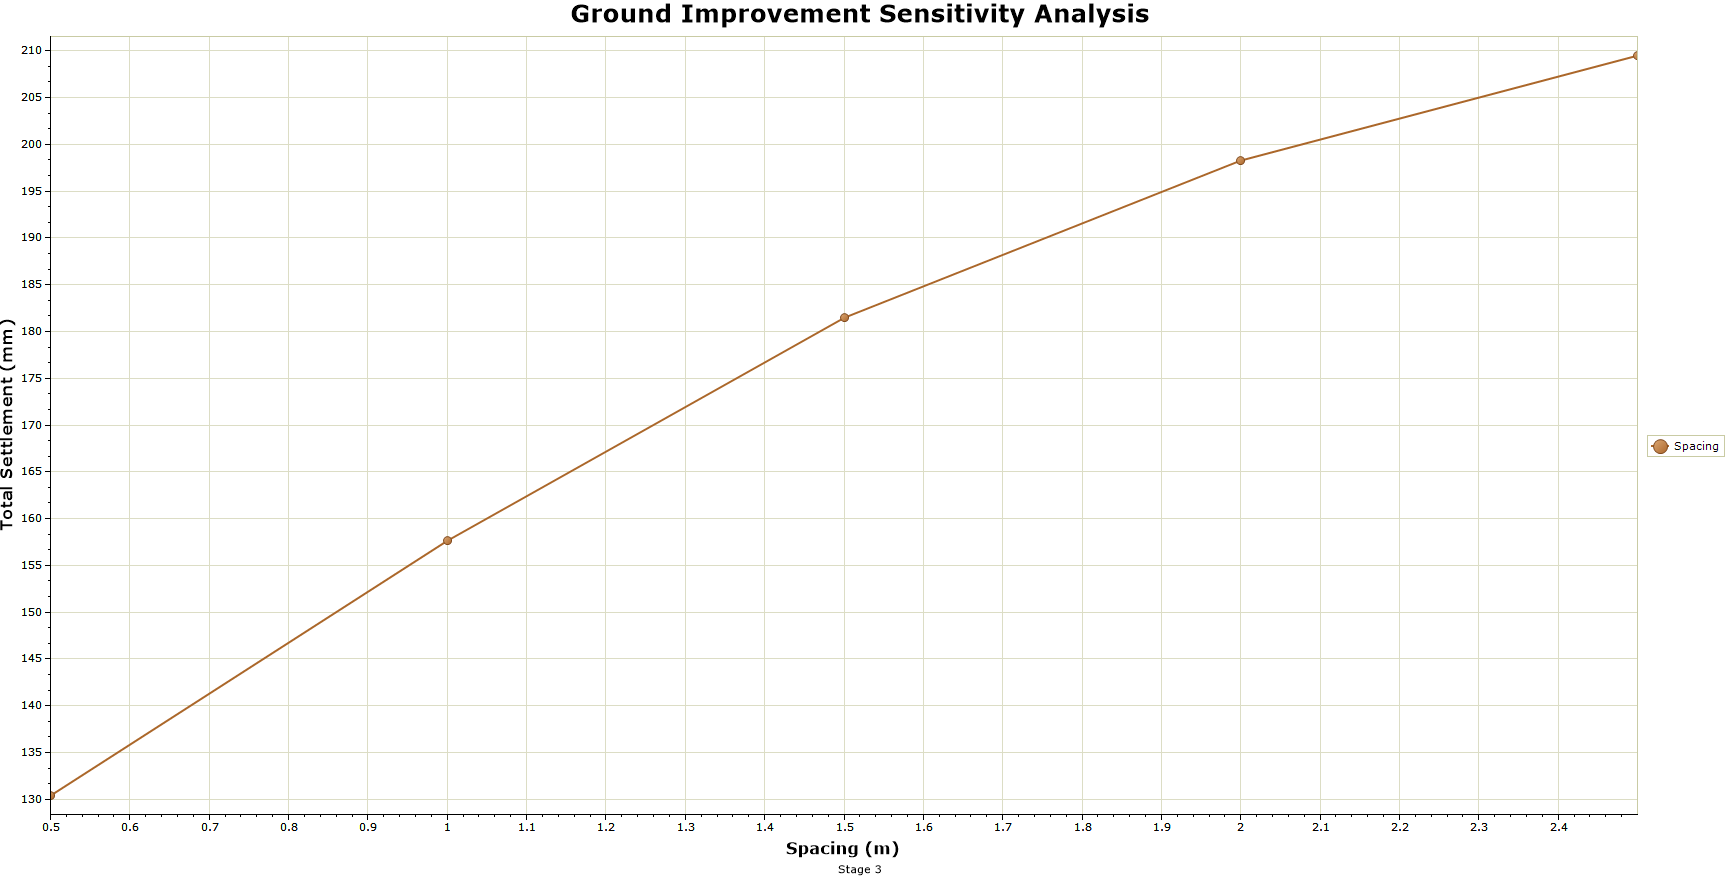
By analyzing the plot we can see that by increasing our Stone Column spacing, our total settlement under the embankment load will also increase.
9.0 Additional Exercise (advanced staging)
In case if you're interested in seeing different stiffness at different section of the stone column, you can select select the 'Add stone columns in different stages' and apply different stone column stiffness in different depths / stages of the installation.
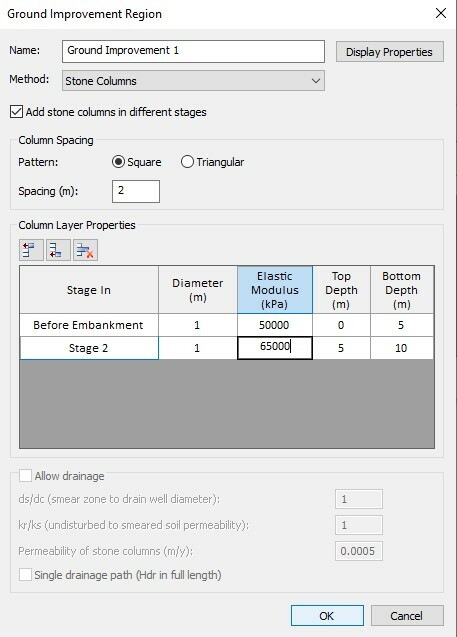
Then this will create model with stiffer stone columns applied in ground improvement region of 5 to 10 meters in depth.
Below shows the effect of improved region and the results. The settlement has improved to 195 mm.
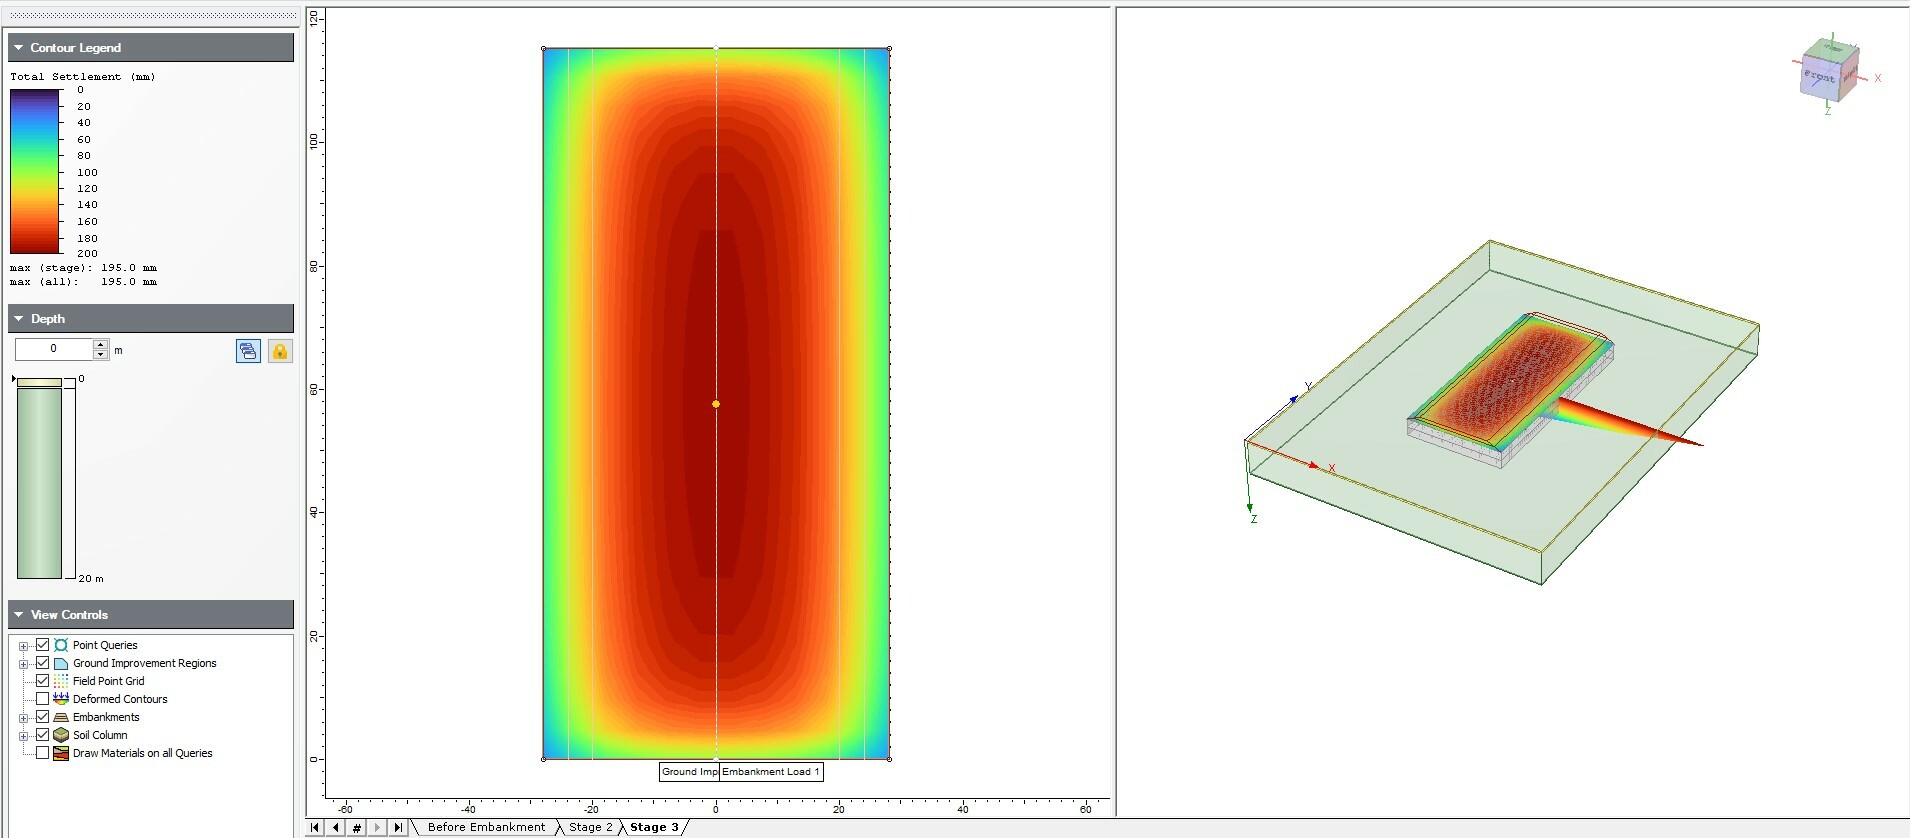
This concludes the tutorial for Stone Columns.
8.0 References
1. K.S. Ng, S.A. Tan (2015). “Simplified homogenization method in stone column designs”. Soils and Foundations. Volume 55, Issue 1. Pages 154-165.