5 - Excavations
1.0 Introduction
Topics Covered in this Tutorial:
- Staging with Water Table
- Excavations
- Reference Stage
Finished Product:
The finished product of this tutorial can be found in the Tutorial 05 Excavation.s3z file. All tutorial files installed with Settle3 can be accessed by selecting File > Recent Folders > Tutorials Folder from the Settle3 main menu.
2.0 Model
If you have not already done so, run Settle3 by double-clicking on the Settle3 icon in your installation folder. Or from the Start menu, select Programs > Rocscience > Settle3.
2.1 Project Settings
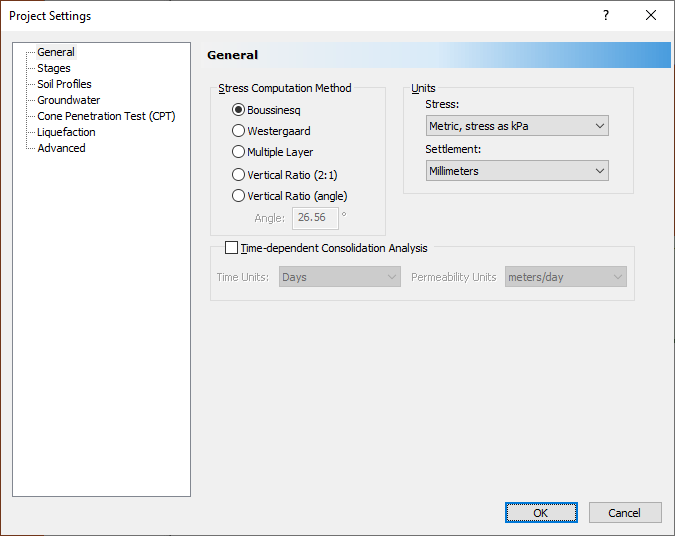
- Open the Project Settings dialog from the toolbar or the Analysis menu and make sure the General tab is selected.
- Set the Stress units = Metric, stress as kPa, and the Settlement units = Millimeters.
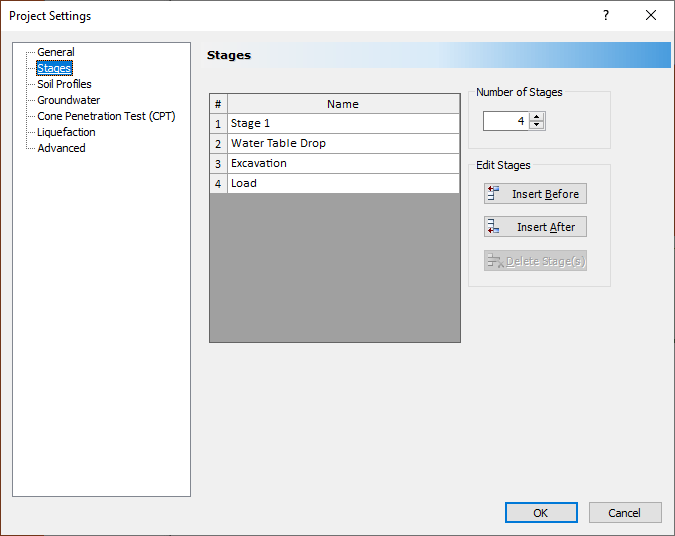
- Click on the Stages tab. Set the Number of Stages = 4, and enter the following names for each stage.
- Click on the Groundwater tab. Turn on Groundwater Analysis.
- Select the Soil Profiles tab, Select the 'Depth below Ground Surface' option.
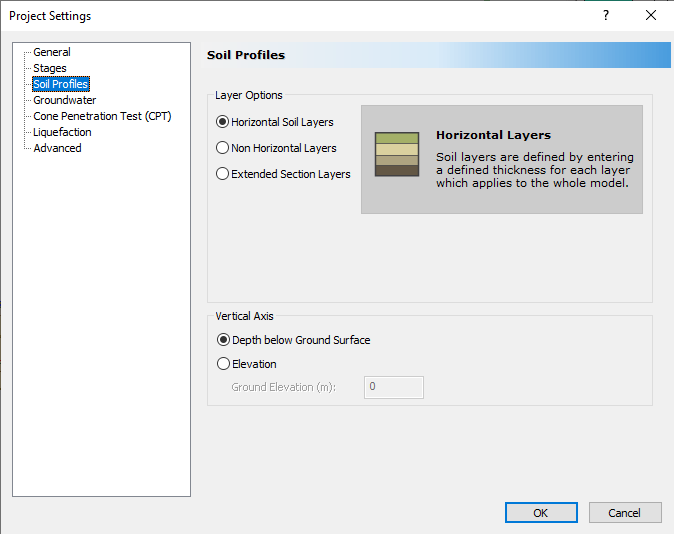
- Click OK to close the Project Settings dialog.
3.0 Assign Piezometric Lines
We will have multiple piezometric lines acting at different stages of the model.
Before excavating, we will be dropping the piezometric line. So let's first model the piezometric line before the drop.
- Select Groundwater > Add Piezometric Line

- Keep the default value of 0 m, and click OK. In the Assign Piezometric Line to Soils dialog that pops up, leave all soils unchecked and click OK.
- Select Groundwater > Add Piezometric Line
- Enter a depth of 2 m, then click OK. In the Assign Piezometric Line to Soils dialog that pops up, again leave all soils unchecked and click OK.
- Select Groundwater > Soil Groundwater Properties

- Click on the Stage Piezo Lines checkbox. For Stage 1, select Piezo #1 from the dropdown. For all other stages, select Piezo #2. Click the Apply to All button. The dialog should look like this:

- Click OK to close the dialog.
4.0 Adding the Excavation
In the first stage, nothing happens. The first stage is only required to set up the initial water table. In the second stage, the water table is dropped two meters. The excavation will be added in the third stage.
Click on the tab for Excavation (Stage 3). To add the excavation:
- Select Loads > Add Excavation

You will see a warning explaining that full 3D displacement computations and 3D fluid flow analyses are not done for excavations. The excavation in Settle3 is modelled by applying a negative load at depth, equal to the weight of the excavated material.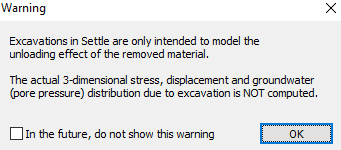
- Click OK to close the warning box. Now you must enter the coordinates to define the excavation. You can use the mouse to graphically enter the points, or enter them in the prompt line. We will build a rectangular excavation so enter the following points:
- {0,0}
- {10,0}
- {10,20}
- {0,20}
- "c" (to close the region)
- You will now see a dialog for entering the excavation properties. Set the Depth to 2 m and the Installation stage to Excavation.
- We want to add a load to the bottom of the excavation, so click the check box for Add Load to Bottom of Excavation. Set the Load Magnitude to 40 kPa and the Installation stage to Load. The dialog should look like this:
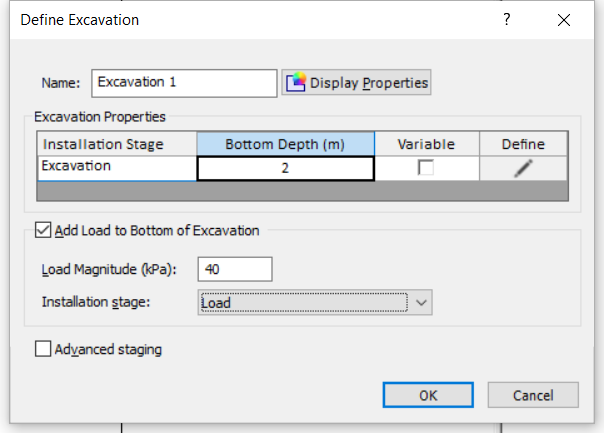
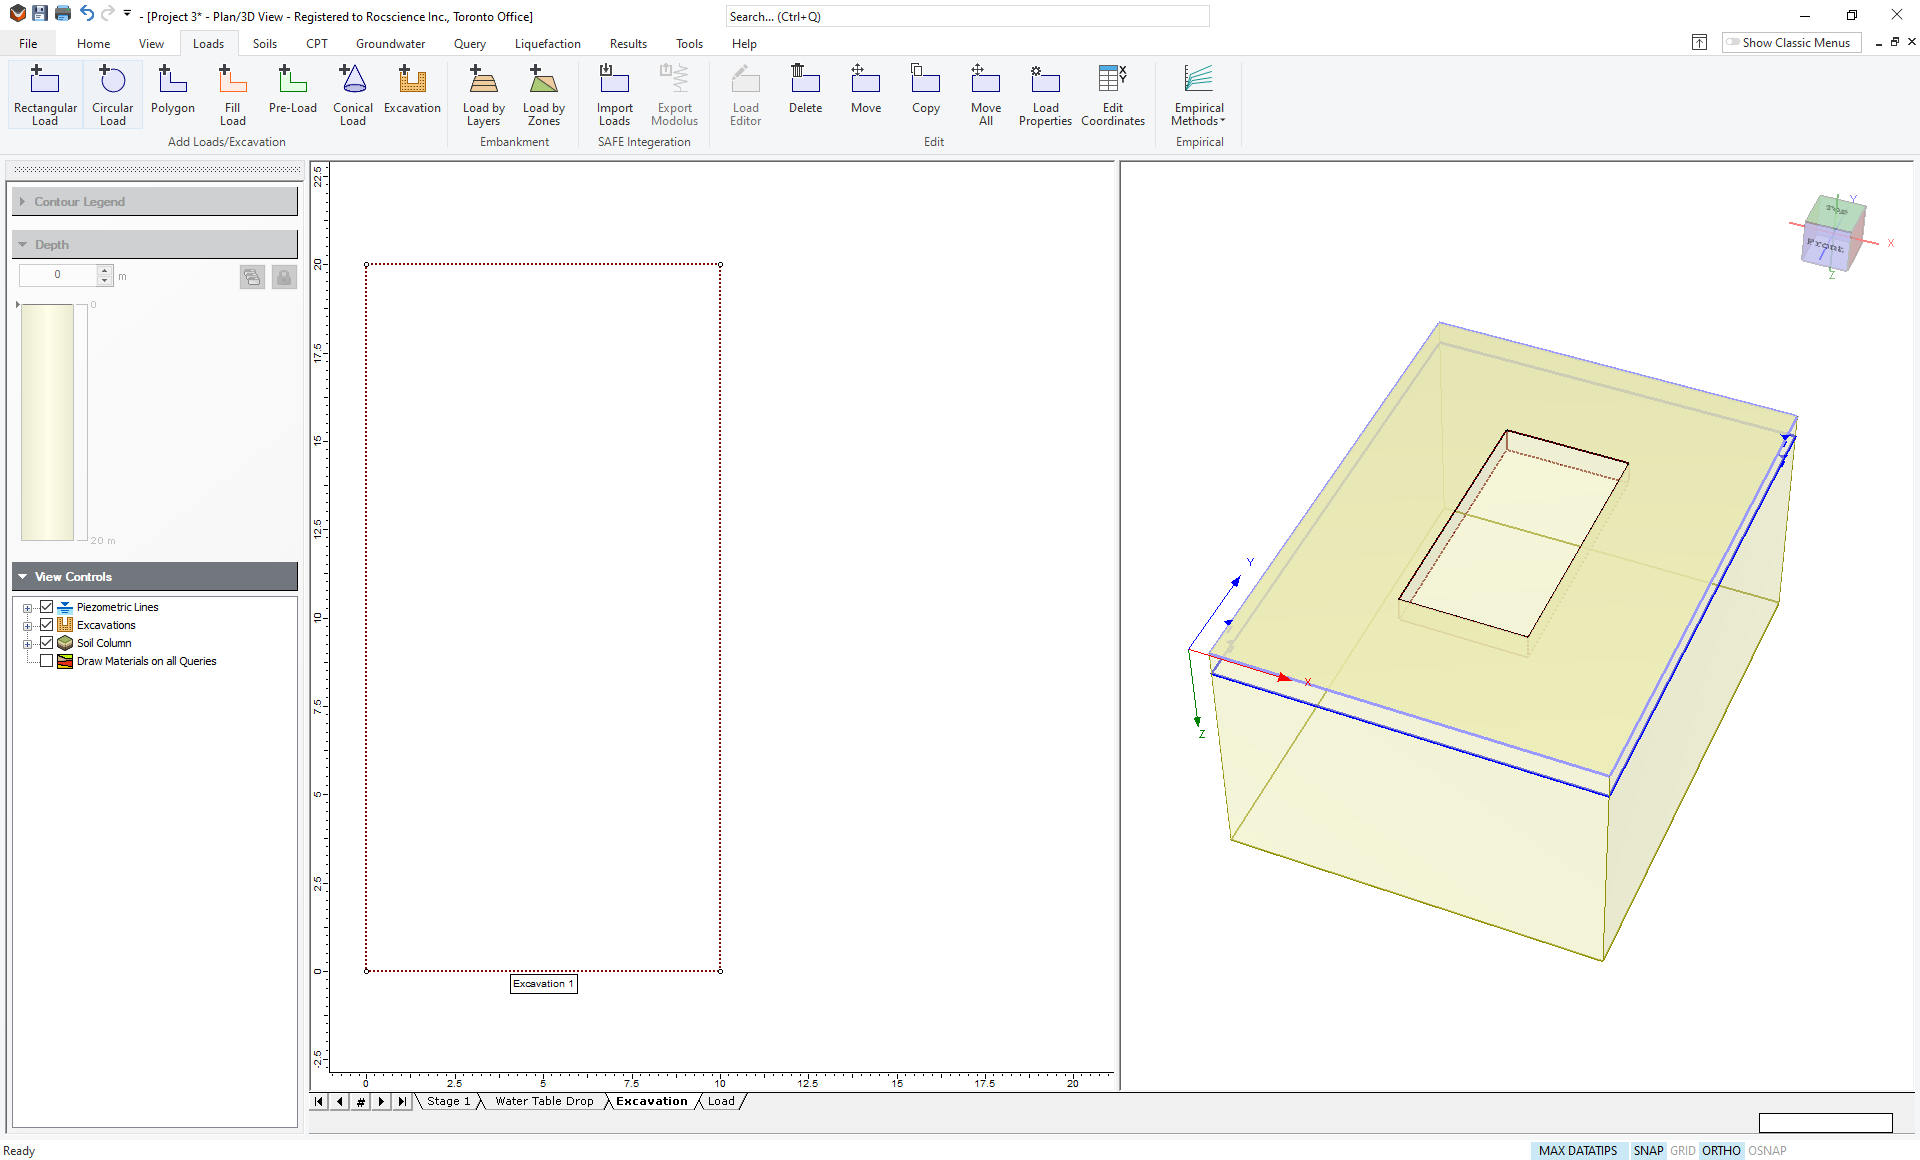
- Click OK. Your model should now appear as shown for the Excavation stage.
5.0 Soil Layers
The 3D View shows a soil layer with a default thickness of 20 m. It is assumed that rigid bedrock lies below the soil. In this section, we will change the soil properties and layer geometry.
5.1 Soil Properties
- Select Soils > Define Soil Properties

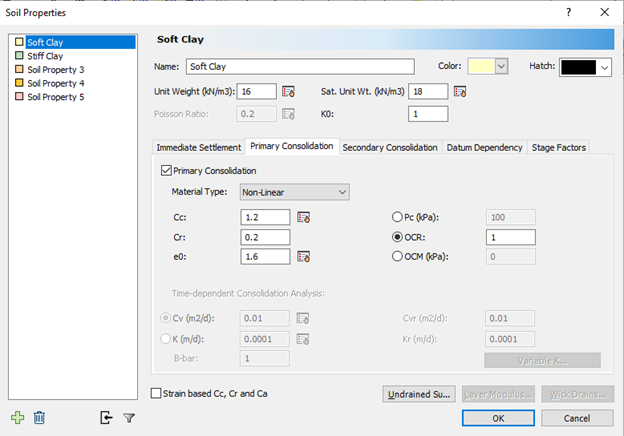
- The topsoil type is normally consolidated soft clay. Fill in the following soil properties:
- Set the name to Soft Clay
- Change unit weight to 16 kN/m3
- Set K0 = 0
- Primary Consolidation = YES
- Material Type = Non-Linear
- Set Cc = 1.2, Cr = 0.2, e0 = 1.6, OCR = 1
- Click on the tab for Soil Property 2. Change the name to “Stiff clay” and leave all of the other default parameters as shown.
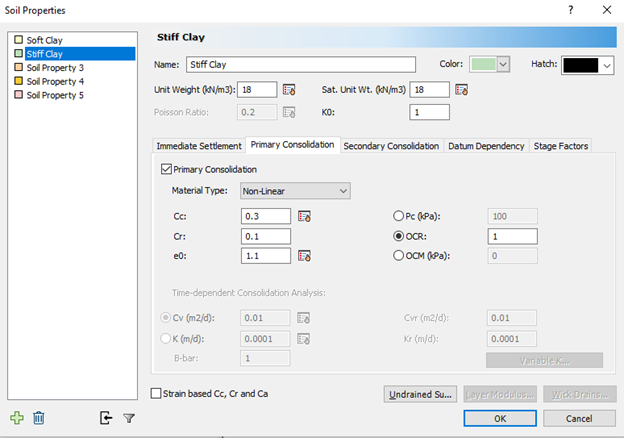
- Click OK to close the dialog.
The dialog should look like this:
5.2 Layer Thickness
To change the thickness of the soil layers:
- Select Soils > Layers

Here you can add layers of different materials and change their thickness.
- Click the Insert Layer Below button to create a second layer, and enter the thickness of the two layers as shown:
- Soft Clay = 2
- Stiff Clay = 15
- Click OK to close the dialog.

6.0 Field Point Grid
- Select Query > Auto Field Point Grid

- Enter the Number of grid points = 500 and expansion factor = 2.
- Click OK.
Your model for Stage 1 should now look like this:
7.0 Results Visualization
You will see that there is no settlement in Stage 1 as expected. If you click on the tab for Stage 2 (Water table drop) you will see that the settlement is 483.9 mm everywhere. This is because the dropping water table causes a drop in pore pressure and therefore an increase in excess stress. The increase in excess stress causes a significant amount of settlement.
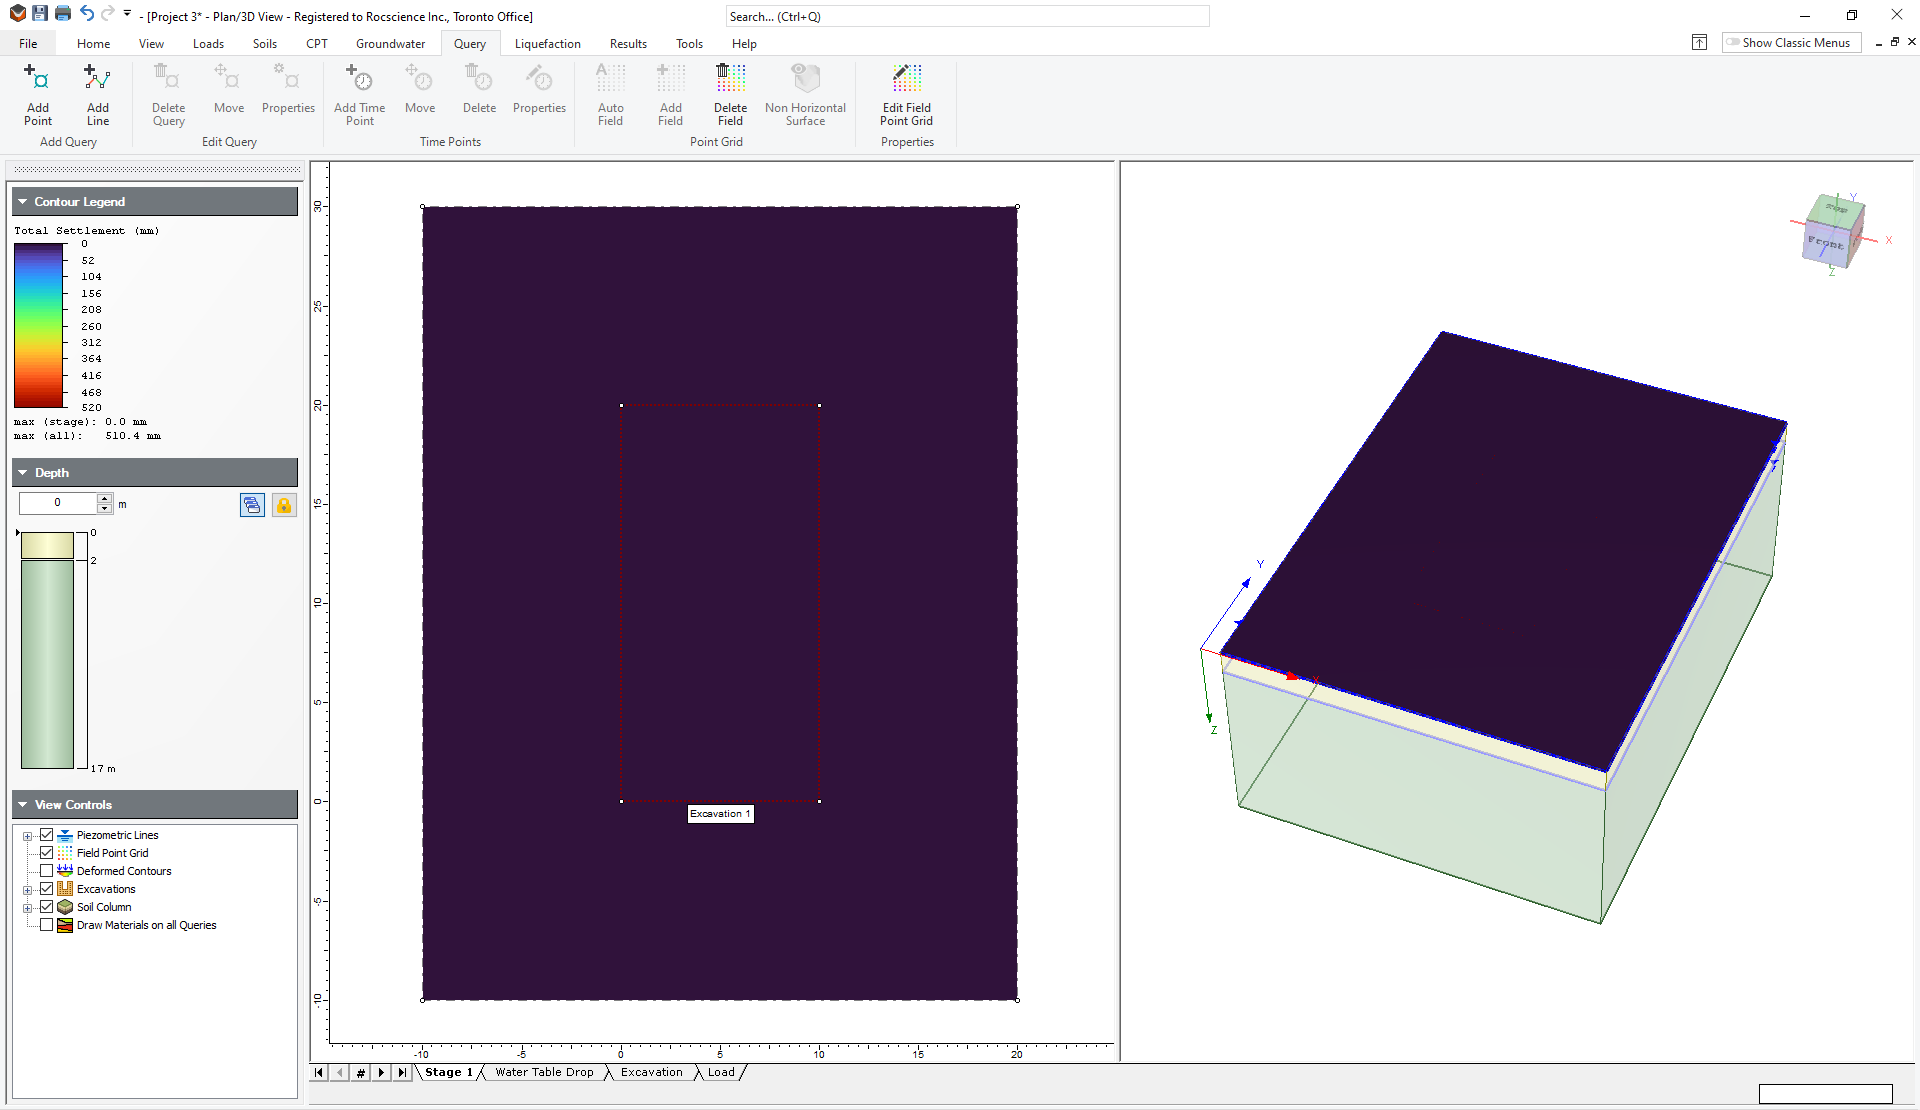
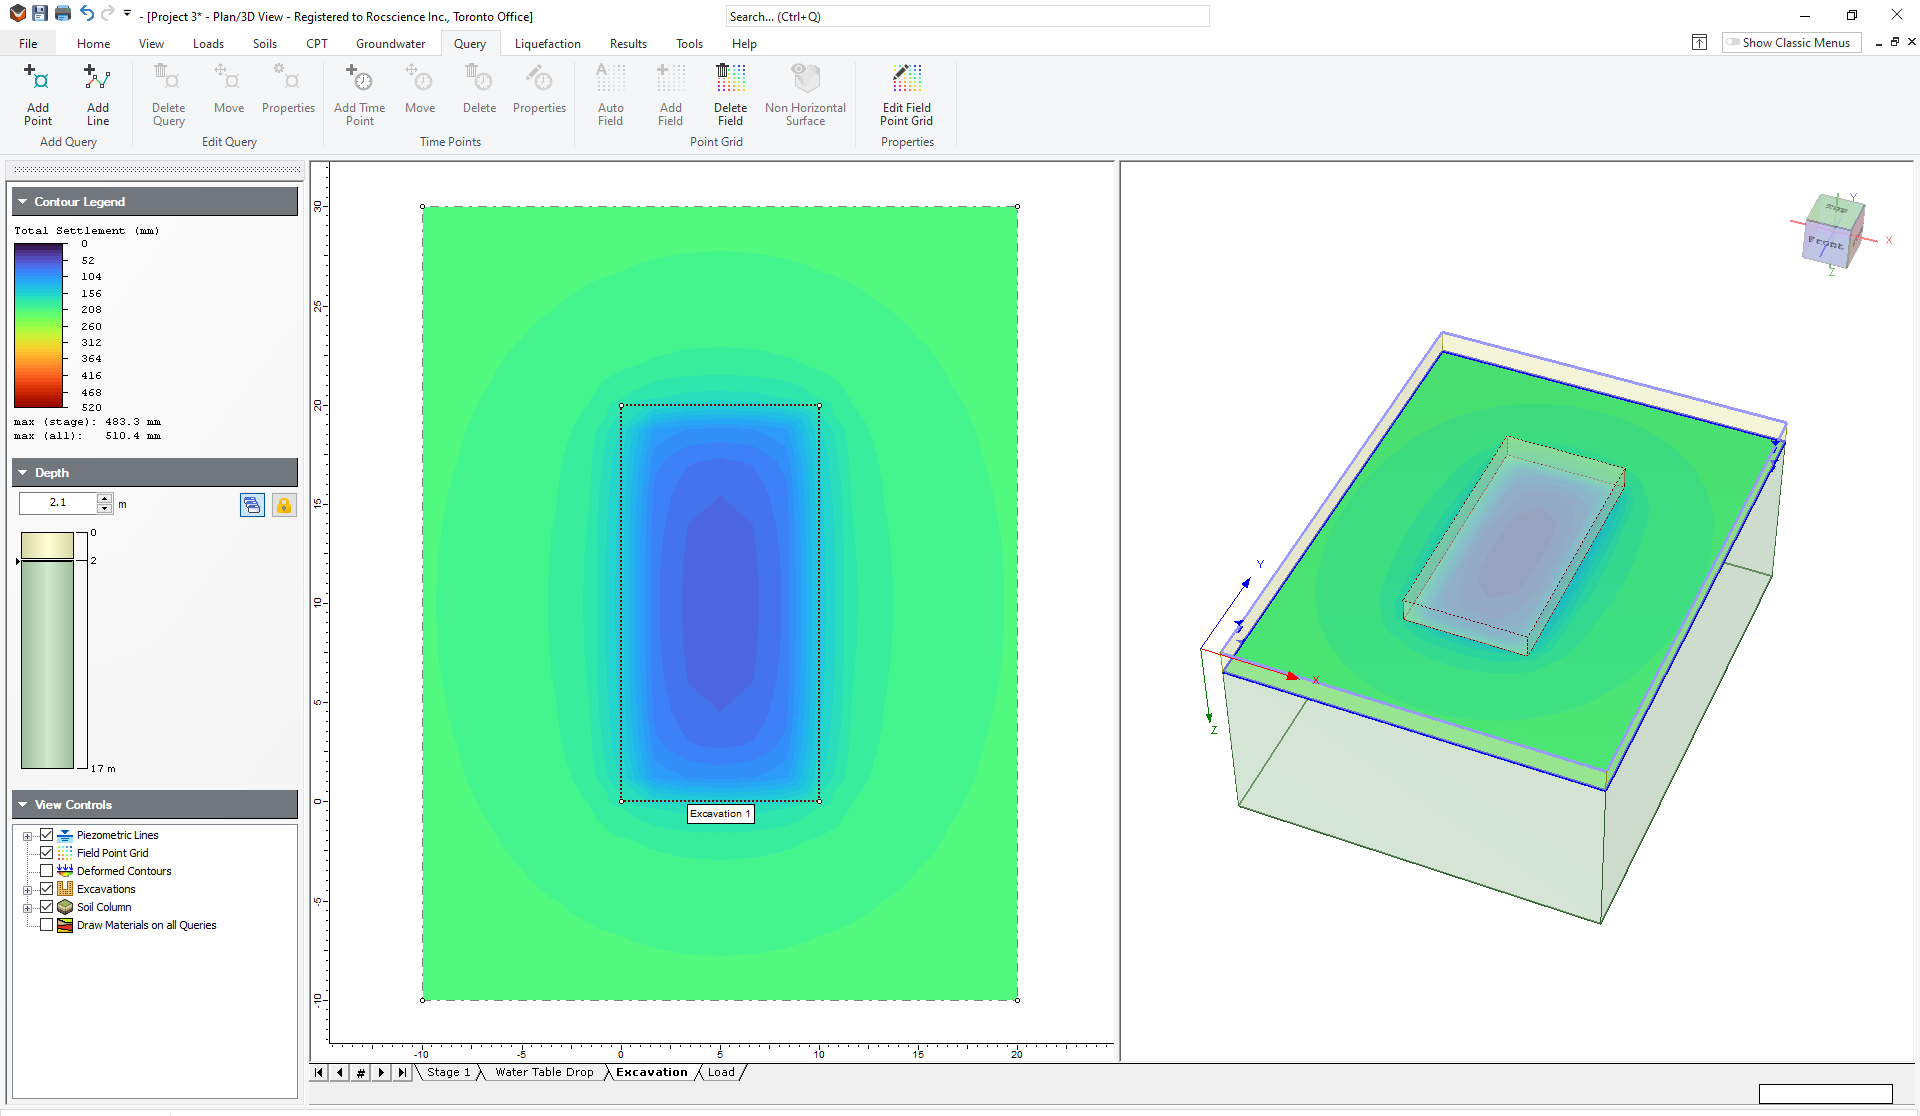
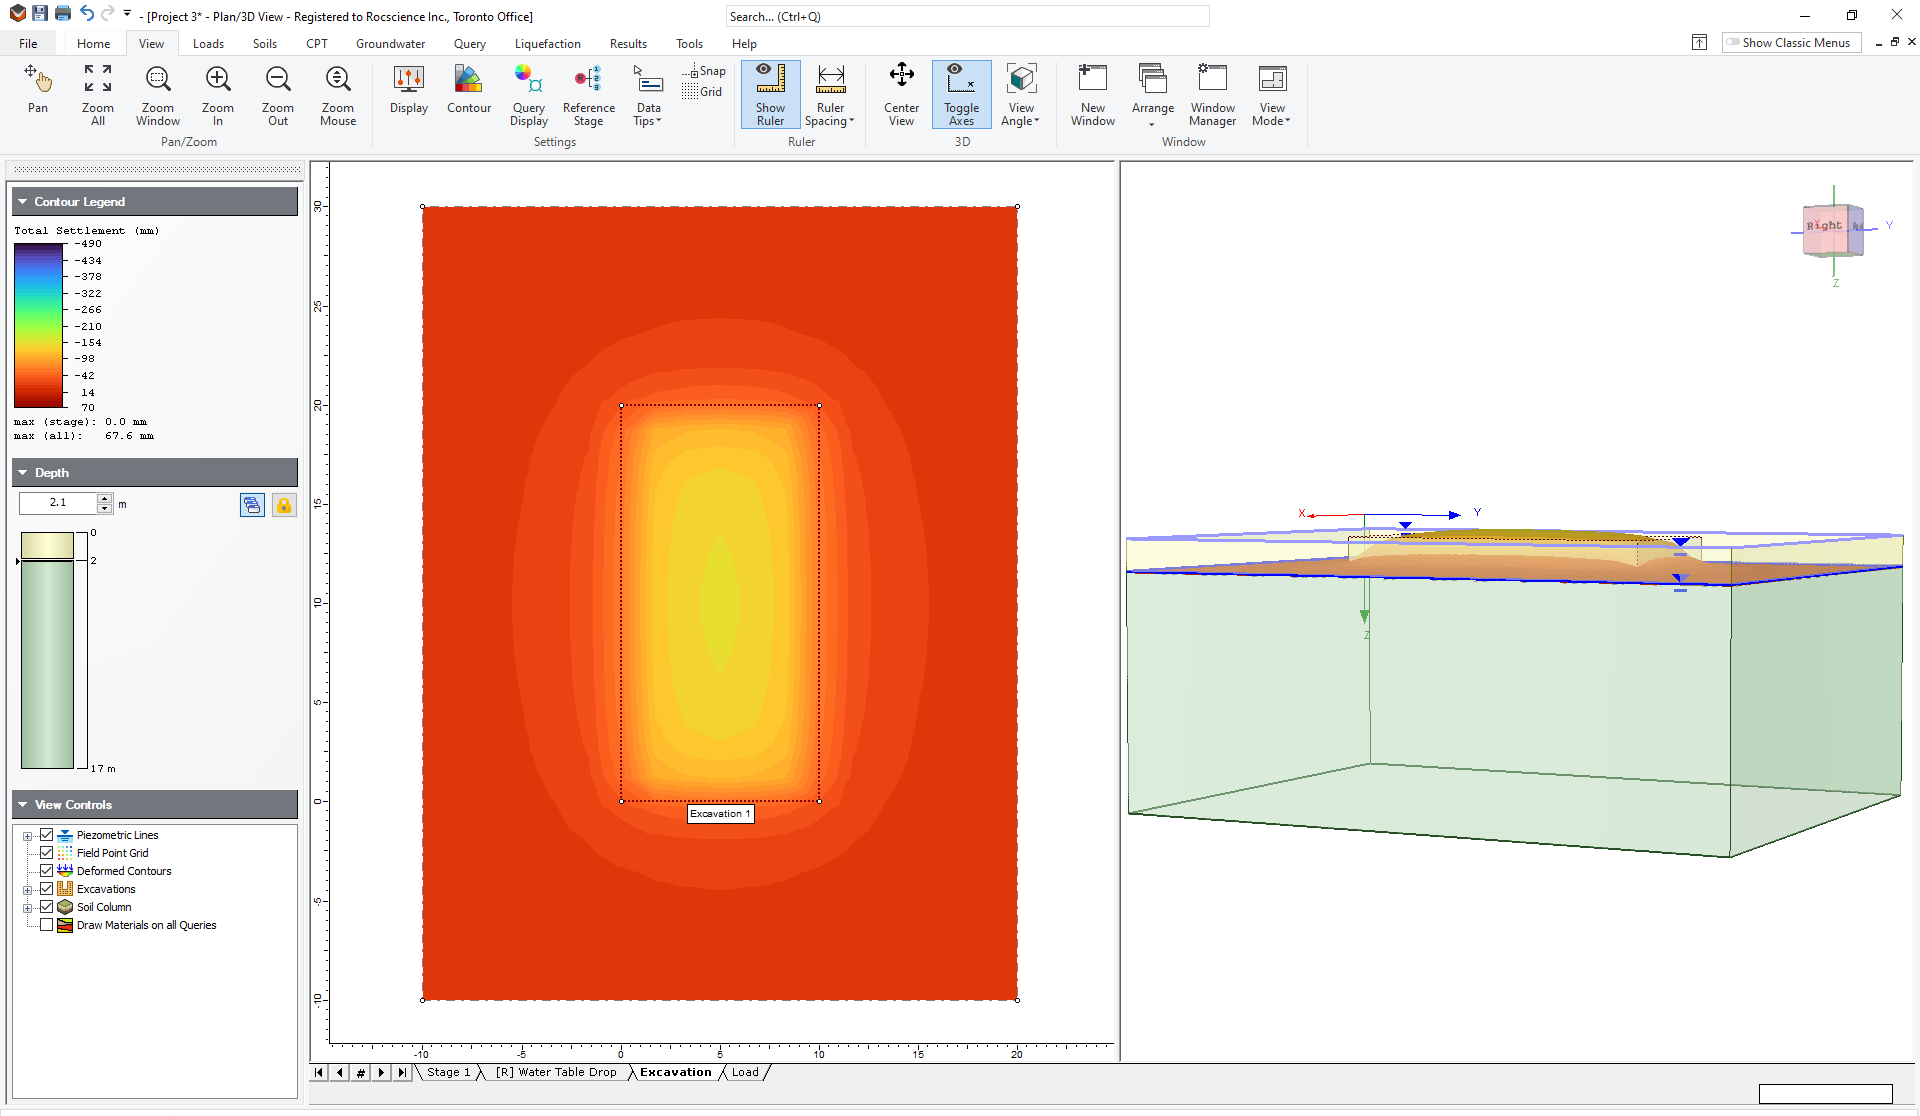
Now click on the tab for stage 3 (Excavation). You will not see any contours in the area that has been excavated because we are looking at the surface and there is no soil here! In the Depth box on the right-hand side, scroll down through the soil by increasing the depth, either by changing the number in the depth box or by clicking and dragging on the soil profile. At a depth of 2.1 m (just below the excavation), the total settlement should look like this:
Under View Controls, select the Deformed Contours checkbox. Rotate the 3D view to obtain a view like this:
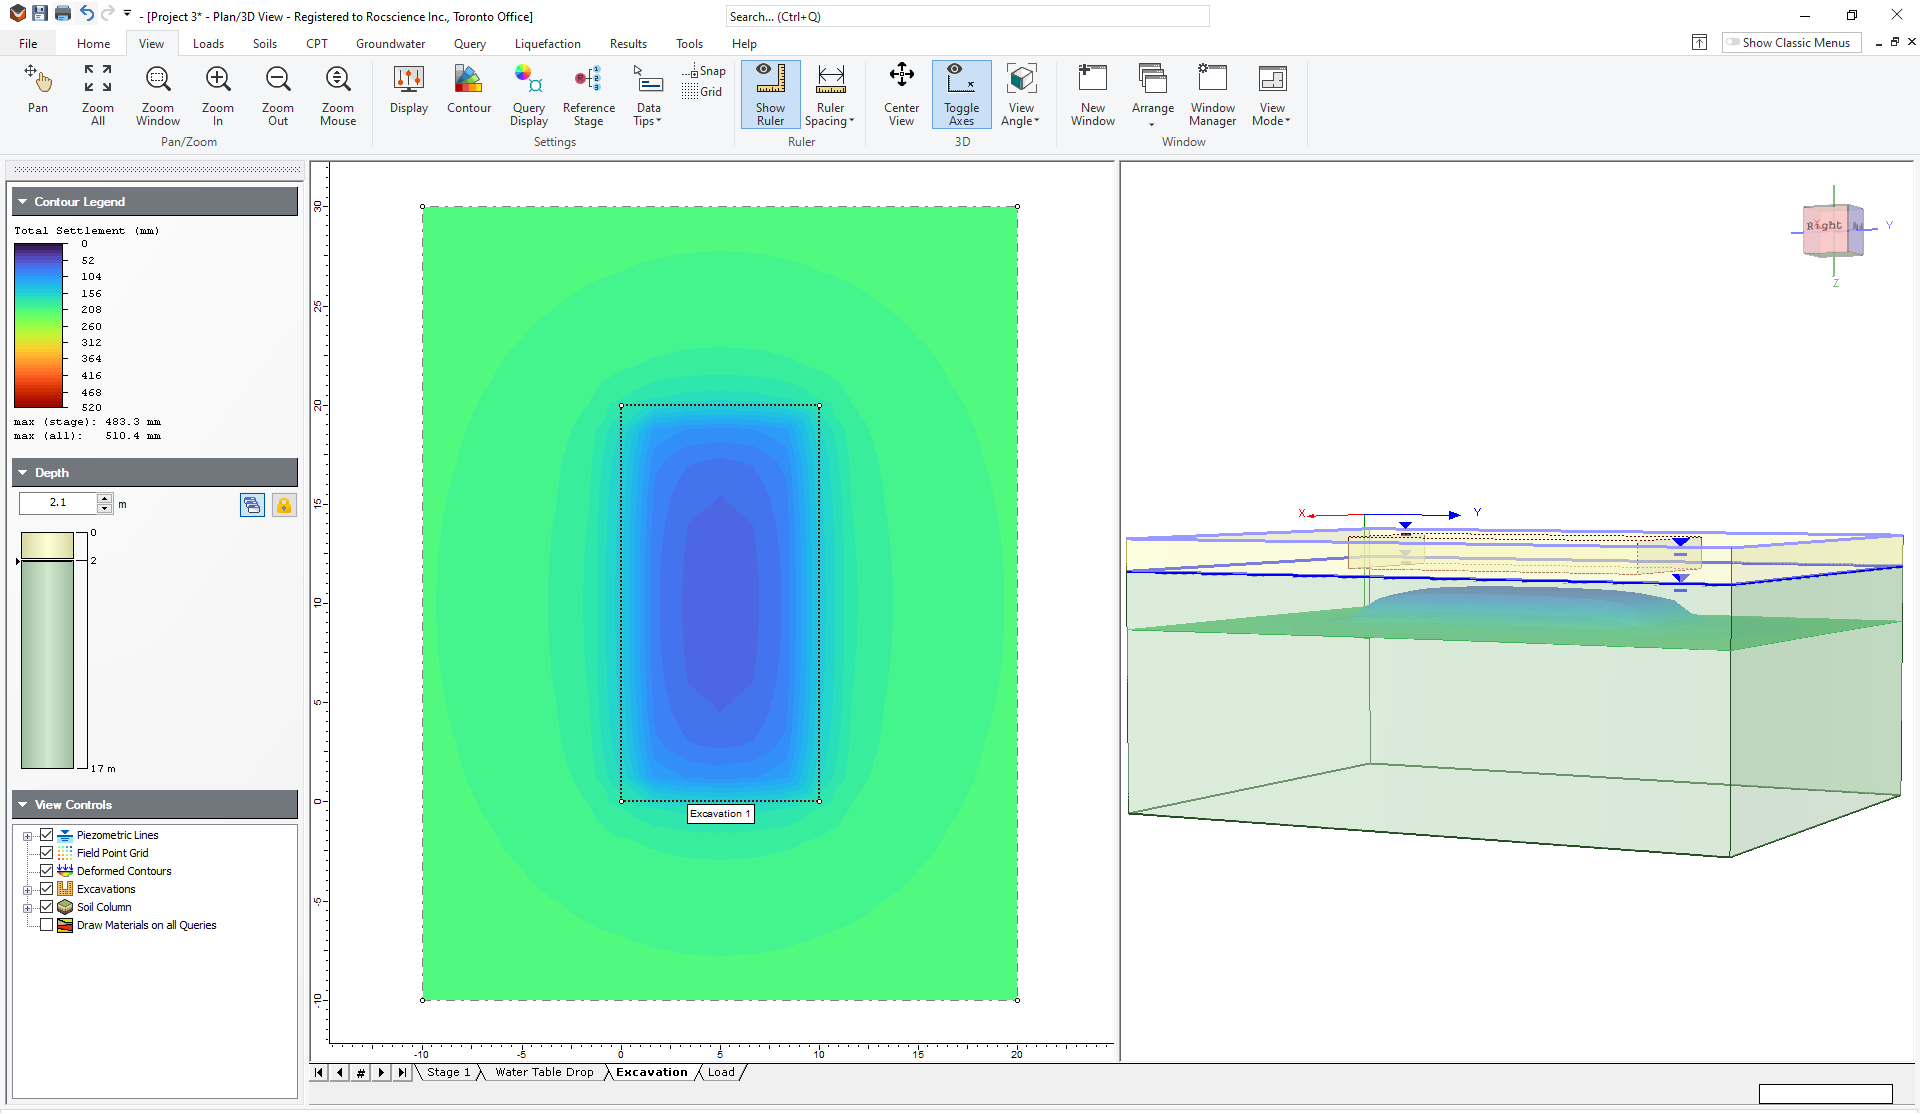
You can see that there is a “pop up” below the excavation since the material has been removed causing a stress decrease.
The plot looks odd because of the large downward settlement in Stage 2 caused by the water table drop. To see the displacement caused by the excavation only, we can set Stage 2 to be the reference stage and plot all displacements relative to Stage 2. To do this:
- Select View > Reference Stage from the menu.
- In the Reference Stage dialog, choose “Water table drop” as the reference stage.
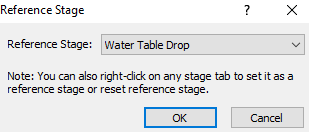
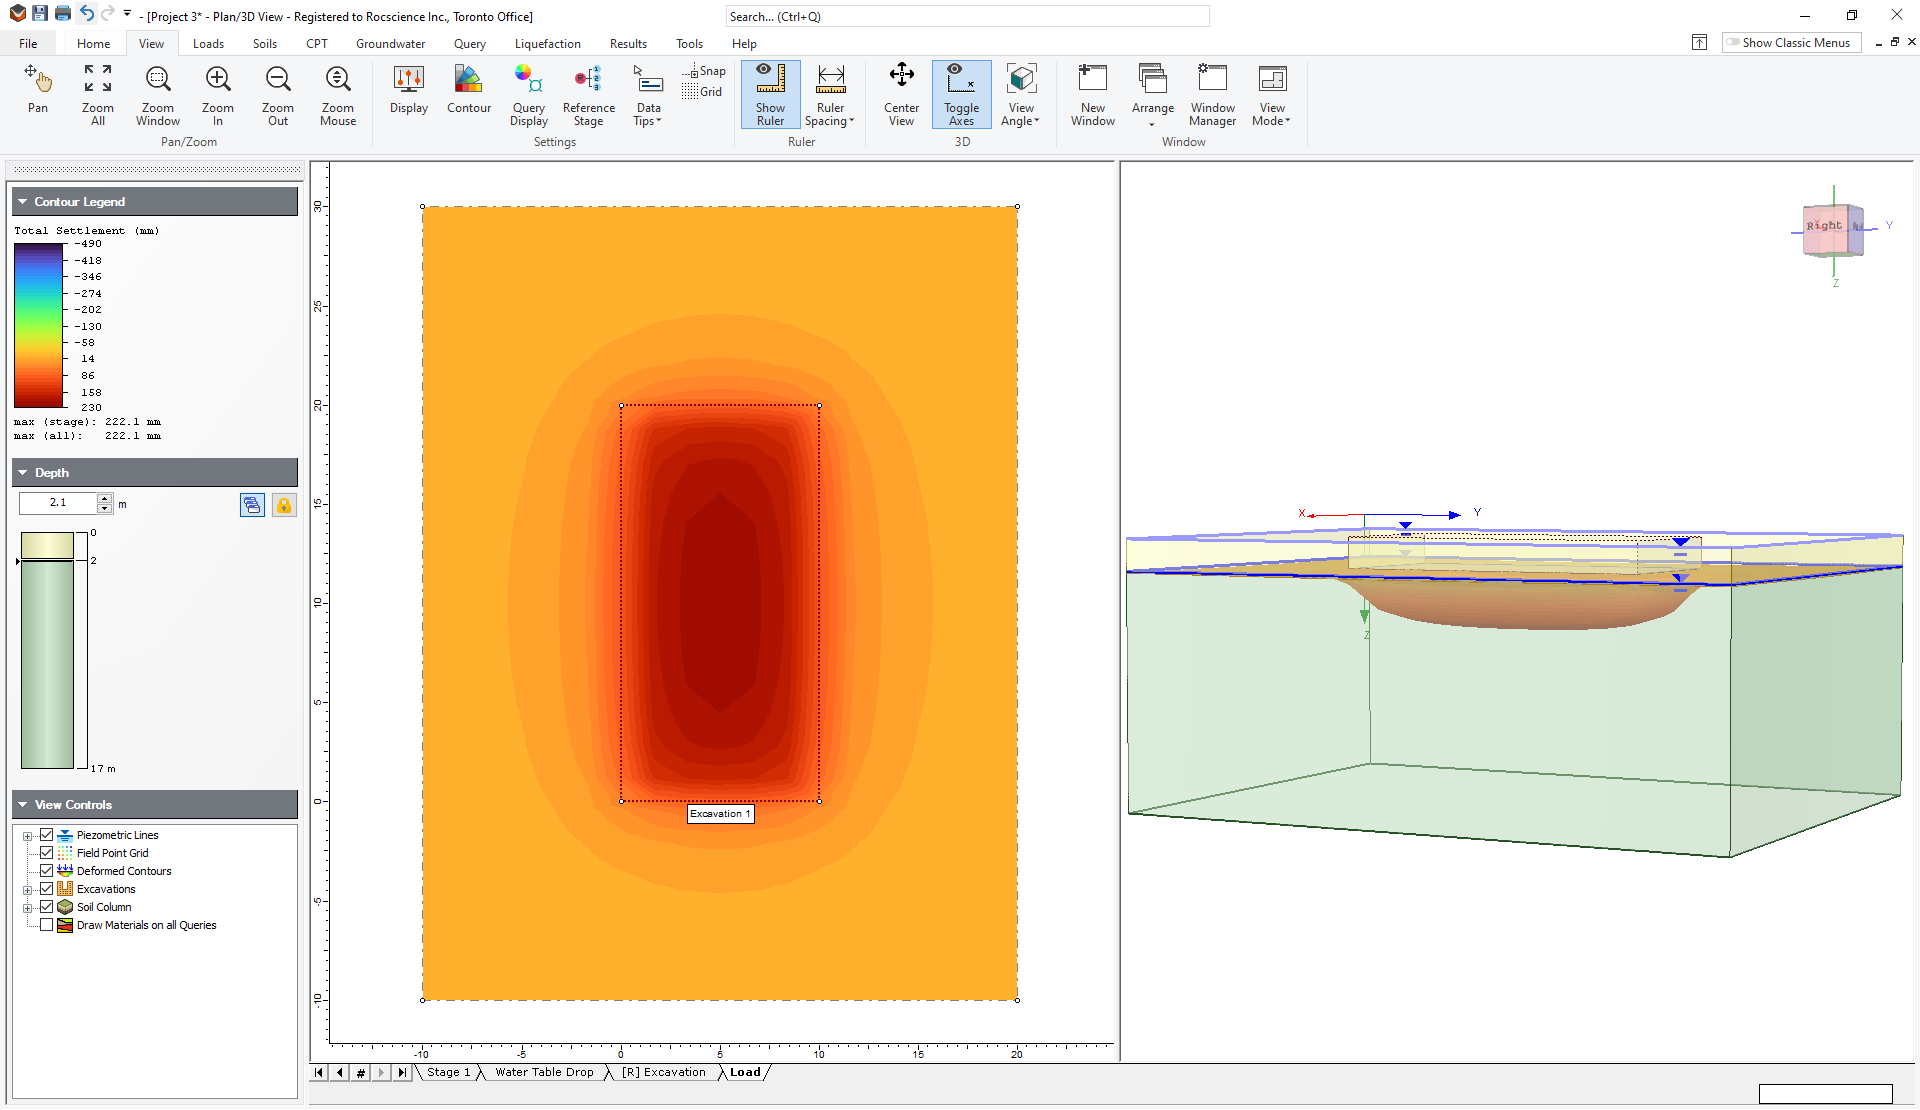
- Click OK, and your plot for Stage 3 (Excavation) should now look like this:
You can now clearly see the uplift in the excavation.
- Click on the tab for the final stage (Load). You will see that the soil has been pushed back down by the applied load.
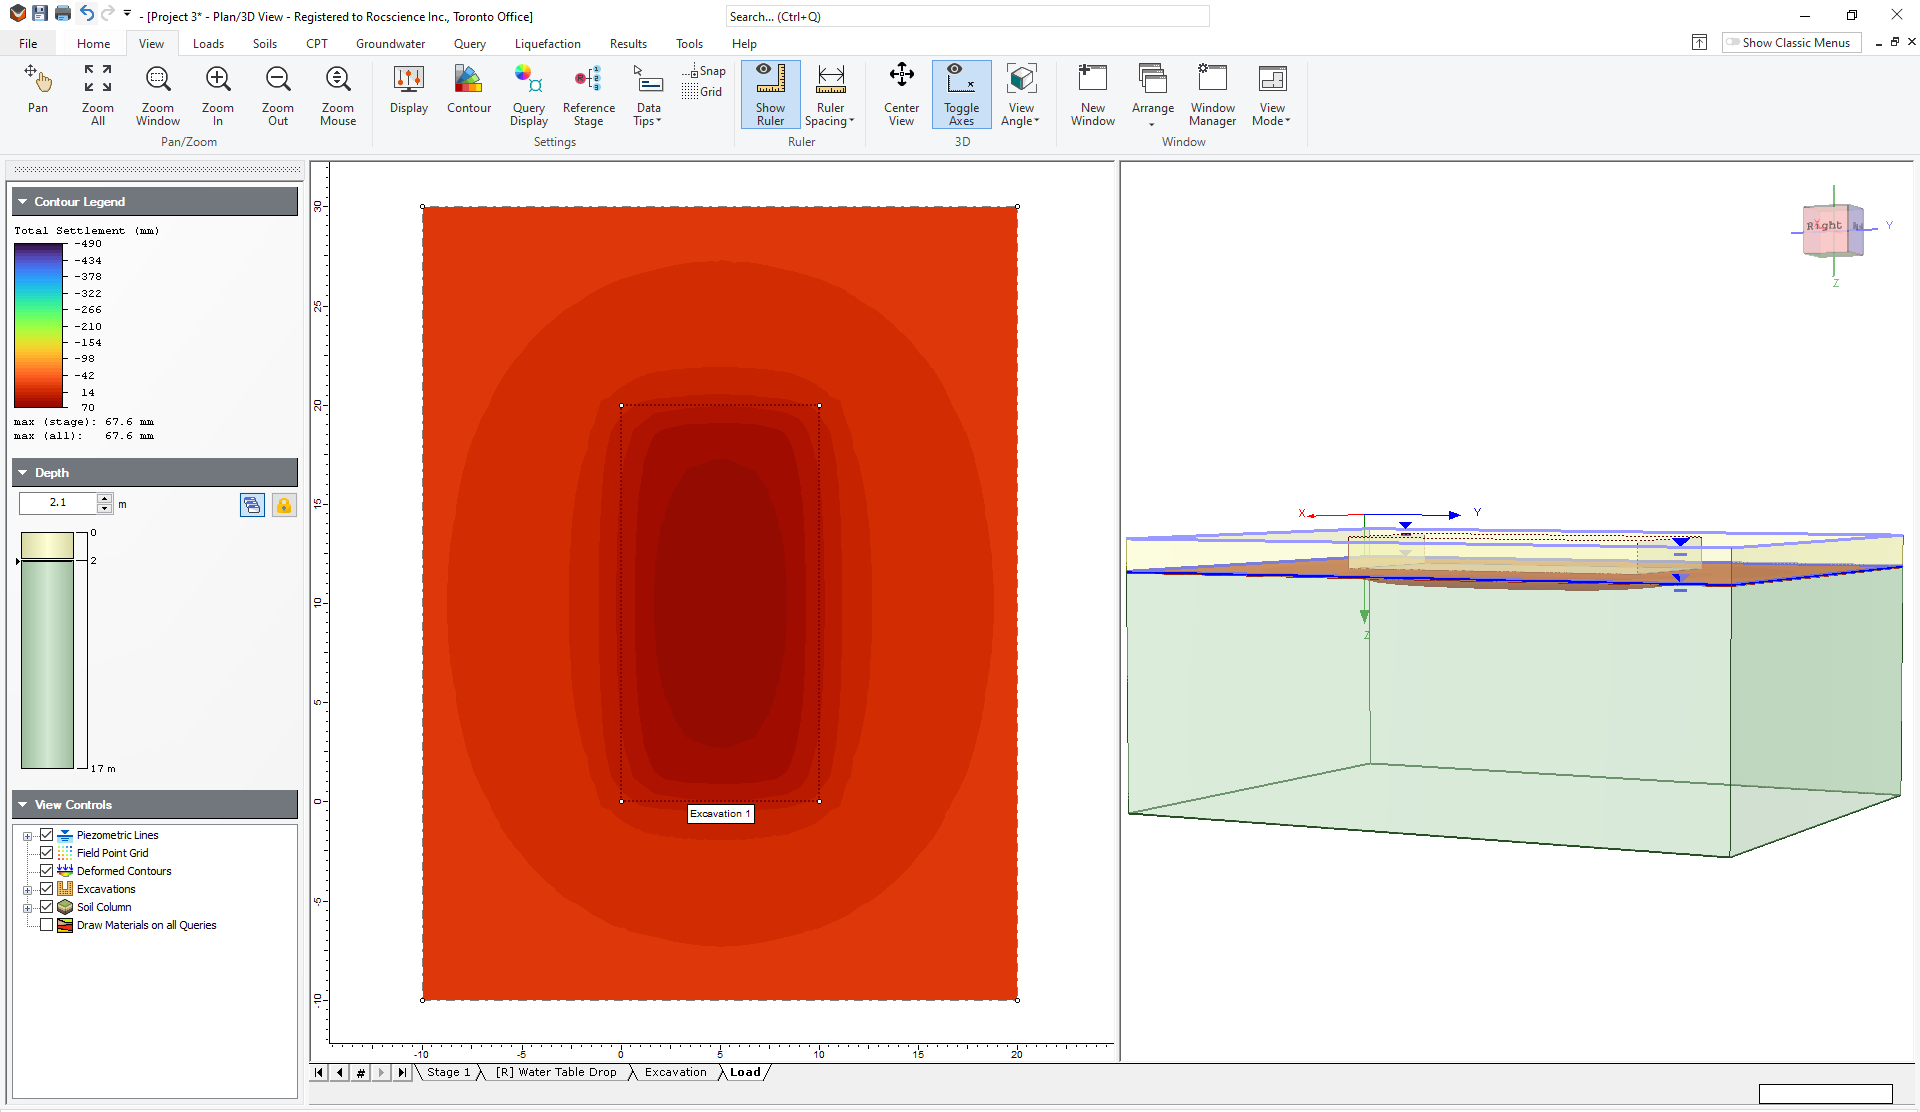
To observe the settlement due to the load only, you can set the reference stage to Stage 3 (Excavation) and you will get a plot like this.
TIP: You can also set the reference stage by right-clicking on a stage tab and choosing Set as Reference Stage.
- Reset the Reference Stage to None.
7.1 Query Point
To examine the settlement in more detail we will add a query point to the center of the excavation.
- Select Query > Add Query Point

You will see the Query Point dialog as shown.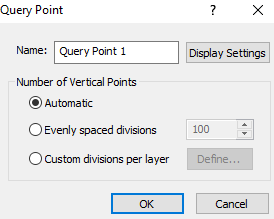
- Leave the default choice of Automatic.
- Click OK and the cursor will become a cross-hairs in the plan view.
- You now need to specify the location of the Query Point on the surface. Enter the coordinates {5,10} and hit Enter to place the Query Point at the centre of the excavation.
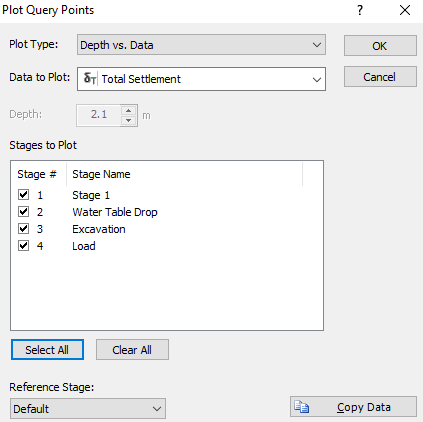
- Now right-click on the query point and select Graph Query.
- For Plot Type choose Depth vs. Data.
- For Data to Plot choose Total Settlement.
- For Stages to Plot choose Select All.
- Now change the Reference Stage back to Default.
- Click OK to draw the graph. The graph should look like this:
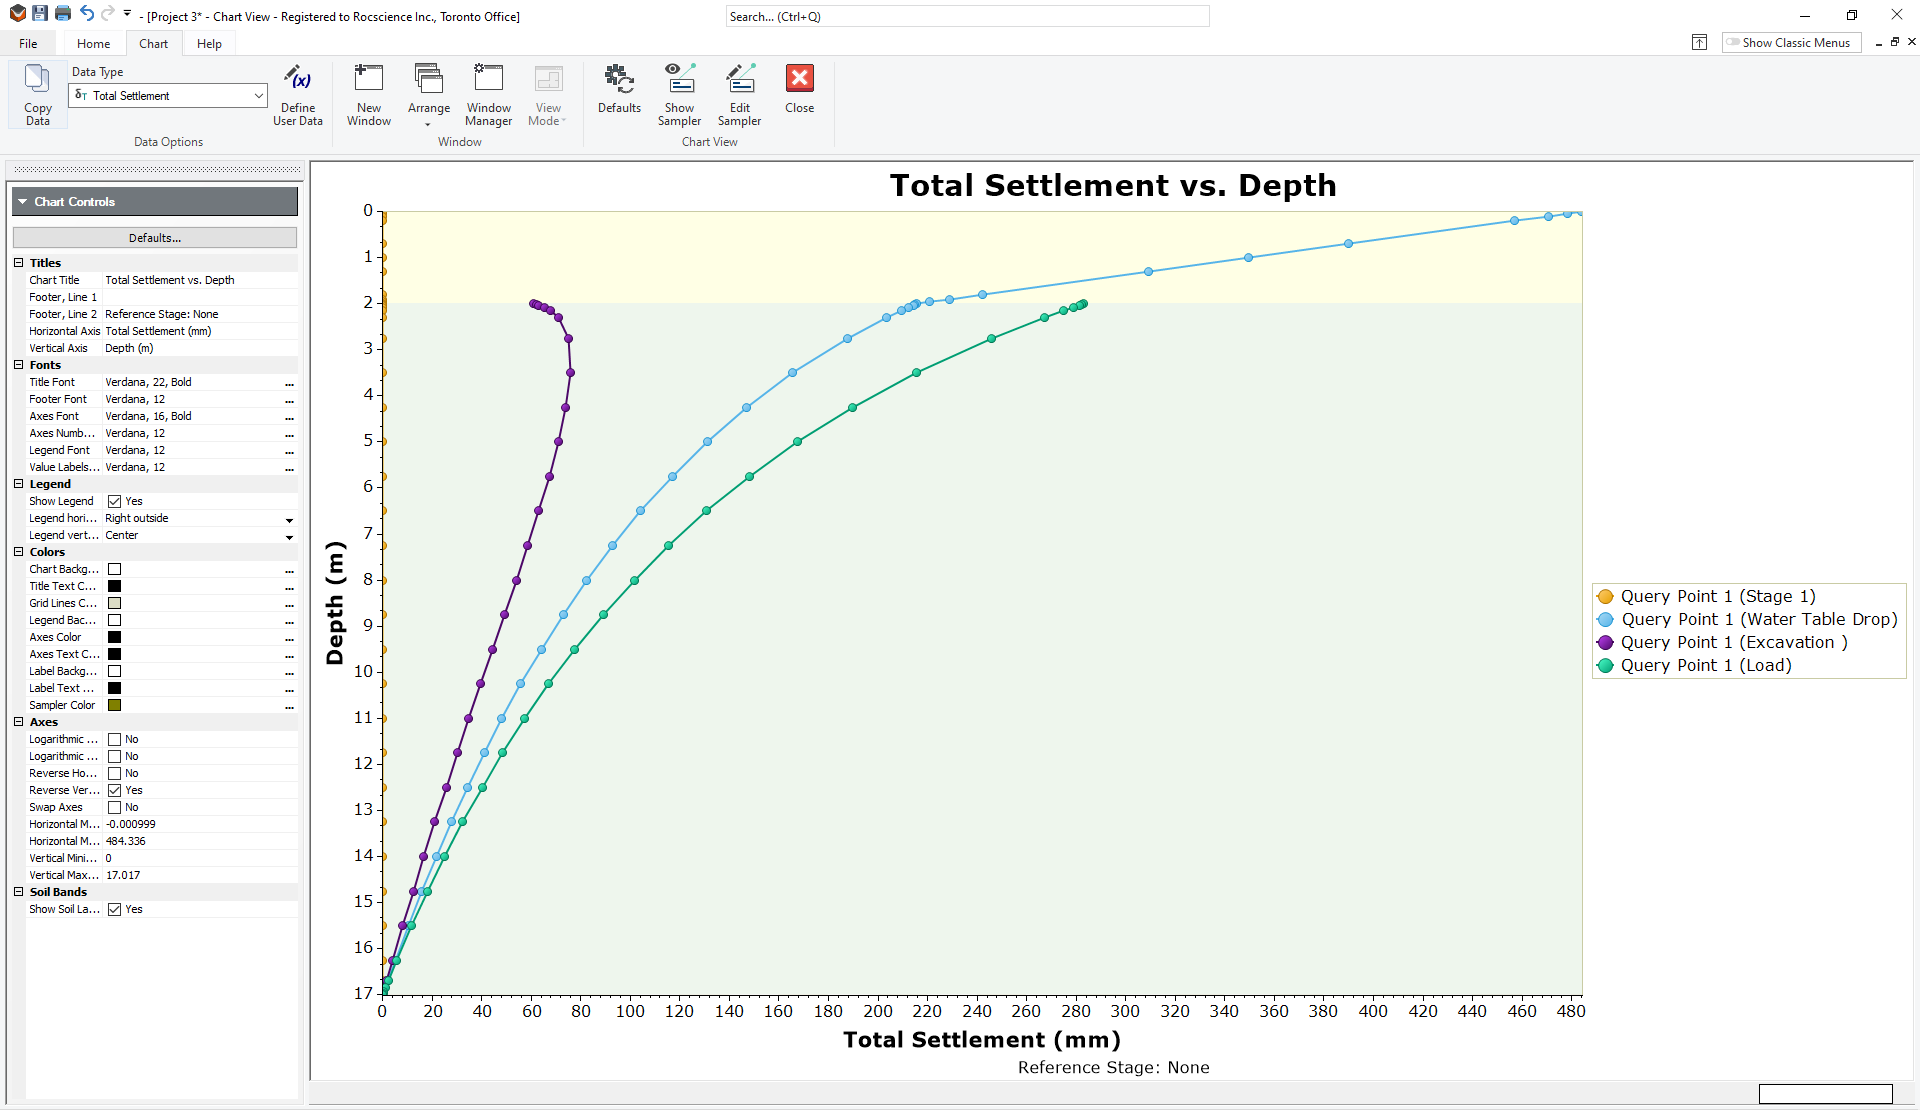
You can see the large settlements after the water table drop, and then uplift when the excavation is added and further settlement when the load is applied.
It appears that the water table drop causes a significant amount of settlement, especially in the top soft layer. If we want to examine the settlement caused by the excavation only, we can set the second stage as a reference stage.
- Close the graph window. In the Plan View, right-click on the query point and select Graph Query as before.
- This time only check stages 3 and 4, and for the Reference Stage choose “ Water table drop”.
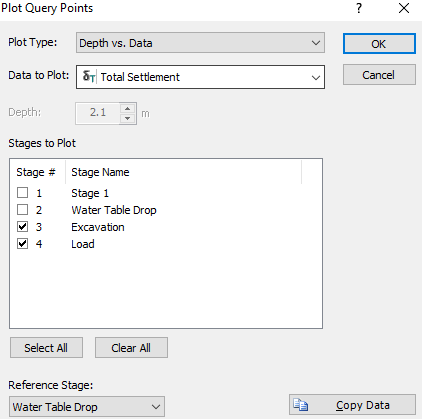
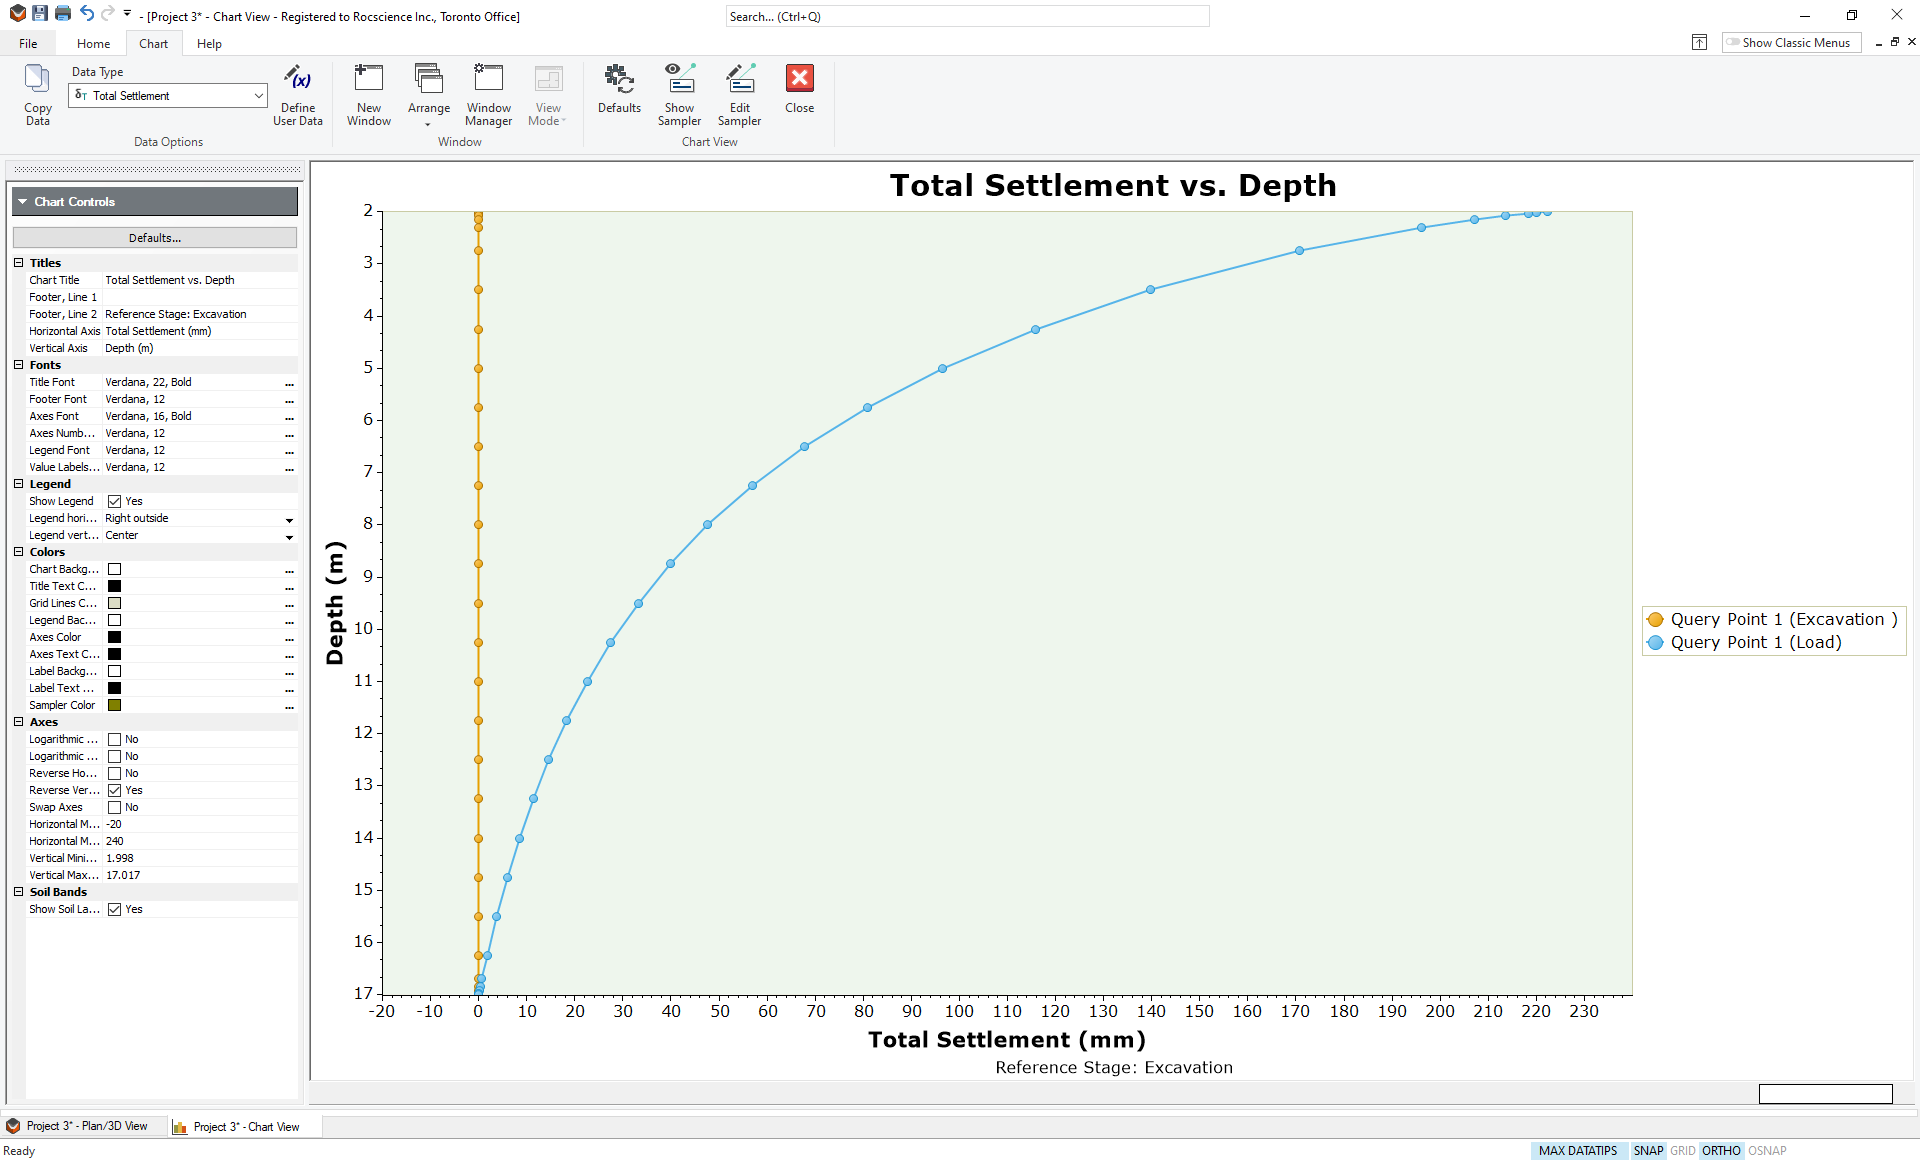
- Click OK and you should see a graph like this:
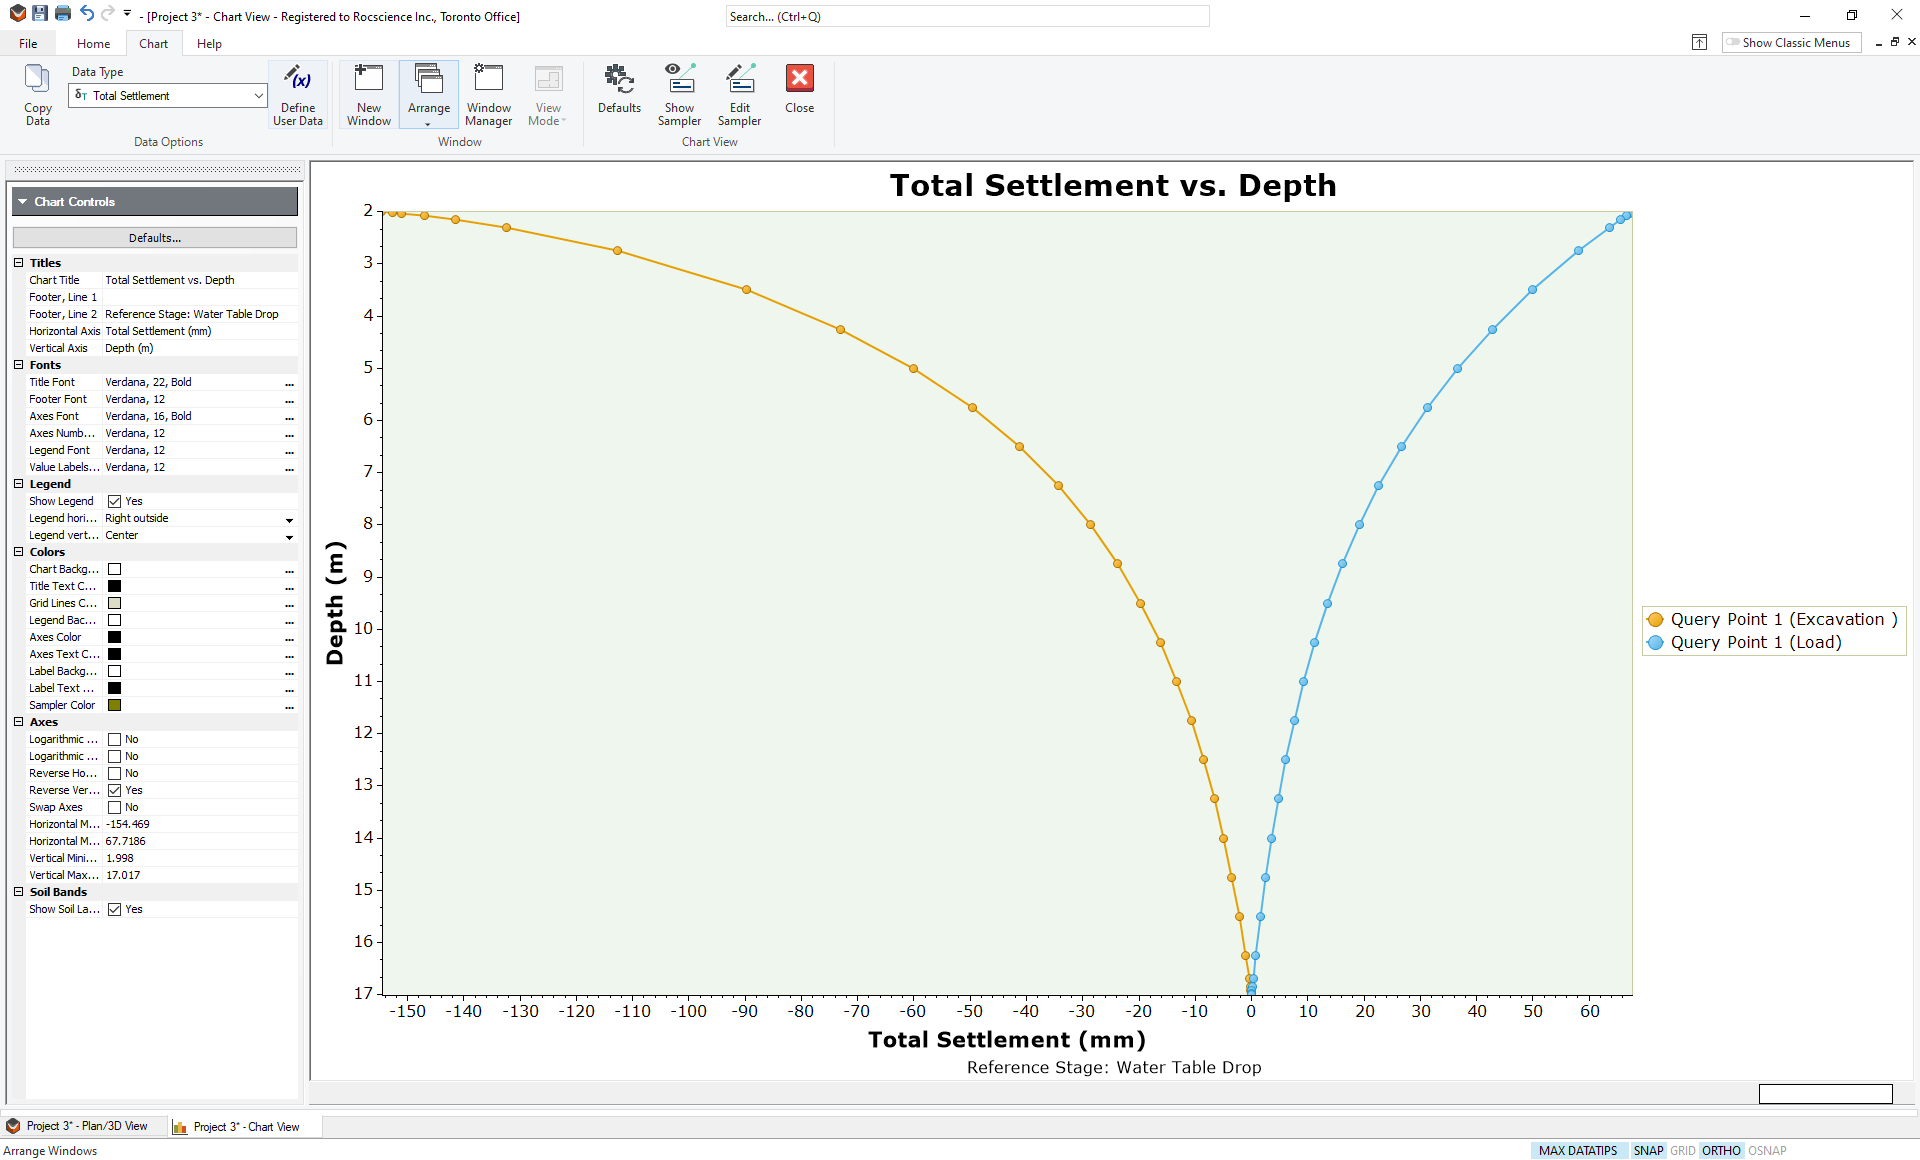
It is now clearly shown how the excavation causes ~150 mm of uplift and the subsequent load produces a settlement of ~70 mm.
Repeat the above steps setting the Excavation stage as the reference stage and you will see that the settlement due to the applied load alone is ~220 mm as shown.
This concludes the Excavation tutorial; you may now exit the Settle3 program.