14 - CPT Analysis
1.0 Introduction
This tutorial provides an introduction to the CPT interpretation analysis module in Settle3. Before proceeding with the tutorial, make sure you’ve gone through Tutorial 01 – Quick Start so you’re familiar with the product’s basic functions and features.
Topics Covered in this Tutorial:
- CPT data interpretation
Finished Product:
The finished product of this tutorial can be found in the Tutorial 14 CPT Analysis.s3z file. All tutorial files installed with Settle3 can be accessed by selecting File > Recent Folders > Tutorials Folder from the Settle3 main menu.
2.0 Model
2.1 Project Settings
-
Select Home > Project Settings
 (CTRL + J) to open the
Project Settings dialog.
(CTRL + J) to open the
Project Settings dialog.
- In the General tab, make sure the Units are set as Metric, stress as kPa.
-
Go to the Cone Penetration Test (CPT) tab and check the CPT Analysis checkbox to turn the CPT analysis option on.
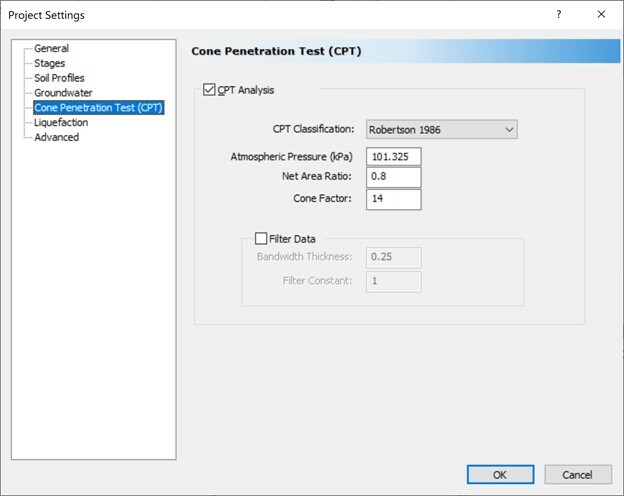
- Click OK to close the dialog and save your changes.
3.0 Enter CPT Data
-
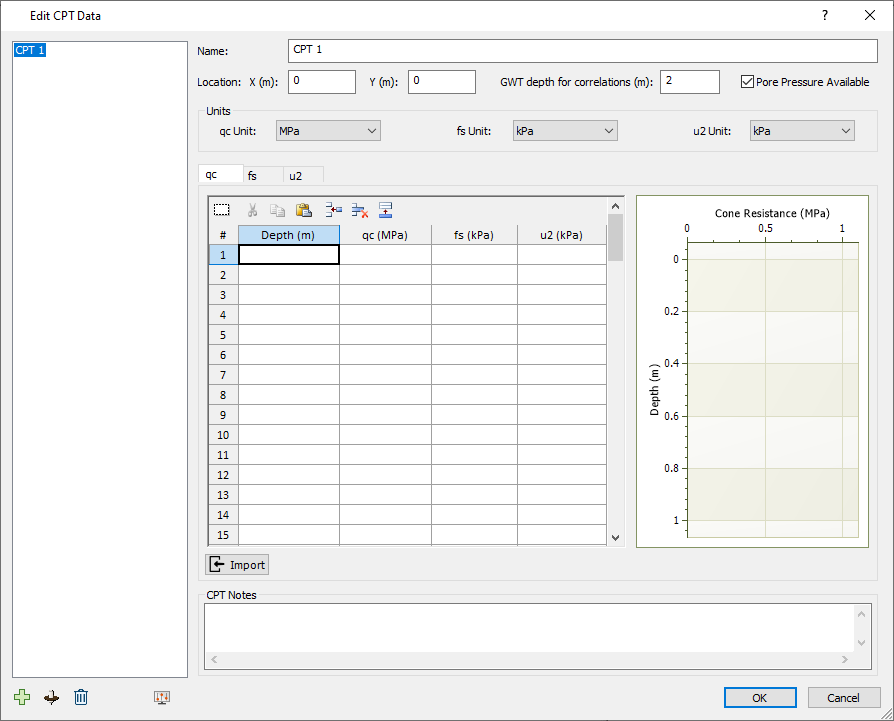
Select CPT > Add CPT
 to open the CPT Input dialog.
- Click the Import button below the table and import the file CPT Input.txt which should be available in the tutorial folder.
-
The Import Data dialog will appear. You can check the 'Auto Detect Data' and the data will be imported as shown below:
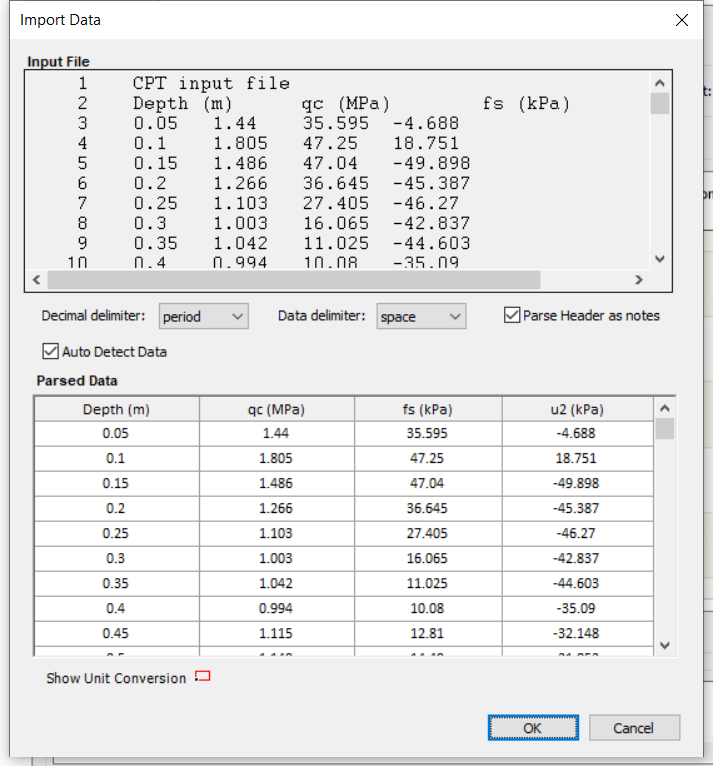
- Click OK to return to the previous dialog.
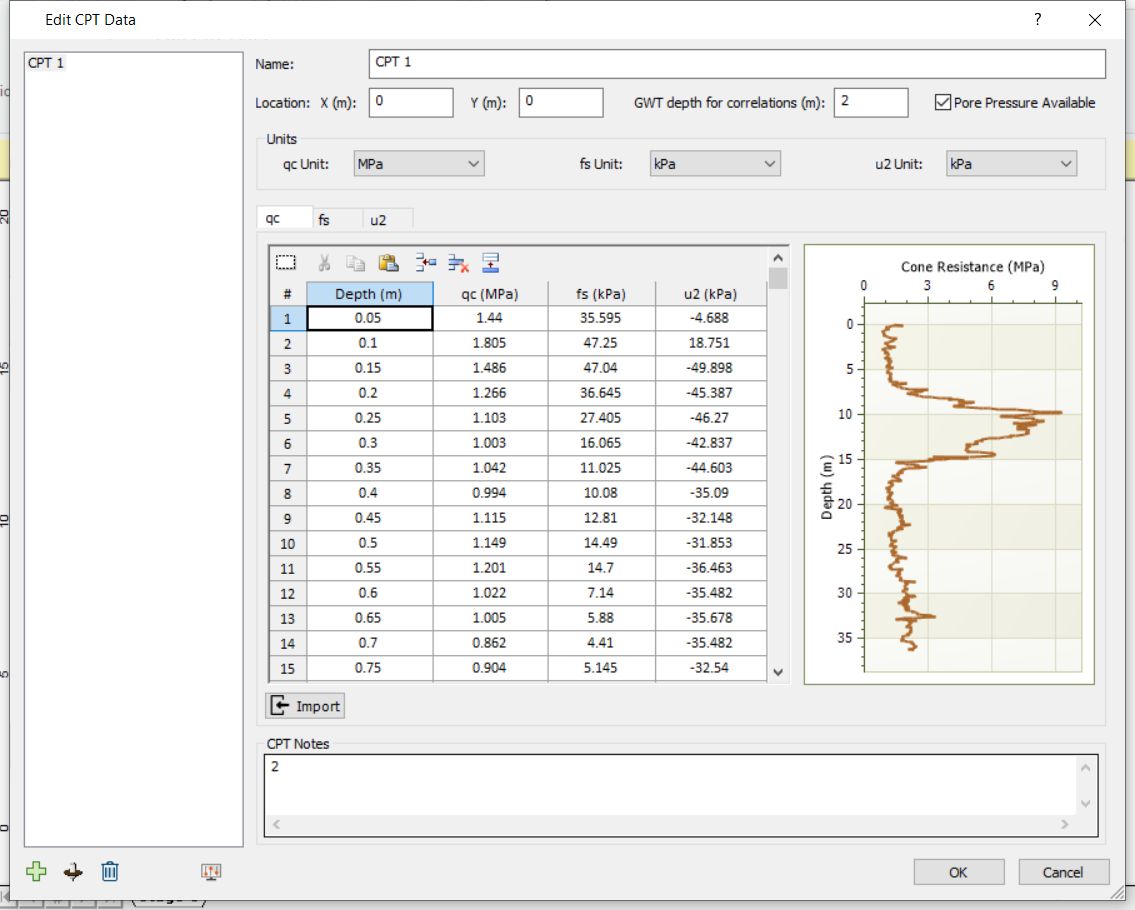
- Leave the GWT depth for correlations equal to 2 m.
- Keep the location to: x = 0 , y = 0. This will be where the CPT is put in the plan view of the model. The dialog should look as follows:
-
Click OK to close the dialog.
- Click on the left side of the screen to place the CPT anywhere in the Plan view.
4.0 Results Interpretation
- Right-click on the CPT point and select Graph CPT.
4.1 Tabular Results
Select the Results tab at the bottom of the Chart view. The default results shown are:
- Corrected Cone Resistance, qt
-
Unit Weight,

-
Effective Overburden Stress,

-
Total Overburden Stress,

- Stress Normalized Cone Resistance, Qt1
- Stress Normalized Friction Ratio, Fr
- Soil Type Index, Ic
- Normalized Pore Pressure, Bq
- Equivalent SPT N60
For a full list of the tabulated results, see the CPT Analysis Results.
4.1.1 Editing the Displayed Columns
You can edit the column displayed in the results by clicking the Edit Column  icon in the toolbar.

You can add any number of results to the Columns on display window. Just double click on the desired result in the Columns available to display window or select the desired results and use the Left Arrow ![]() icon to move them over.
icon to move them over.
The items in the Columns on display window can then be rearranged by using the up and down ![]()
![]() arrows.
arrows.
You can also use the Match to Charts option to match the column data to the displayed graphs.
4.1.2 Exporting Tabular Results to Excel
For exporting tabular results to Excel, there are two options available under the Export Data to Excel  icon.
icon.
- Shown Data
- All Data
With Shown Data, only the tabular results that are currently displayed will be exported. If you select All Data then all of the calculated CPT results will be exported.
4.2 Graphical Results
The data shown by default in the Inputs tab are:
- Cone Resistance, qc
- Sleeve Resistance, fs
- Pore Pressure, u2
These charts cannot be manipulated.
The charts in any of the Results tabs though (by default, one is created), CAN be customized. The charts shown in the Results tab by default are:
- Stress Normalized Cone Resistance
- Stress Normalized Friction Ratio
- Normalized Pore Pressure
- Robertson 1986 SBT Chart classification
To get a full-screen view of the results graphs, click on View Mode  > Expand Chart View
To reorder the charts, click on the Reorder Charts  icon.
icon.

In the CPT Chart Output dialog you’ll be able to:
-
Add Charts

-
Delete Charts

-
Reorder Charts


-
Reset the Charts to the defaults

4.2.1 SPT Plots
- To view the SBT plots, click on the Plot SBT Zone
 icon. The following chart should appear:

Use the dropdown in the SBT Zones dialog to change the chart type. You can export and save the image using the Export Image option.
5.0 Advanced Topics
5.1 Soil Profile from CPT
-
Right-click on the CPT point and select CPT Soil Classification
 .
.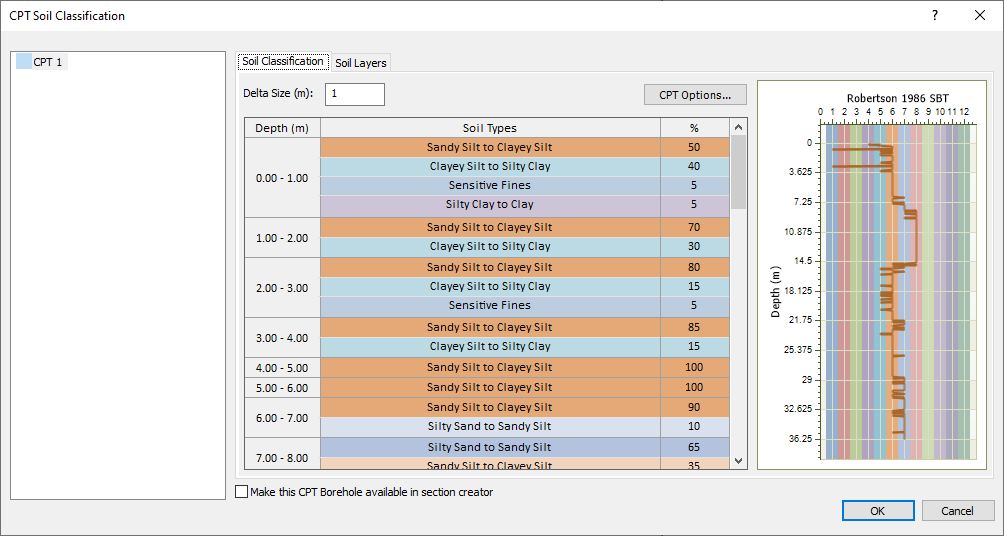
- You will be guided through the Soil Profile option.
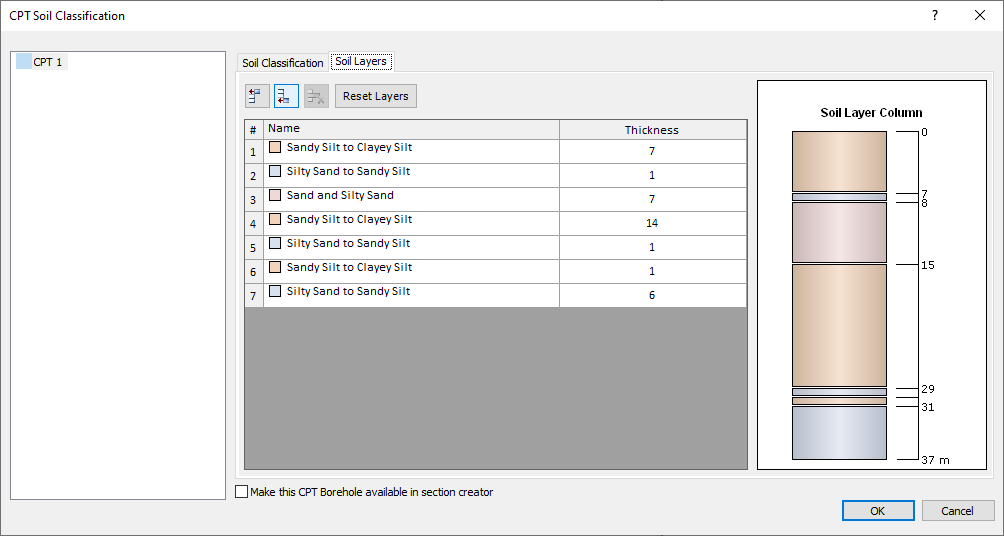
On the Soil Classification tab, you’ll see a breakdown of the soil types within each depth range. The method used can be changed using the CPT Options button. The predominant soil type will be used as the soil type for that depth range. You can change the size of the depth range using the Delta Size input. For now, leave the Delta Size equal to 1. - Select the Soil Layers tab. The soil profile has now been determined using the Robertson 1986 method, with a Delta Size of 1m.
-
You will see the merged soil layer column with the thickness of each soil layers defined as shown below.
- Click OK to Exit the dialog. Note this profile is only for visual purposes with CPT data input and soil classification. This soil profile is not used for the soil model in Settle3.