Rocscience International Conference 2025 is going to take place in Sydney, Australia Read more

Search Results

CPT Chart Controls

The CPT graphs are customized in the CPT Chart Controls sidebar.
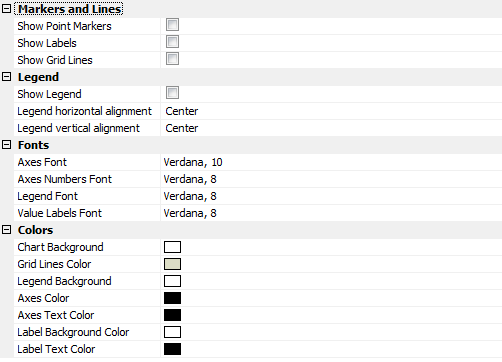
CPT Chart Controls

The following can be customized in the Chart Controls section of the sidebar: Markers and Lines, Legend, Fonts, and Colors.

CPT Chart Controls Sidebar
CPT Chart Controls sidebar

Vertical Axis Options

The vertical axis is the Depth axis in the CPT charts. The vertical axis can be automatically or manually scaled. This scaling applies to all displayed CPT charts.

Horizontal Axis Options

The horizontal axis of each displayed graph can be individually customized. Each individual charts axis can be scaled automatically or manually.

Rocscience logo, click here to return to the homepage Portal Account Portal Account Log In Log Out Home Shopping Cart icon Click here to search our site Click here to close Learning Tech Support Documentation Info Chevron Delete Back to Top View More" Previous Next PDF File Calendar Location Language Fees Video Click here to visit Rocscience's LinkedIn page Click here to visit Rocscience's YouTube page Click here to visit Rocscience's X page Click here to visit Rocscience's Facebook page Click here to visit Rocscience's Instagram page Click here to visit Rocscience's Reddit page Bookmark Network Scroll down for more Checkmark Download Print Back to top Single User Multiple Users RSLog RocFall3 CPillar Dips EX3 RocFall RocPlane RocSlope3 RocSupport RocTopple RS2 RS3 RSData RSPile Settle3 Slide2 Slide3 SWedge UnWedge RocTunnel RocSlope2 Commercial License Education License Trial License Shop safe & secure Money-back guarantee