Results Customization Options
By default, both graphical and tabular results are shown in the Charts tab of the Graph Pile view. To graph your pile results:
- Select Results > Graph Pile
 and use your mouse to select the pile, or right-click the pile and select Graph Pile.
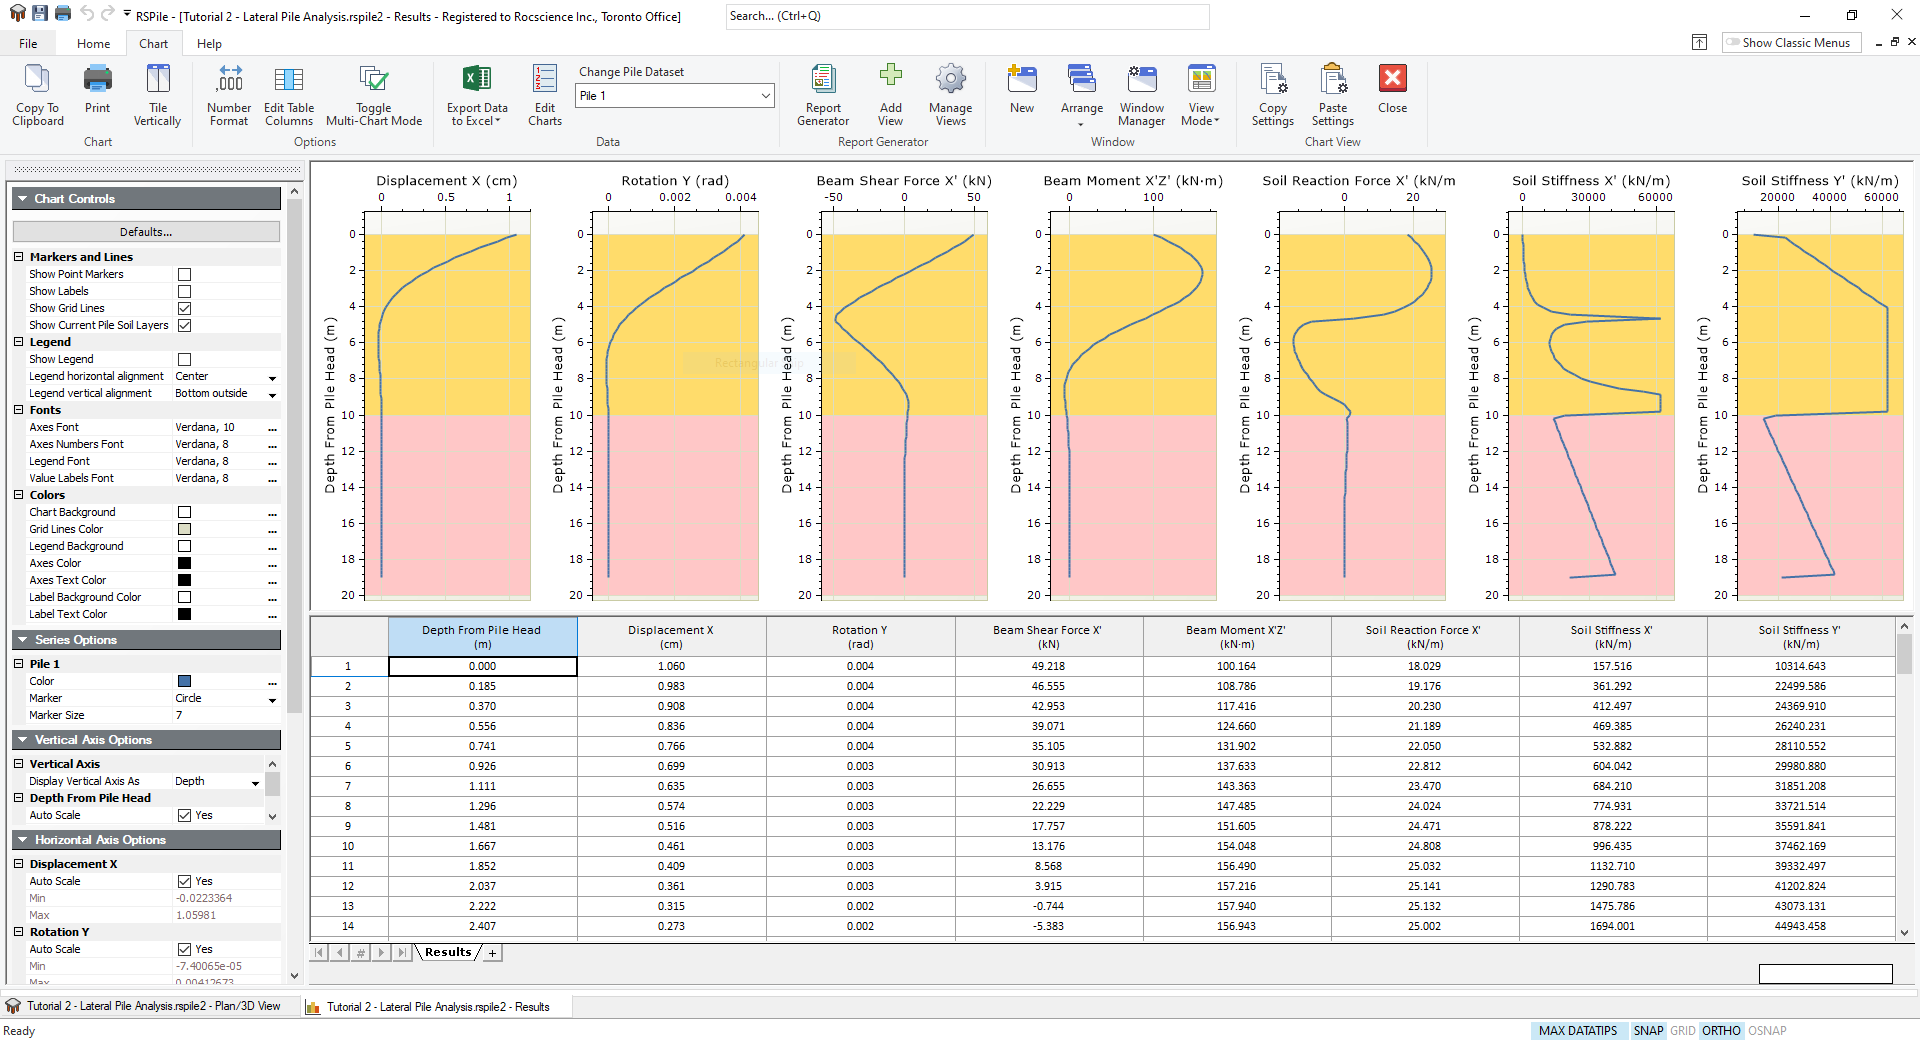
- The charts order and visible results can be set in the Edit Charts dialog, accessed by clicking on the Edit Charts
 button on the toolbar.
 - The number format in the grid can be switched between Decimal and Scientific, and the number of decimal places can be specified, in the Number Format dialog, accessed by clicking on the Number Format
 button on the toolbar.
 - The results shown in the tabular results section can be selected in the Edit Table Columns dialog, accessed by clicking on the Edit Table Columns
 button on the toolbar. The Match to charts button allows you to sync the tabular results to the displayed chart results.
 - Results can be exported to Excel by click on the Export Data to Excel
 button on the toolbar. By clicking on the dropdown arrow users can choose between two options, Shown Data and All Data.
 - Results can also be export in a report format using the Report Generator
 option. See the Report Generator page for more details.
LEFT SIDE TOOLBAR
The toolbar on the side of the results window contains the:
- Chart Controls
- Series Options
- Vertical Axis Options
- Horizontal Axis Options
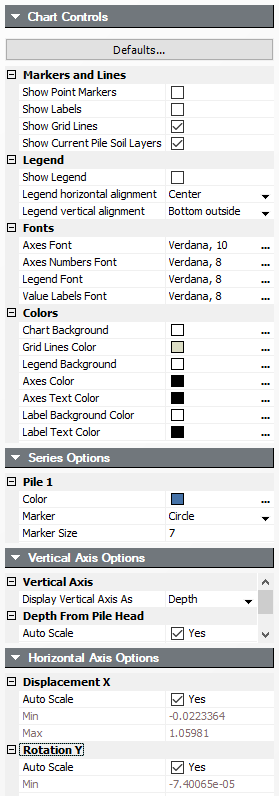
CHART CONTROLS
The Chart Controls can be used to control the look, layout and visibility of your graphed data.
Graphing Multiple Piles
When Graphing Multiple Piles, a Legend is automatically shown with the graphed data. If you select more than 10 piles though, the legend will be not automatically be shown (this is to allow for more space for the graph). To view the legend, simply select Show Legend in the Chart Controls shown above.