Embankment Consolidation
1.0 Introduction
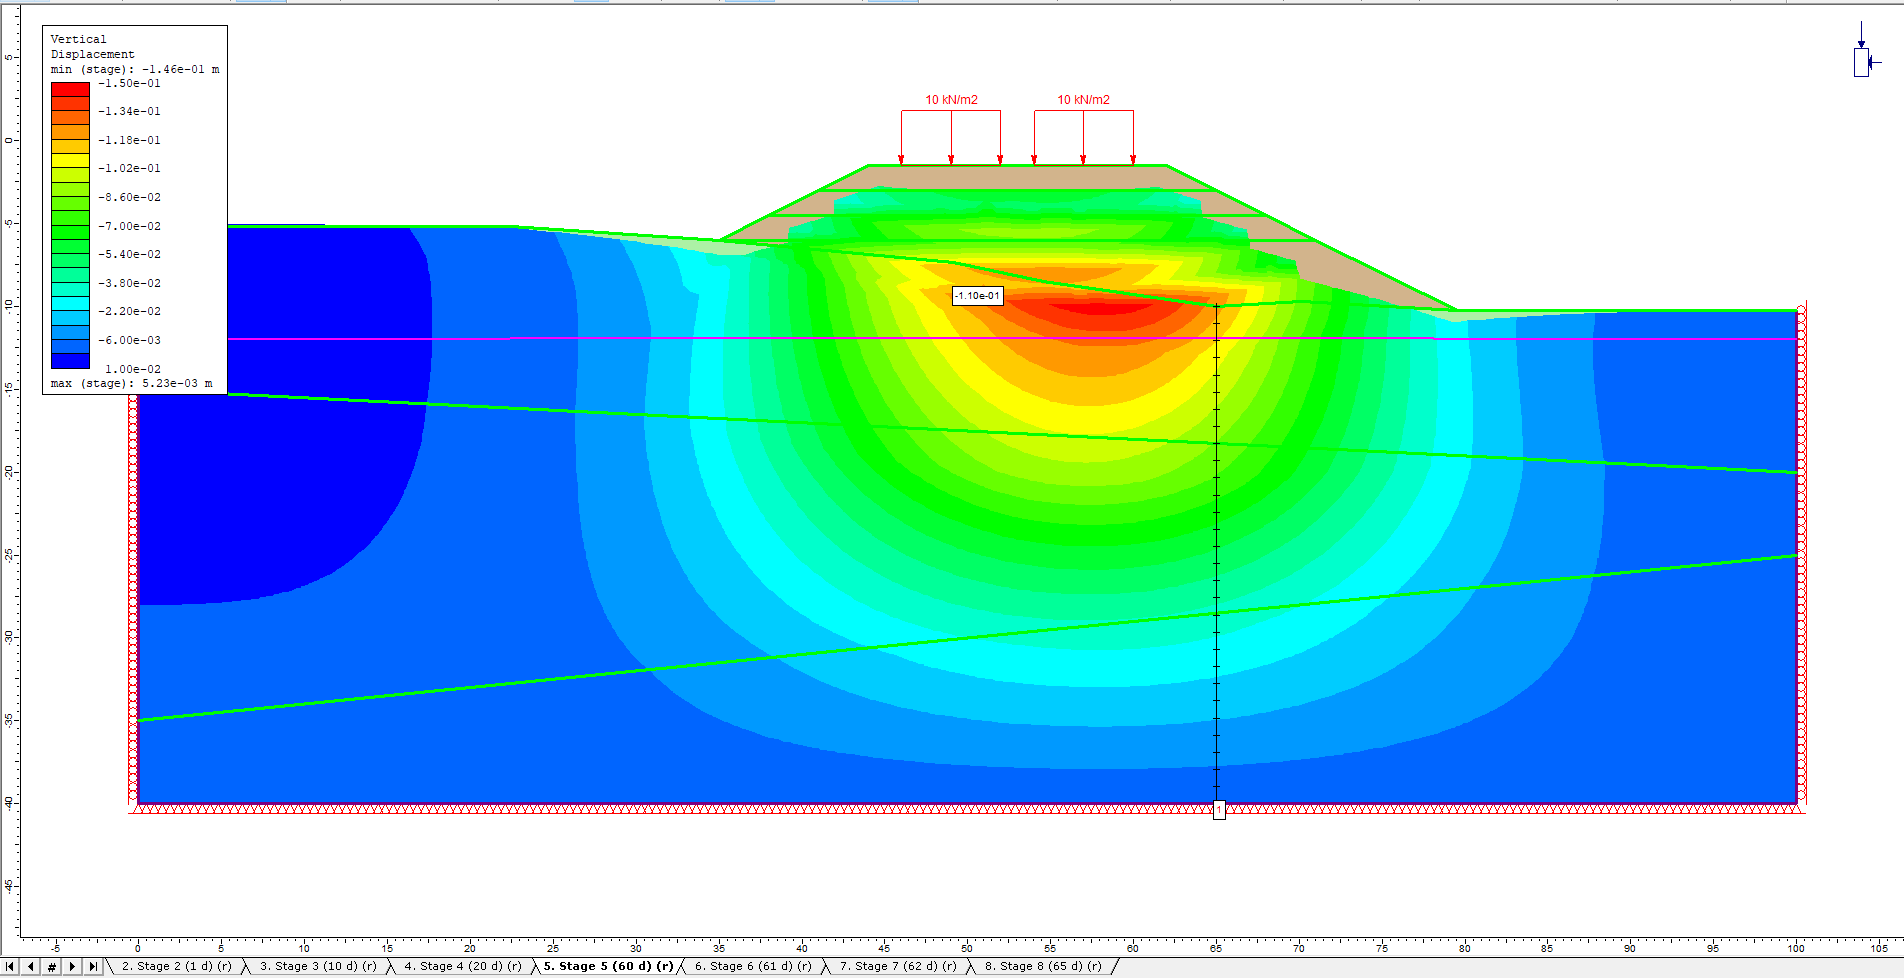
In this tutorial, RS2 was used to model a coupled analysis of a road embankment subject to loading from typical daily traffic. The embankment was created by assigning appropriate material and hydraulic properties to the geometry shown below. The green layer represents Silty Sand I, the pink Silty Sand II, and the purple Dense Silty Sand. Each material differs in terms of permeability. The embankment is filled in stages such that at Stage 5 the embankment has been completely filled with the Embankment Fill material (brown). Note that groundwater boundary conditions have been set. To apply a surcharge to the soil surface on top of the embankment to represent traffic loading, a uniform load of 10 kN/m2 was applied on the ground surface of the embankment for stages 5 through 8.
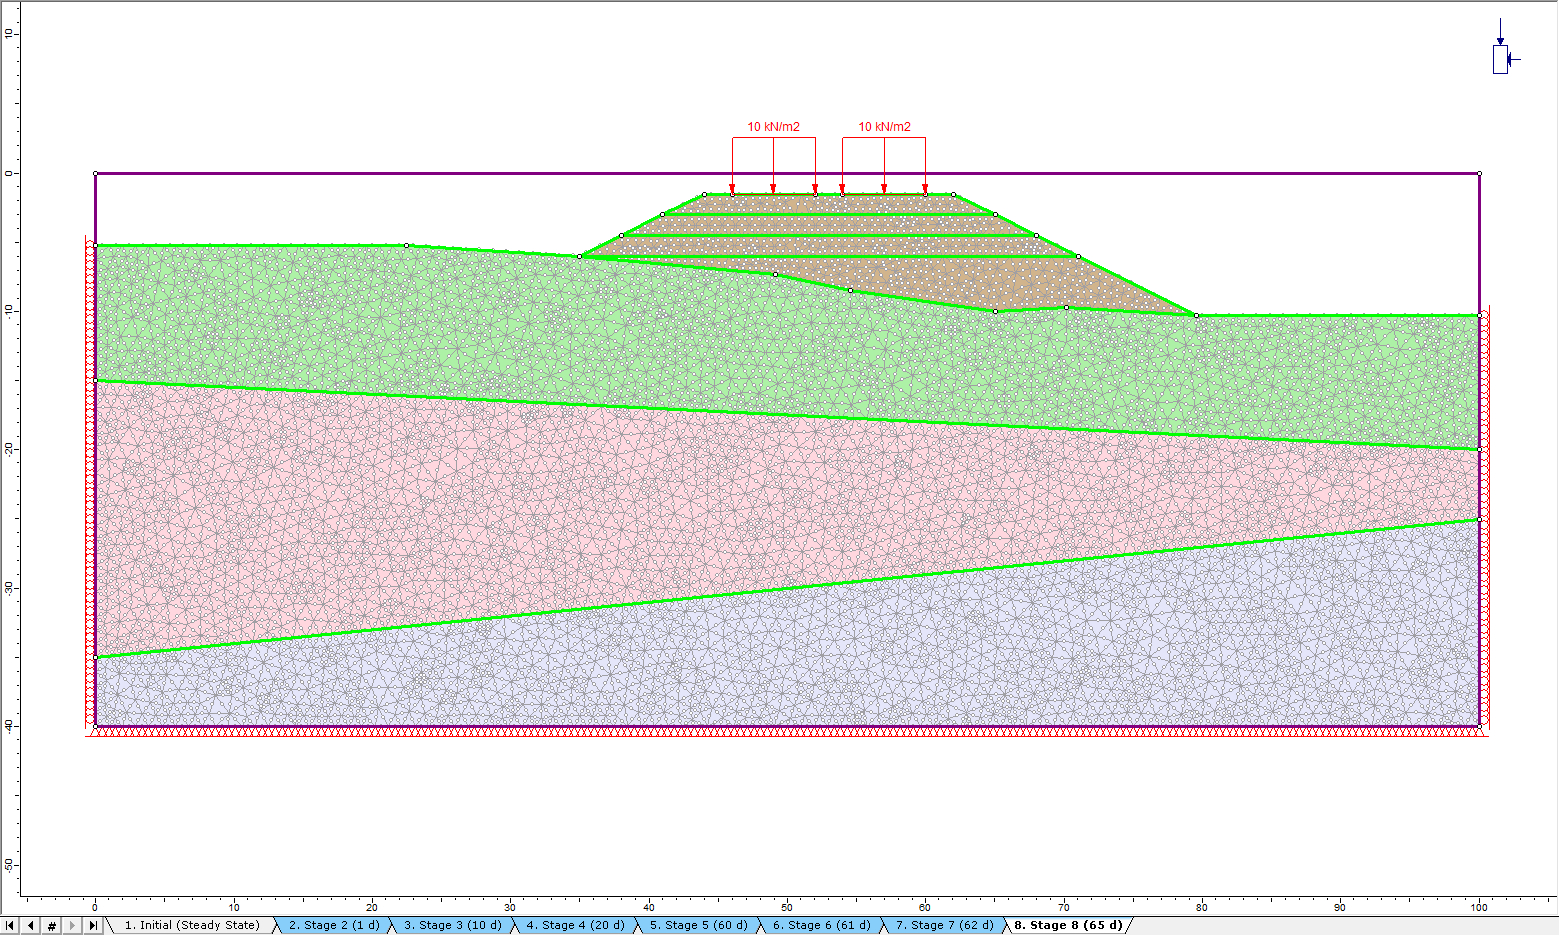
The tutorial model already has project settings outlined, boundaries created, and materials and properties defined. Materials have been assigned to the model and the embankment lifts filled in stages. The model was then meshed, and a water table modelled at the depth of the lowest point on the embankment. A uniform load was applied in stages to simulate the presence of traffic on the embankment. For additional information about model construction, consult the RS2 User Manual. This tutorial focuses on analyzing the results of the model using RS2 Interpret.
Want to watch the video version of this tutorial? Check it out here:
2.0 Compute
- Select: File > Recent Folders > Tutorial Folder
- Open the Embankment Consolidation starting file.
- Select: Analysis > Compute

The analysis should take a few minutes to run.
3.0 Results and Discussion
- Select: Analysis > Interpret

3.1 Pressure Head
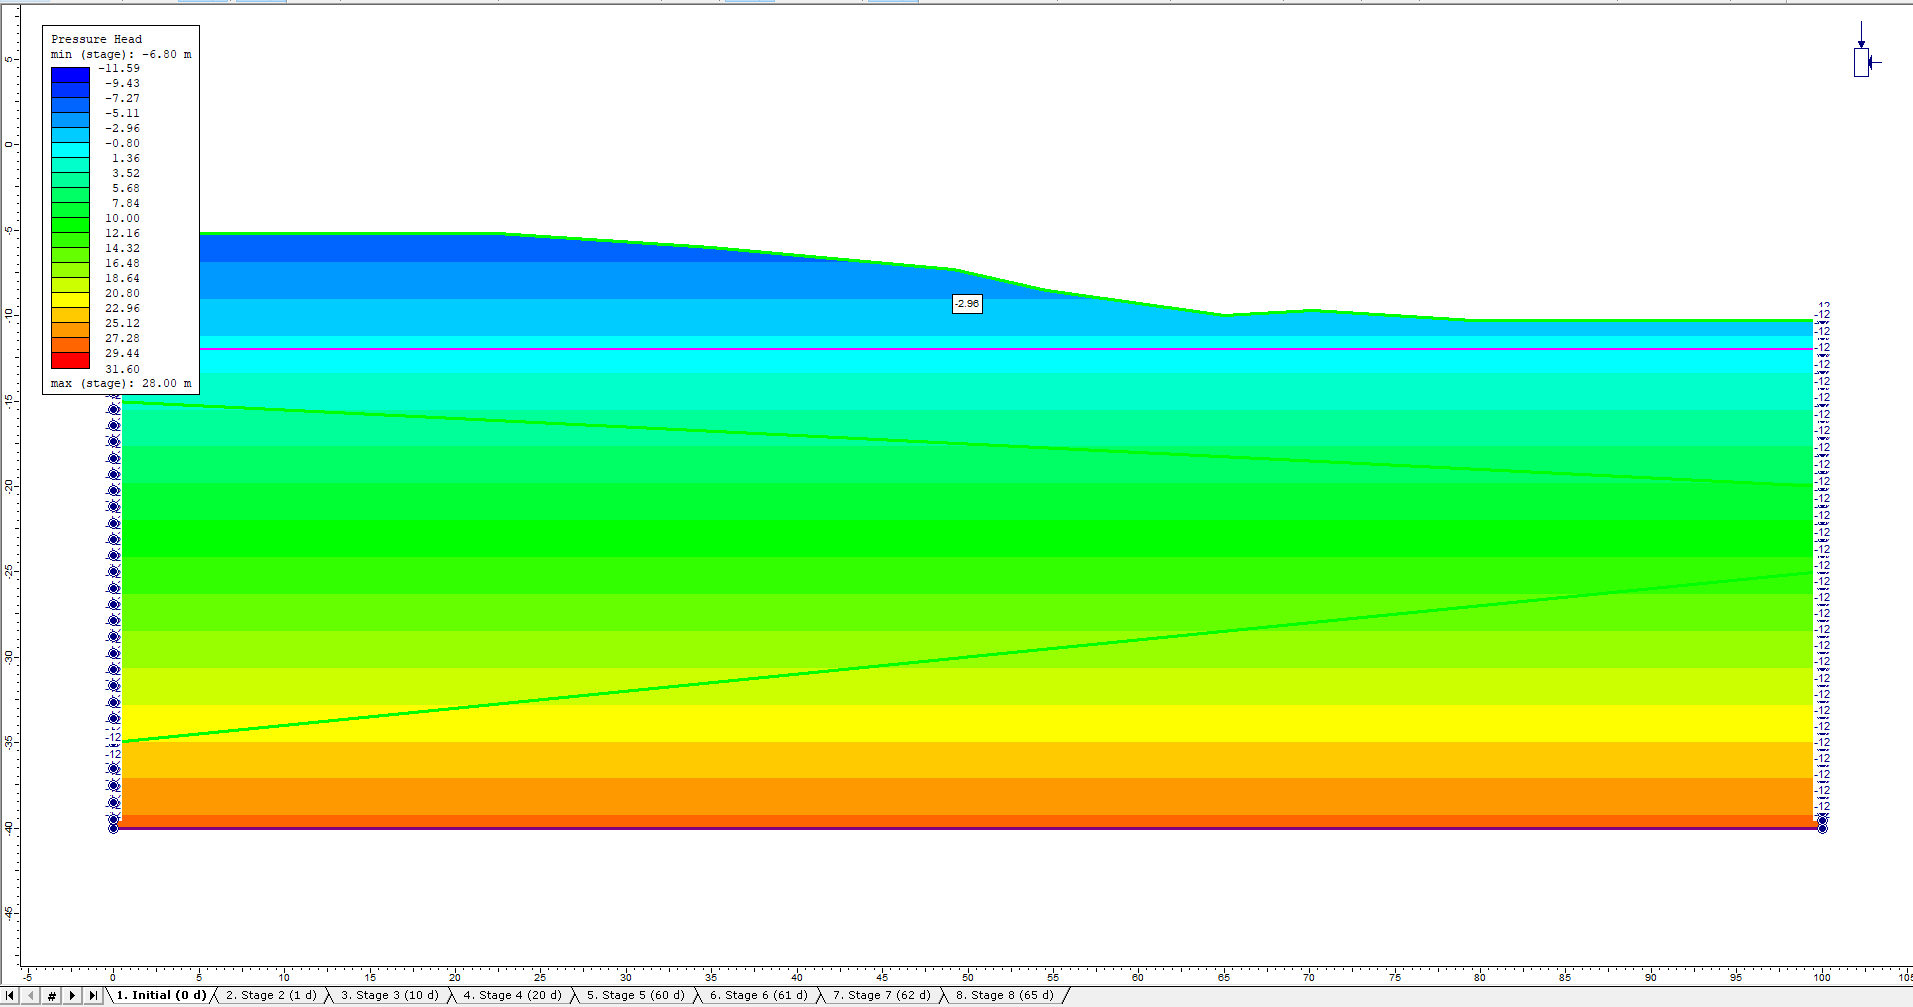
- Select: Seepage > Pressure Head from the drop-down menu.
Notice the legend on the left side of the view. The legend is automatically adjusted to the values at each stage. - Select: View > Contour Options.
- To have a uniform contour range for all stages, select Auto-Range (all stages).
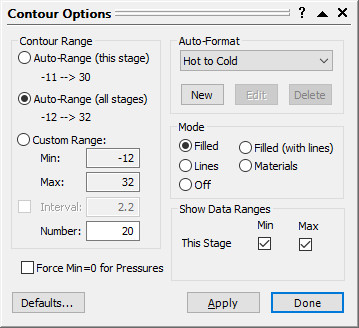
- Turn on the Label Contour icon from the top toolbar to show the contour value of a selected point. The point location can refer to the graph below.
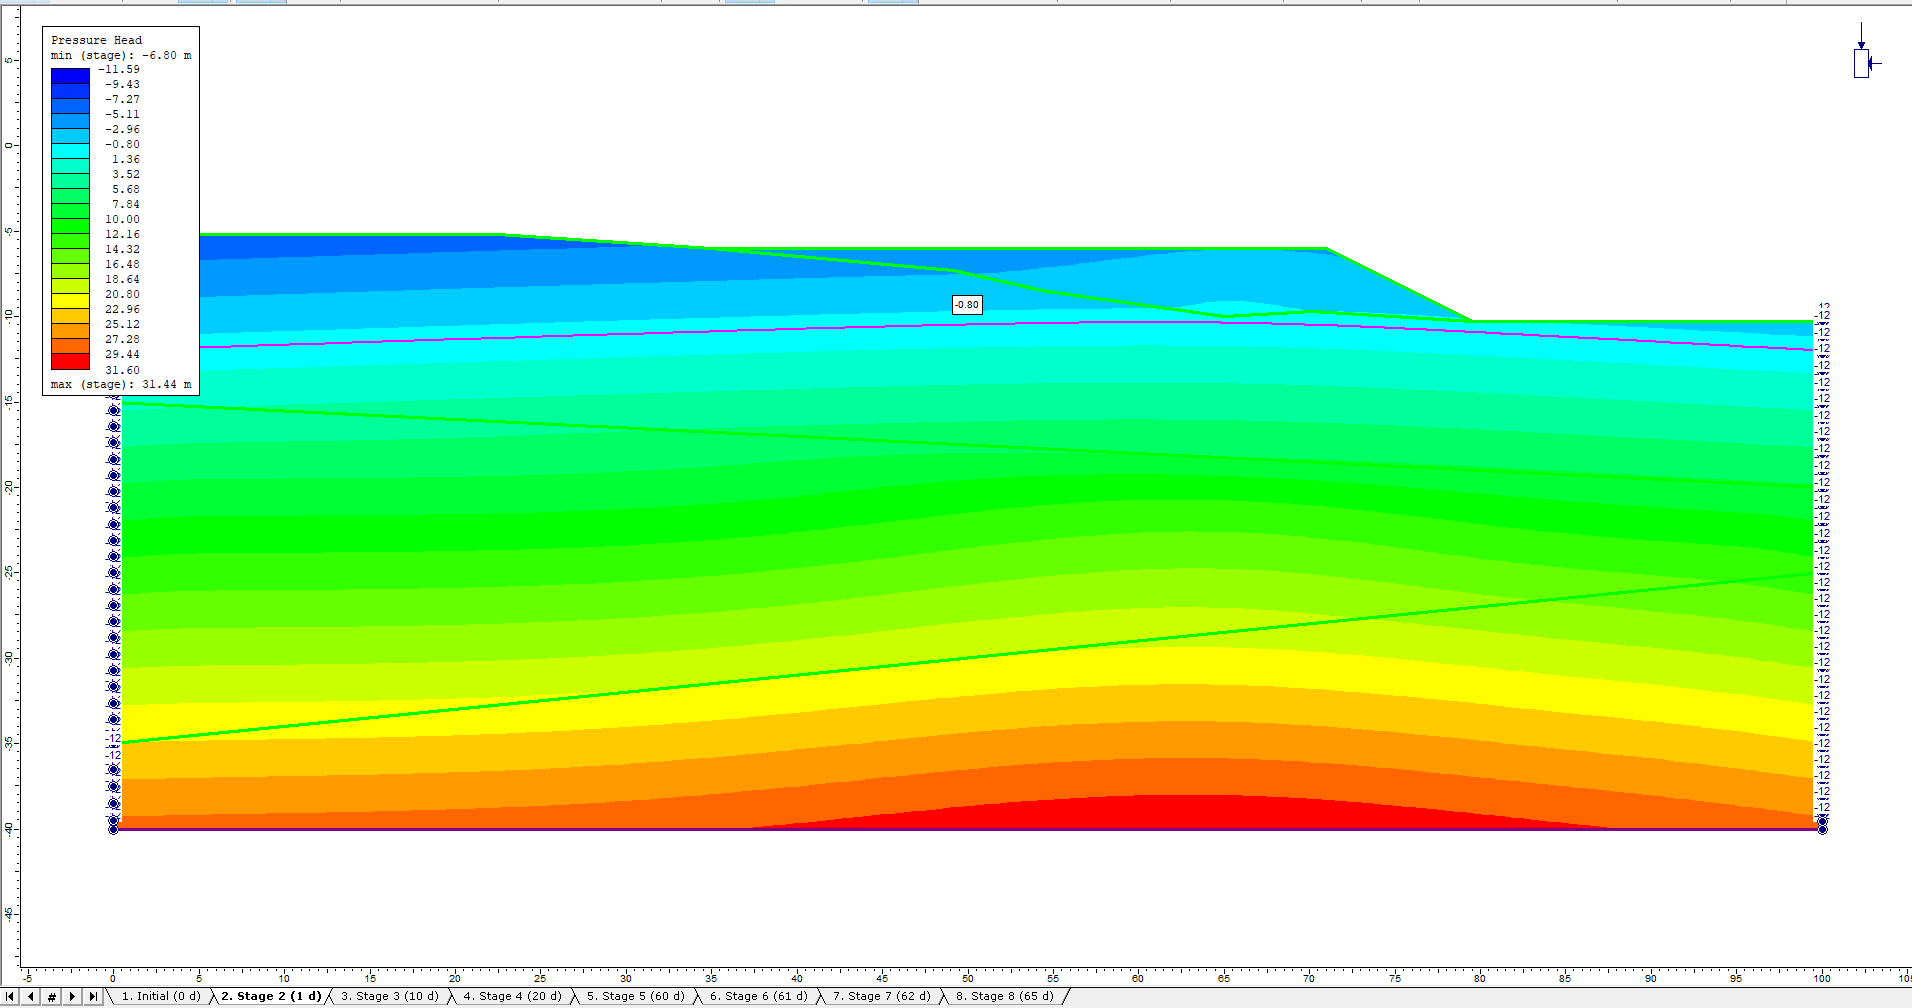
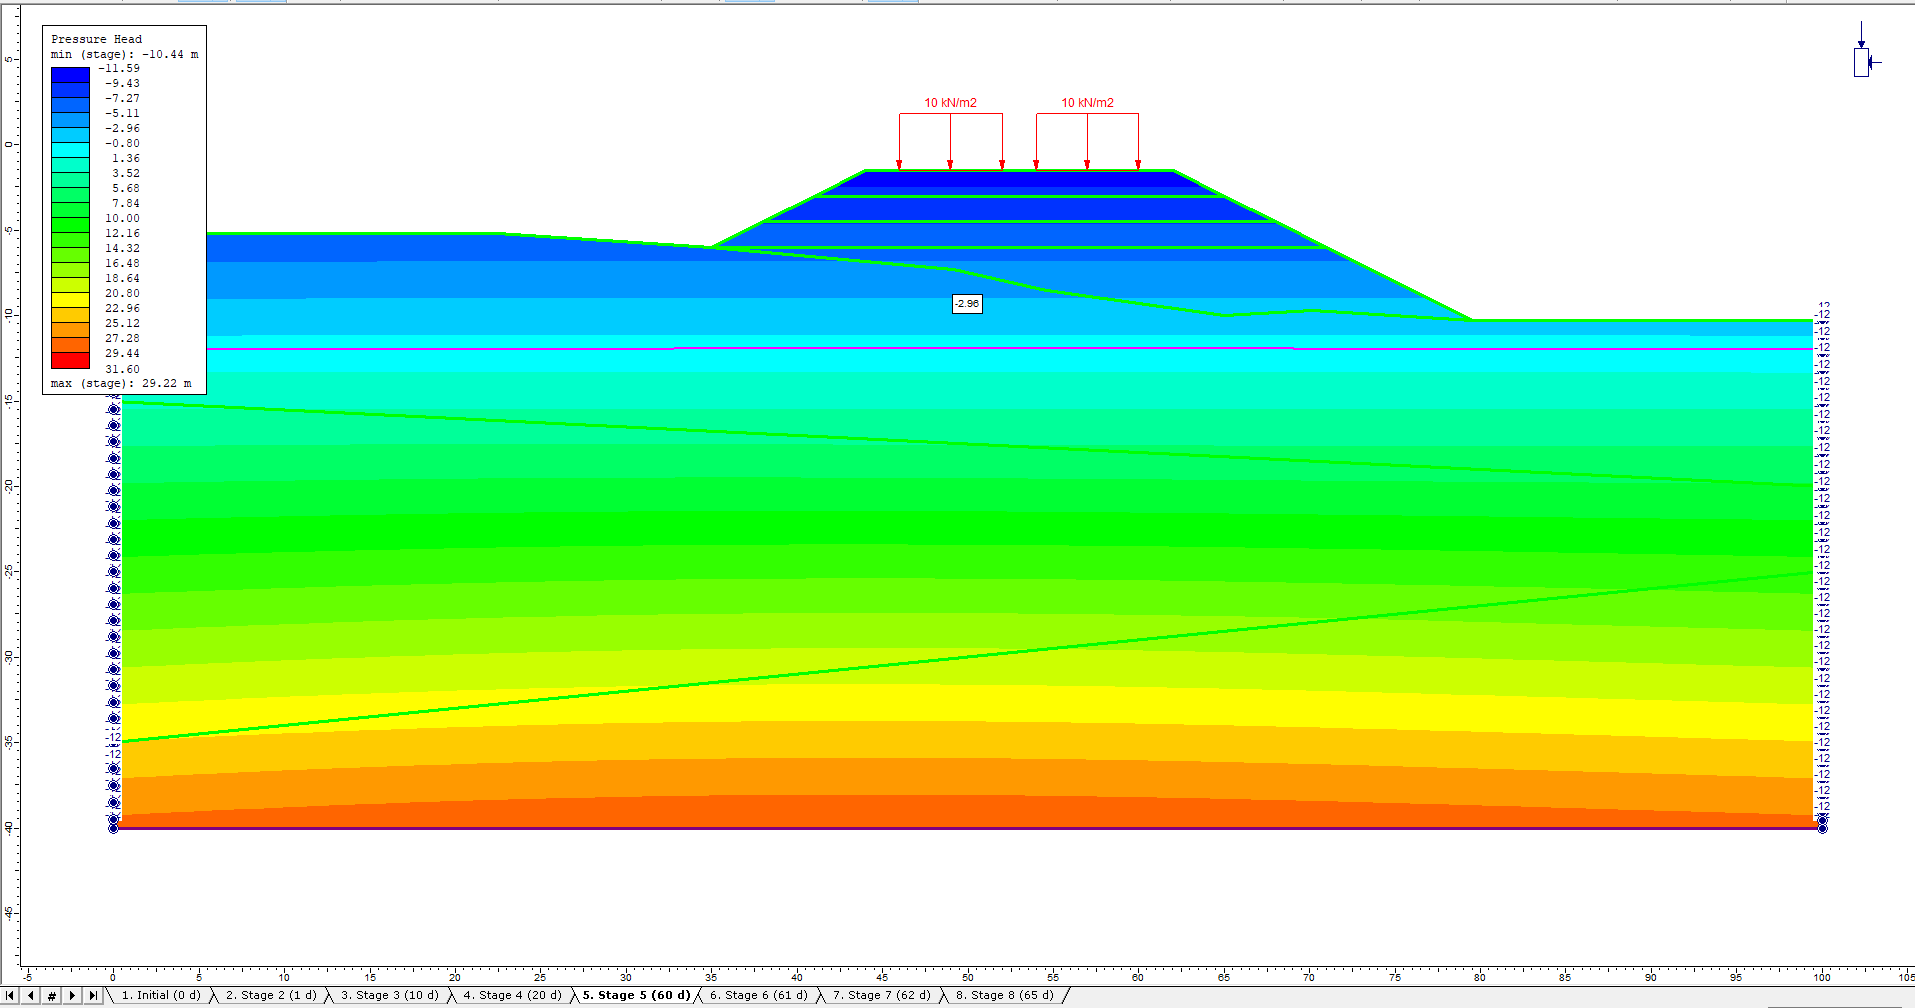
Now let’s flip through the stages and see what happens to the water table as the embankment is constructed and traffic loads are added. Notice the water table (zero pressure head) is highlighted by a pink line superimposed on the contours.
Initial Stage (0 d):
Stage 2 (1 d):
Stage 5 (60 d): The embankment installation is complete and traffic load is applied.
Stage 8 (65 d):
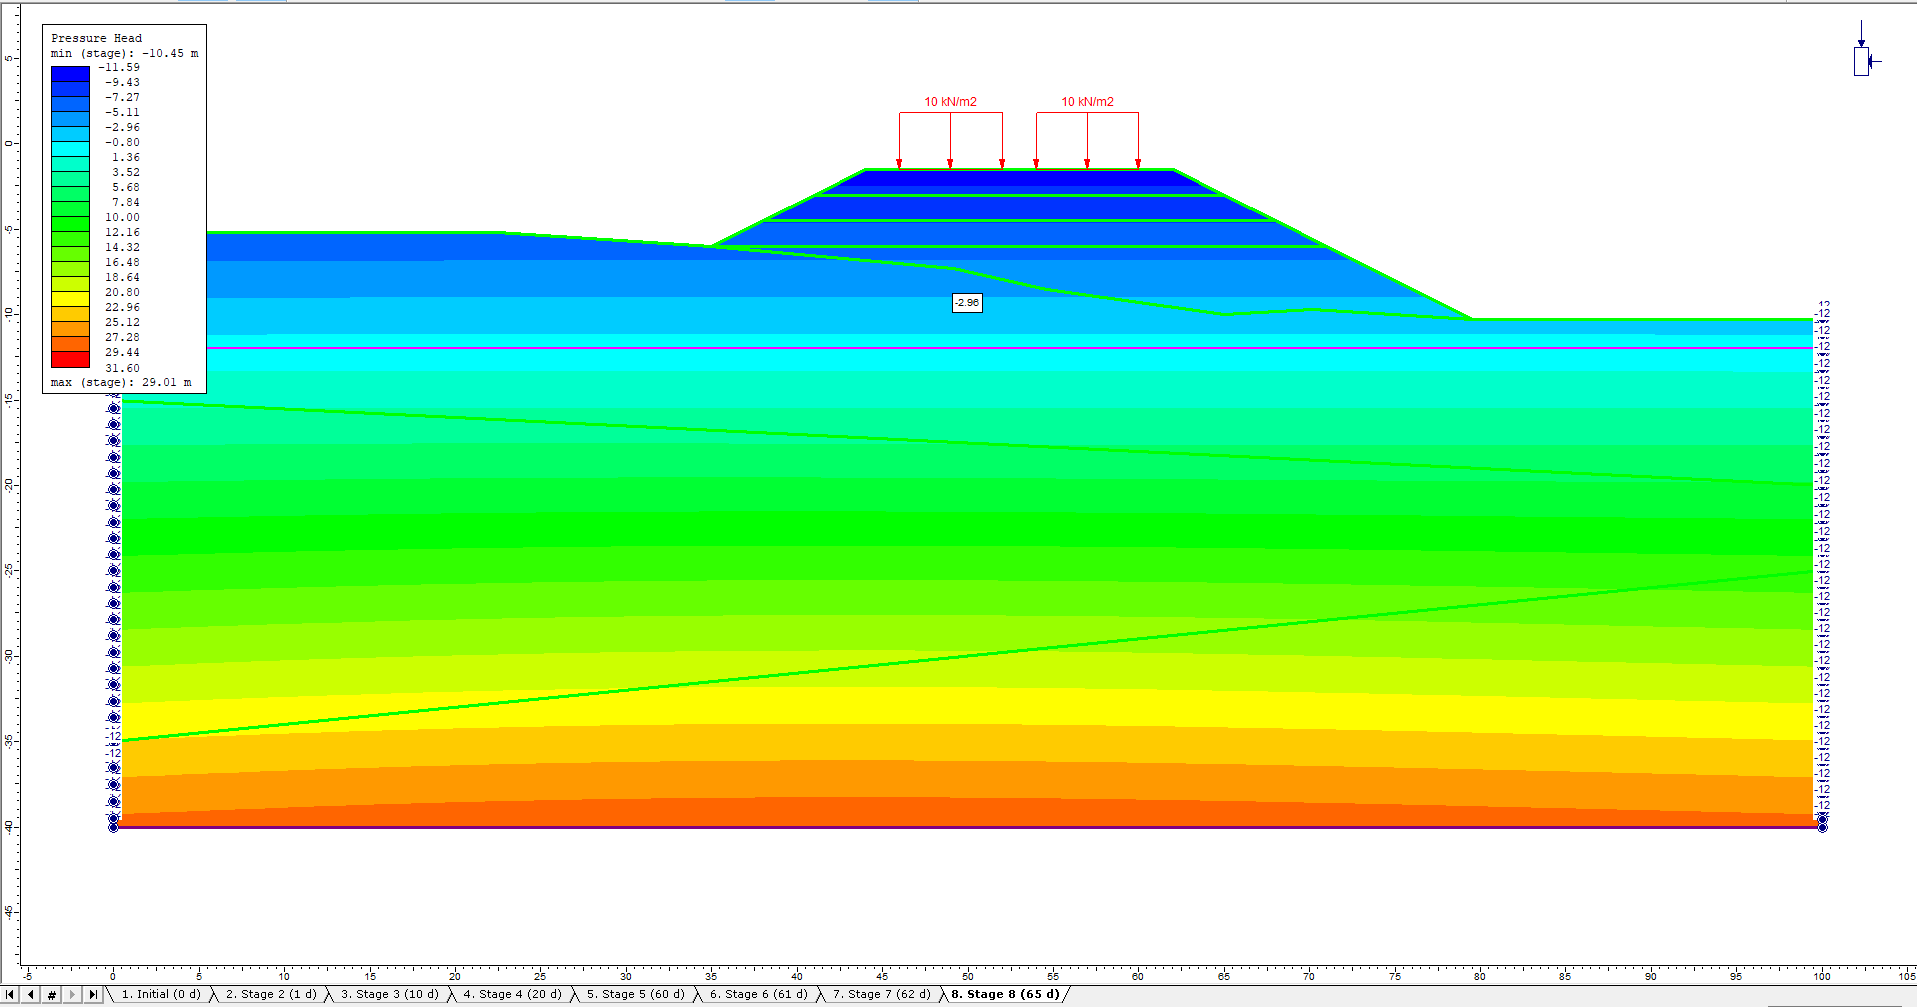
Very little change in pressure head occurs between the last few stages.
3.2 Excess Pore Water Pressure
Let’s view only the excess pore pressure due to the construction of the embankment. Set the in-situ conditions as the reference stage.
- Right-click any stage tab at the bottom of the screen and select Stage Settings as shown.
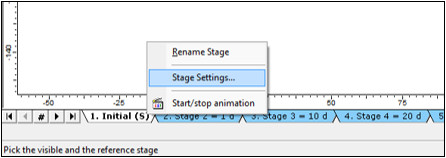
The following Stage Settings dialog should appear: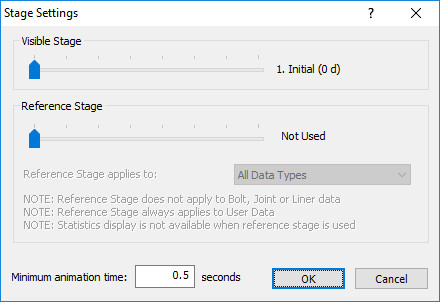
- Drag the Reference Stage indicator to the right until "Not Used" changes to "Initial" as shown. The current Visible Stage is not important in this process. The initial stage has been set as the reference stage. The solid results of all other stages are calculated with respect to the solid results of the reference stage.
New Results = Current Stage Results – Reference Stage Results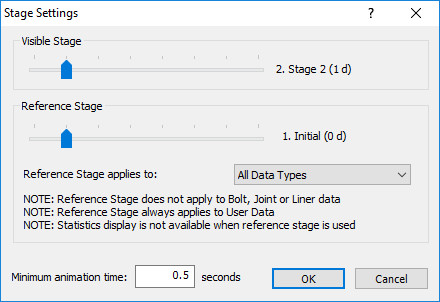
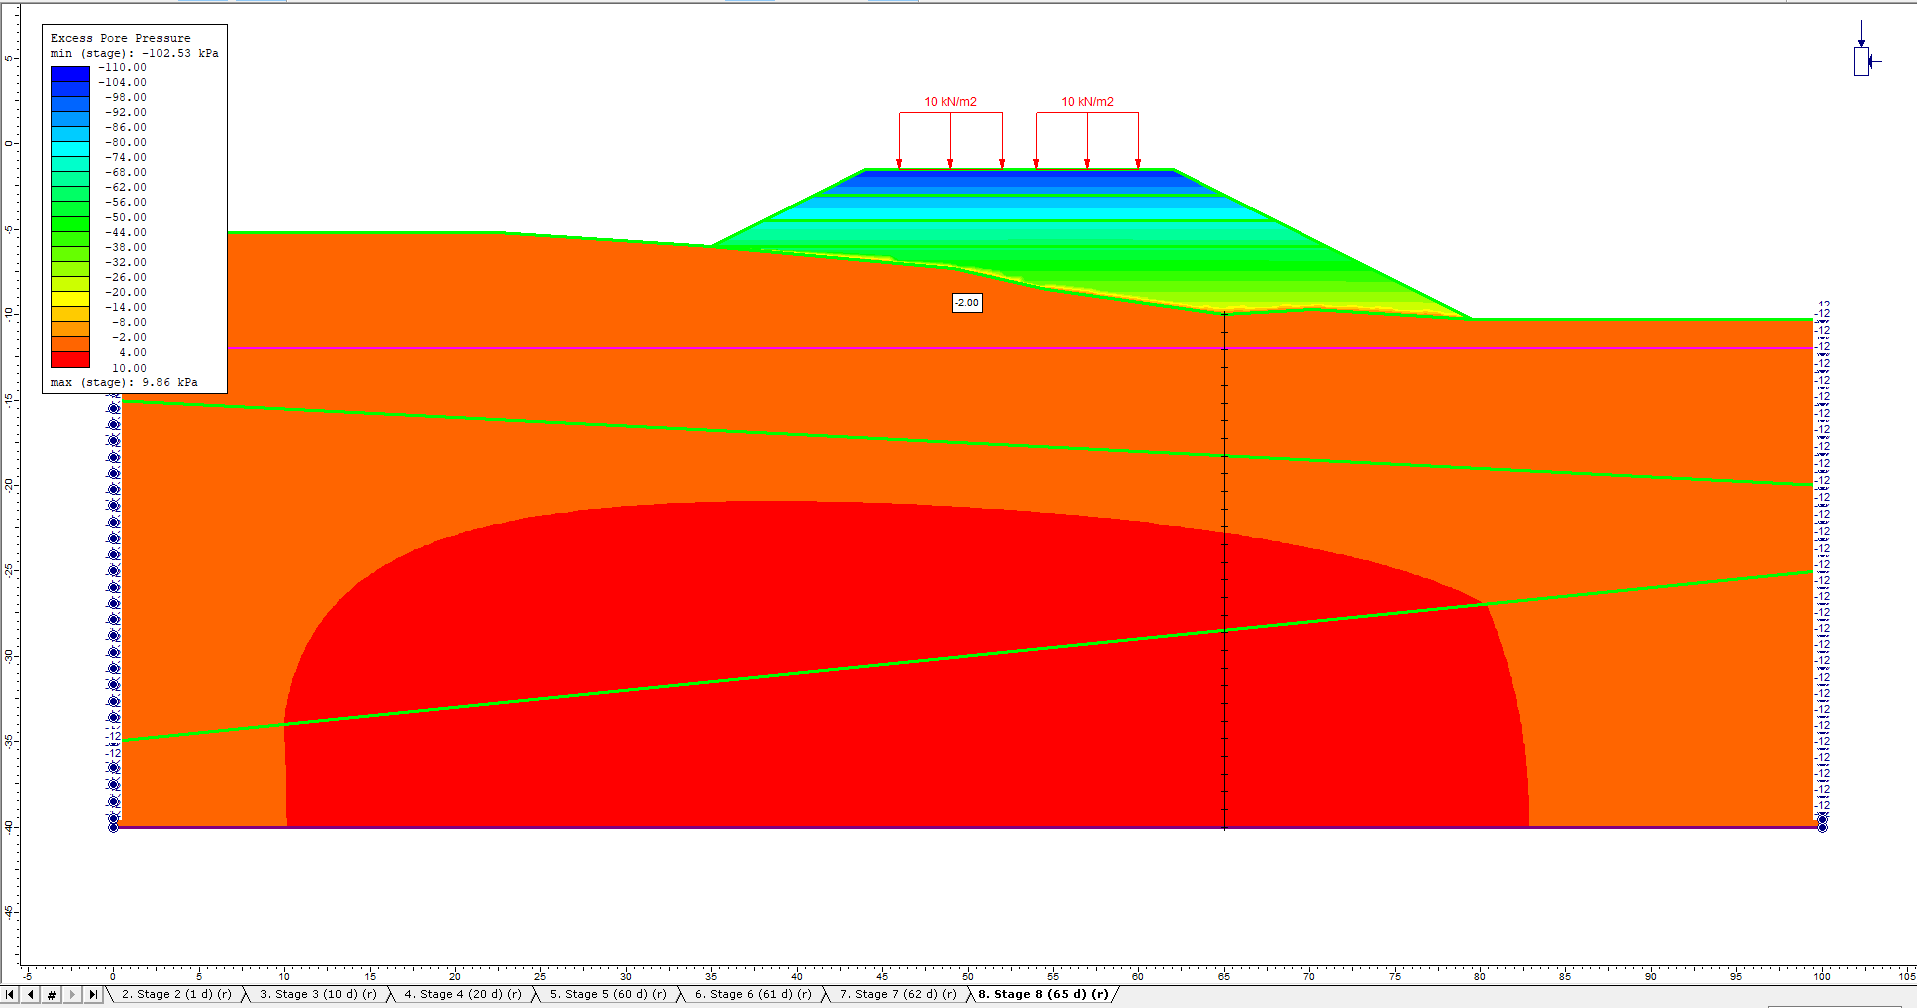
- Select: Seepage > Excess Pore Pressure from the drop-down menu
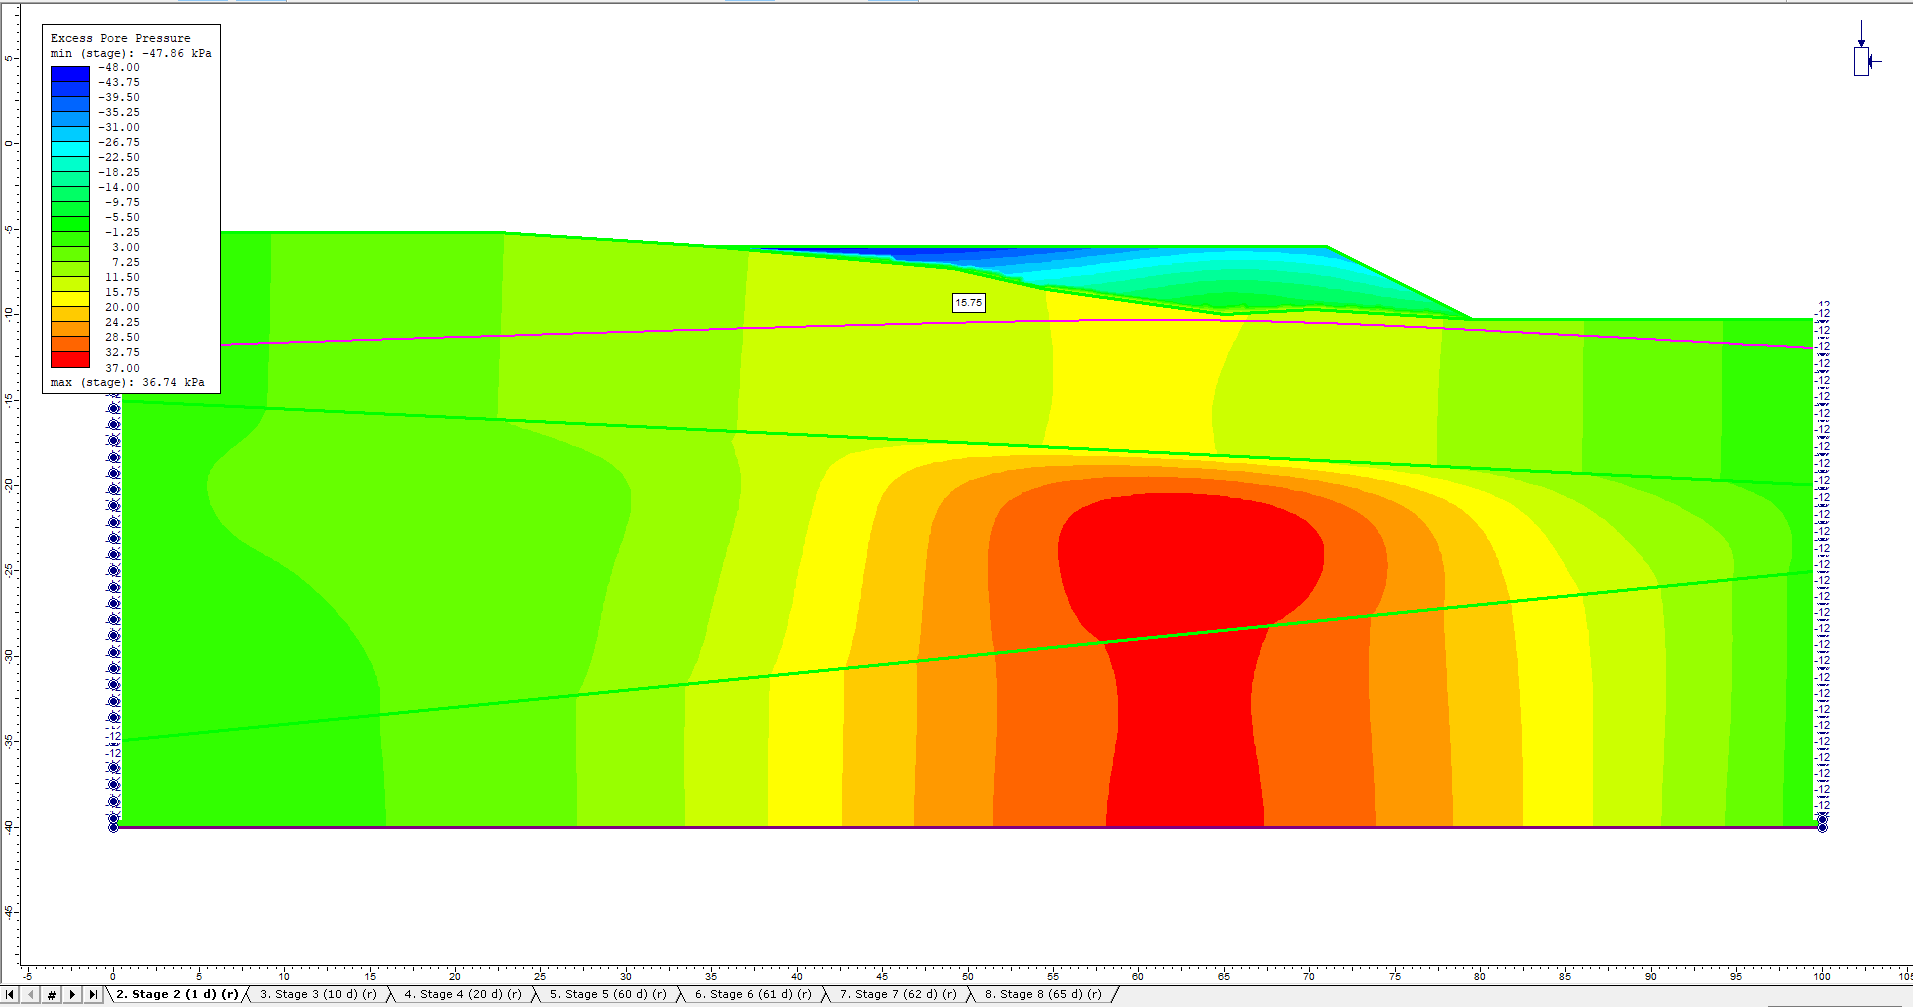
Notice how the excess pore water pressure builds up under the embankment and then dissipates over time.
Stage 2 (1 d):
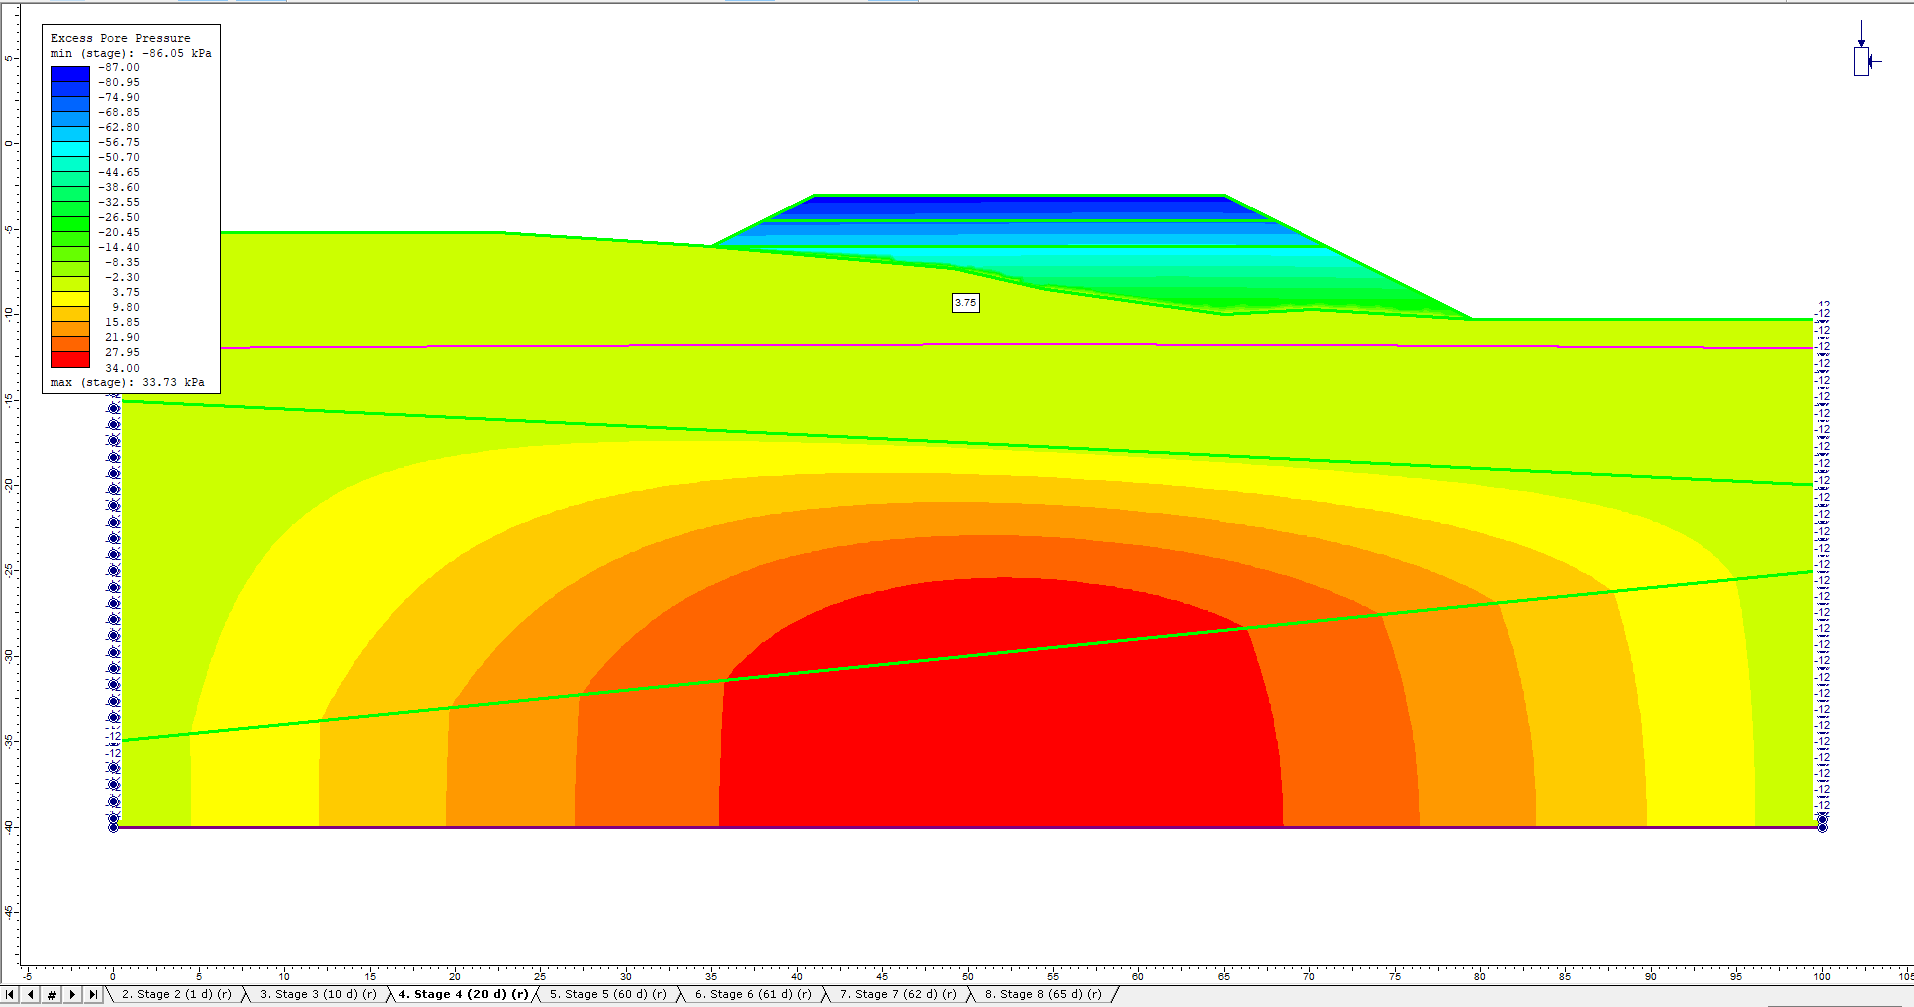
Stage 4 (20 d):
Stage 5 (60 d):
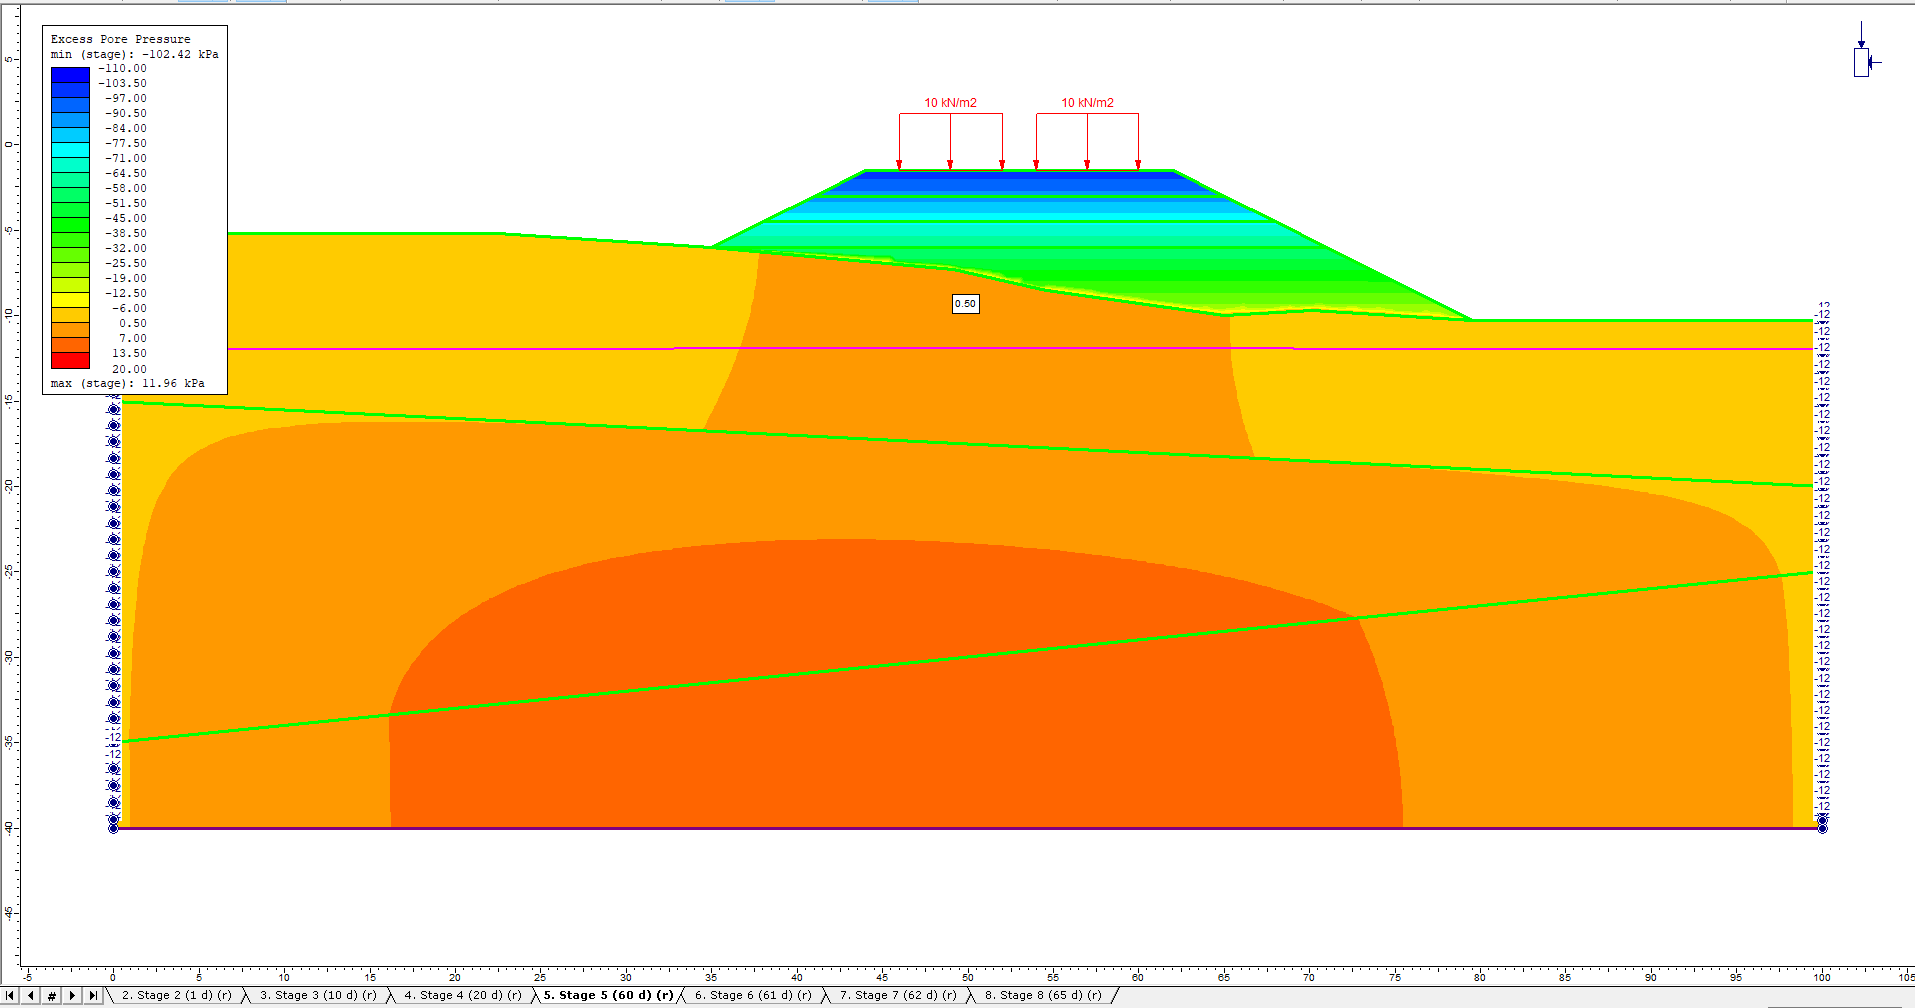
The maximum excess pore pressure in the bottom soil layers under the embankment decreases from near 40 kPa to less than 10 kPa after stage 5. Not much change occurs between the last few stages after the installation of the embankment is complete and the traffic load is added.
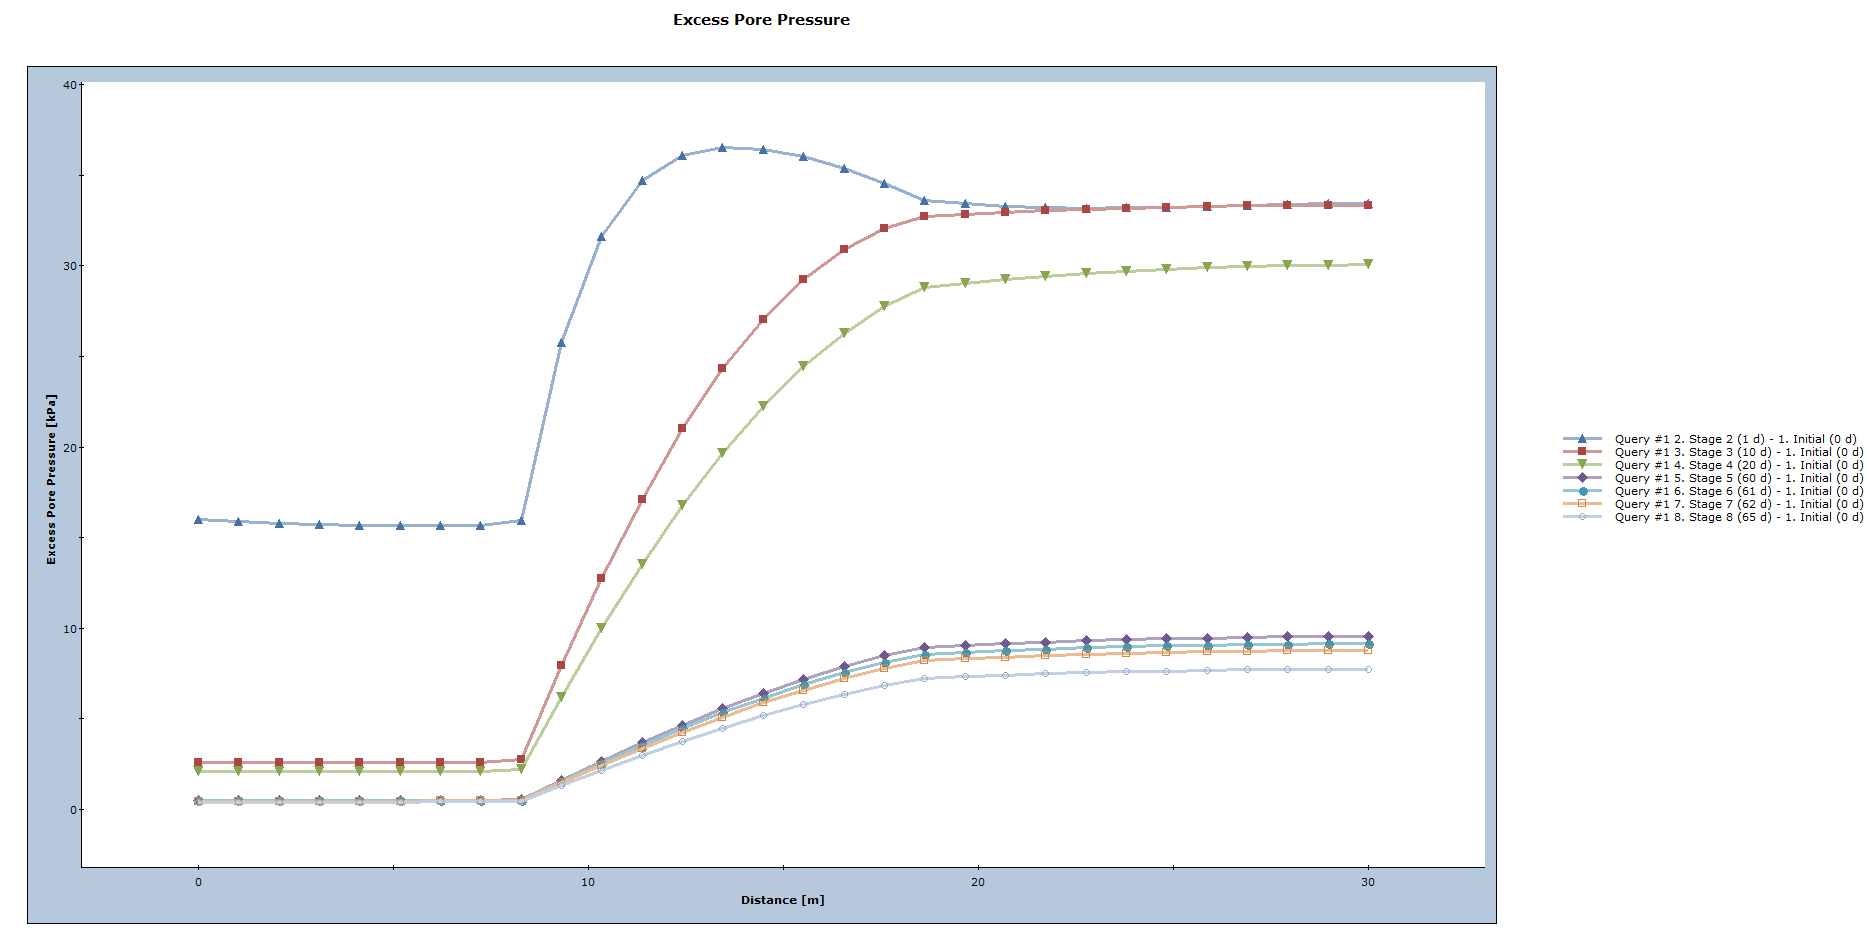
Add a vertical material query line from the bottom of the embankment to the bottom of the external boundary and graph the query.
- Select Query > Add Material Query.
- Enter coordinate (65, -10) as the first point, and (65, -40) as the second point. Press Enter to complete selection.
- In the Specify Query Location Dialog, enter a value of 30 in the edit box. Uncheck the Show Queried Values check box. Select OK.
This shows the profile of excess pore pressure underneath the embankment decreasing with time.
3.3 Settlement
To see the settlement of the embankment, with the same stage settings:
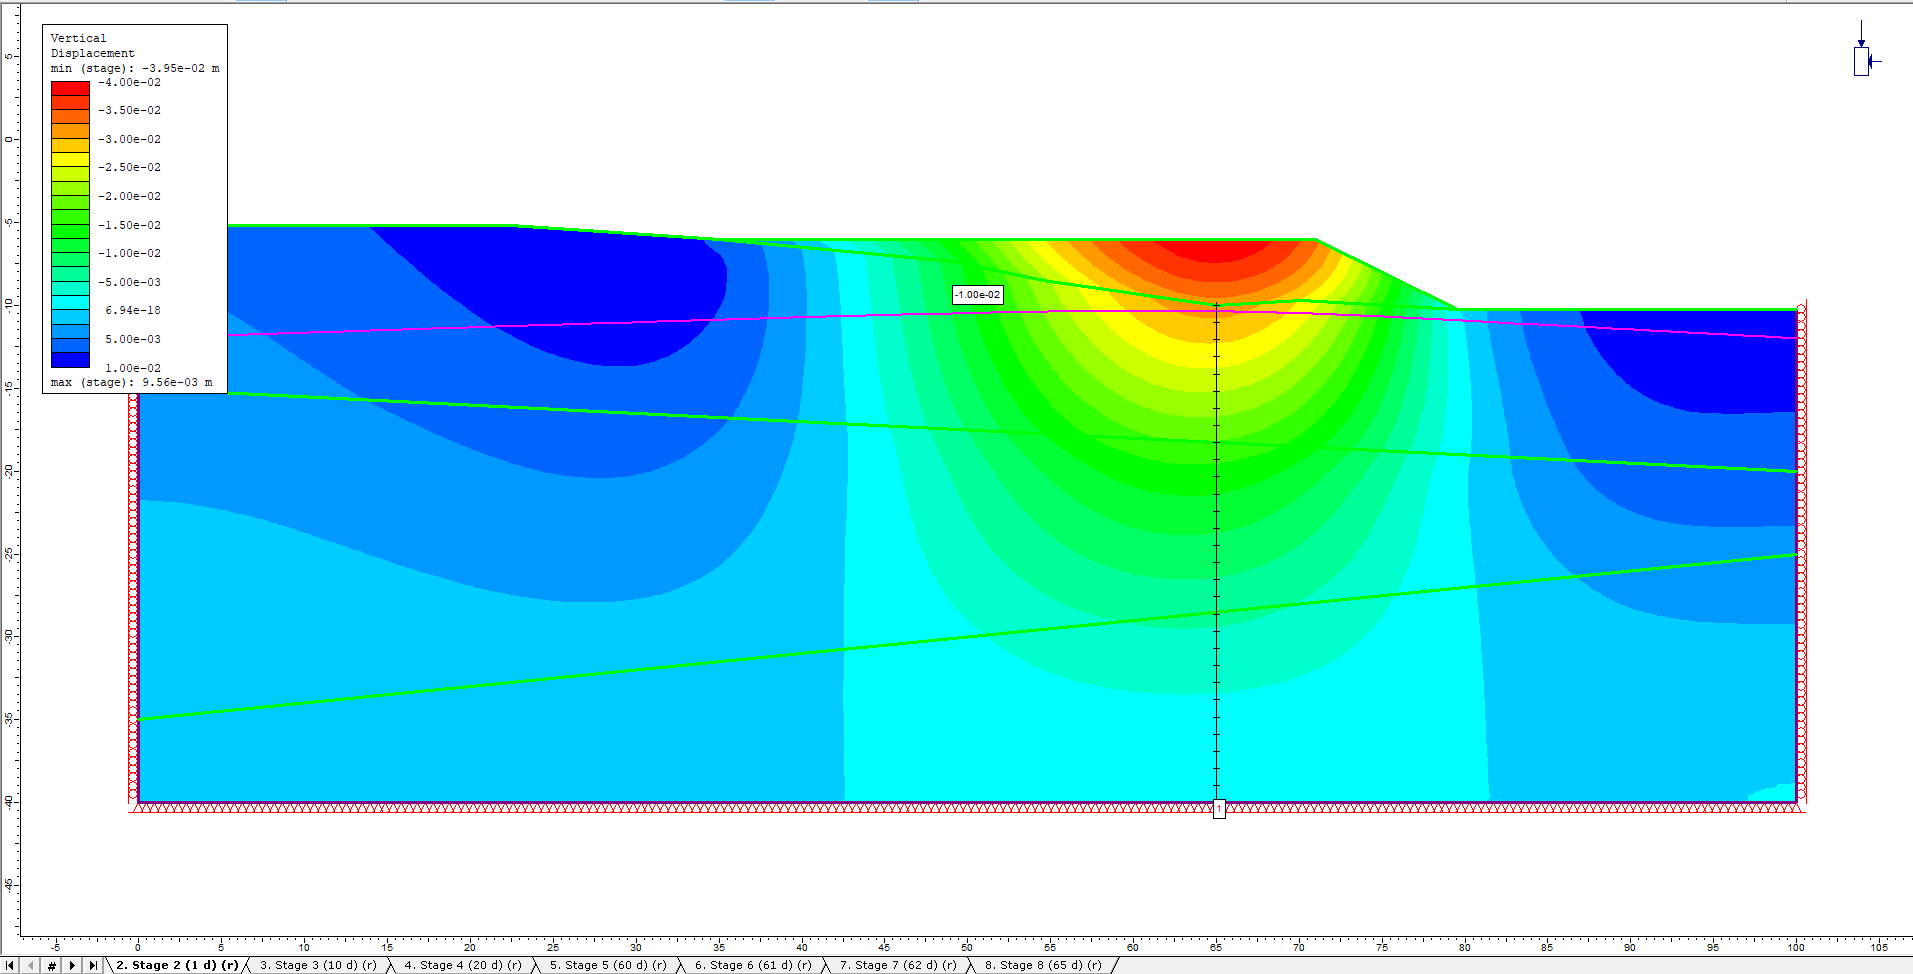
- Select: Solid Displacement > Vertical Displacement from the drop-down menu.
- In the Contour Options dialog, set Auto-Format = Cold to Hot.
At the point that the first lift is constructed, Stage 2, notice the settlement below the lift.
Click through the stages to see the change in the settlement as the embankment is constructed and traffic loads are added.
Additionally, to see the deformed shape:
- Select: View > Display Options
- In the Stress tab, under Deformations, check Deformed Contours.
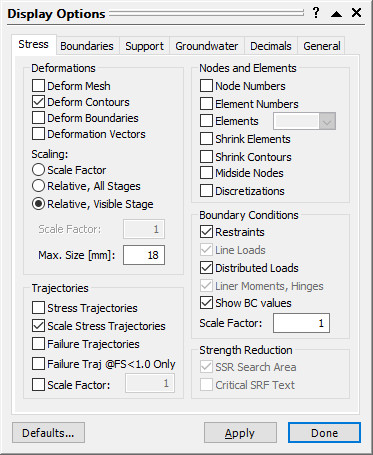
- Click Done to finish. The deformed contour for Stage 5 (60 d) is shown below:
- Turn off the deformed contour option.
Using the same material query, let’s plot the settlement below the embankment.
- Right-click on the query line, select Graph Data, and graph the settlement results for all stages.
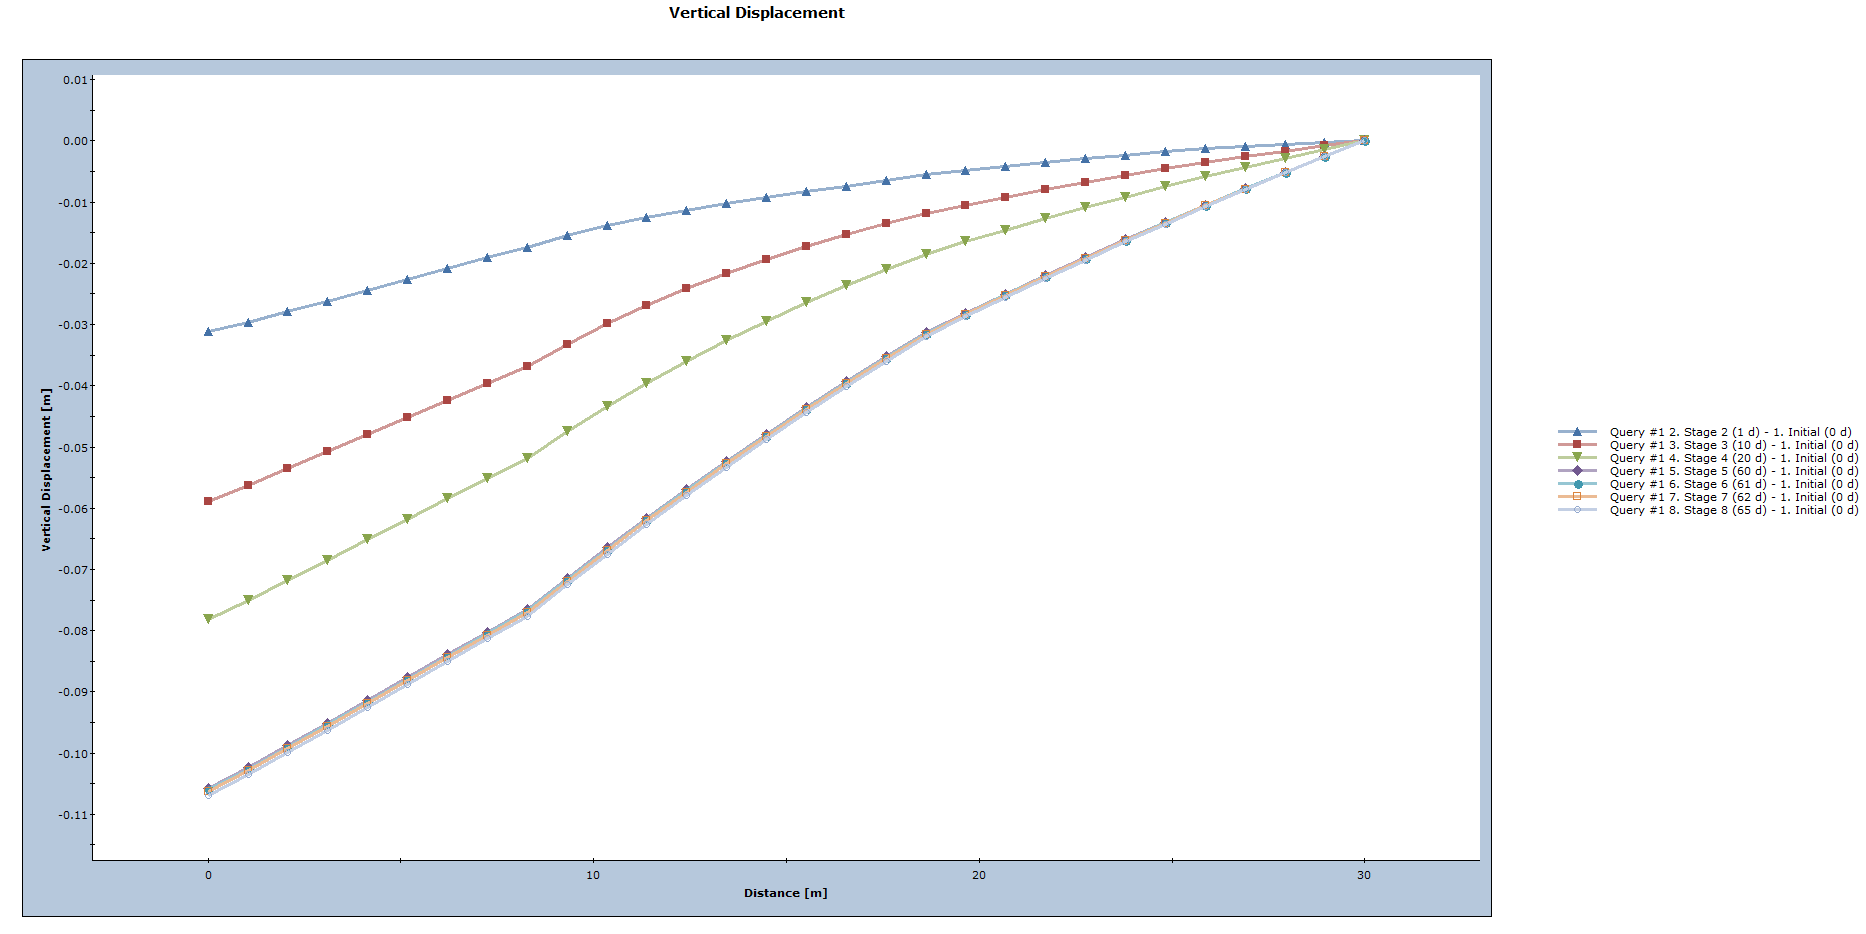
The vertical settlement underneath the embankment increases until stage 5 (addition of traffic loads) and then stays constant for the remaining stages.
This concludes the Embankment Consolidation Tutorial.